Global risk assets suffered significant drawdowns in October as capital markets experienced a fresh bout of volatility. Despite a late rally off intra-month lows, global equities were down across the board, with small caps dropping more than large caps and US equities falling roughly in line with global peers after almost single-handedly driving year-to-date global equity gains through September. Following year-to-date outperformance, global growth stocks were hit harder than value stocks amid a broadening sell-off among tech heavyweights. At the sector level, traditionally defensive sectors outperformed cyclicals. Global fixed income was mixed, with sovereign bonds outperforming riskier investment-grade and high-yield corporates. Global natural resources equities and energy MLPs experienced sharp losses as crude prices dropped with downgrades to projected global oil demand in the coming years, while developed markets REITs also fell but outperformed broader developed equities. Among currencies, the US dollar and Japanese yen rallied as investors sought safety, while the euro and UK sterling depreciated given a more uncertain political backdrop.
Several macroeconomic concerns may have contributed to last month’s market turbulence, including rising downside risks to global economic growth, firming beliefs that US economic and earnings growth have peaked, and growing fears of the US Federal Reserve tightening policy too quickly. Geopolitical risks also loomed large over the global outlook, as US-China tensions intensified (amid the Chinese economy’s ongoing slowdown) and the Trump administration’s Middle East policy and close relationship with Saudi Arabia were thrown into flux. Domestic political developments in the United States and Europe also weighed on markets. In the United States, political rhetoric intensified in the run-up to important mid-term elections, while support for mainstream parties in Europe continued to ebb and anti-establishment parties grew more emboldened. Italy’s new populist governing coalition defied the European Commission with its recent budget proposal, setting the stage for a showdown in the coming weeks, and German chancellor Angela Merkel announced her landmark decision to step down as party leader and that she will not seek another term in office. In addition, little official progress was made in Brexit negotiations between the United Kingdom and European Union, which are coming down to the wire if a disorderly breakup is to be avoided. Meanwhile, Eurozone growth slowed to a tepid pace, calling into question the European Central Bank’s (ECB’s) commitment to ceasing its asset purchase program at year end.
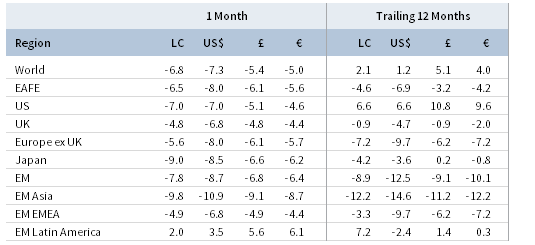
TOTAL RETURN FOR MSCI INDEXES (%)
US equities (-6.8% for the S&P 500) pulled back sharply from all-time highs reached in late September, flirting with major correction territory before a late month rally, resulting in the worst month for US stocks since September 2011. Small caps and high-flying tech stocks bore the brunt of the sell-off. Large-cap value stocks, while significantly outperforming other market segments, still suffered meaningful declines. The proximate cause of the plunge is being pinned on a number of factors, including the previously mentioned concerns that GDP and earnings growth have peaked and the potential for a policy mistake by the Fed, in addition to shorter-term technical headwinds such as the blackout period for corporate share buybacks sidelining a significant source of demand. The defensive consumer staples and utilities sectors posted modest gains, while the remaining nine sectors were in the red, with consumer discretionary, energy, and industrials falling the most. Despite the sell-off, third quarter earnings have thus far outperformed expectations with just over two-thirds of S&P 500 companies having reported. The latest earnings growth estimate of 24%, if it holds, would be the third consecutive quarter of 20%-plus growth. In addition, the economic data releases in October offered few signs of an impending slow down. A preliminary estimate of third quarter GDP suggested an above-consensus 3.5% annualized growth rate, driven by robust consumer spending and a strong positive contribution from often-volatile business inventory levels. In contrast, a housing market contraction in third quarter meant residential fixed investment was a significant drag on GDP. Yet, the unemployment rate ticked down to its lowest level since 1969, and the ISM non-manufacturing purchasing managers’ index (PMI) hit a record high, indicating strength in the US services sector.
European equities (-7.6% in USD, -5.3% in EUR, and -5.7% in GBP) performed roughly in line with the broader sell-off in global stocks. Political uncertainty ratcheted up to new heights as a result of limited progress on Brexit negotiations, a stand-off between the Italian government and the EU, and political developments in Germany. UK stocks outperformed Europe ex UK and EMU counterparts as European cohesion remains under threat, as does the future of the common currency. In an unprecedented move, the European Commission (EC) rejected the budget of a member state after the Italian government submitted plans for its fiscal deficit to reach 2.4% of GDP next year, three times higher than the target set by the previous administration, leaving the Conte administration three weeks to submit a new budget or potentially face EC sanctions. Further, through October, the United Kingdom and the EU had both refused to cede ground regarding the treatment of the Irish border post-Brexit, increasing the (still admittedly low) risk of the United Kingdom crashing out of the EU without a withdrawal agreement. Late in the month, German chancellor Angela Merkel announced she would step down as head of the ruling Christian Democratic Union (CDU) party and will not seek re-election following the CDU’s poorest regional election results in decades. Meanwhile, the ECB reiterated its previous policy guidance while highlighting growing risks and weaker forward-looking data. To make matters worse, Eurozone GDP growth disappointed, registering just a 0.2% quarter-over-quarter gain in third quarter, its weakest reading in four years.
Japanese equities (-8.5% in USD, -6.2% in EUR, and -6.6% in GBP) gave back all of their year-to-date gains and more, although returns in major currency terms were less negative due to broad yen strength amid the usual flight to safety. Economic data came in relatively positive in October, as household spending grew 2.8% year-over-year, significantly exceeding the expectations for a slight contraction. In addition, the manufacturing PMI came in above consensus and showed new export orders returning to expansion territory for the first time since May. However, these positive developments were overshadowed by the impending release of estimated third calendar quarter GDP, which could show a decline in light of recent natural disasters.
Despite year-to-date underperformance, emerging markets equities (-8.7% in USD, -6.4% in EUR, and -6.8% in GBP) weren’t spared from last month’s sell-off, trailing developed peers and suffering their worst monthly loss in local currency terms since the depths of the global financial crisis. Heavily weighted emerging Asia underperformed due in part to growing concerns about China’s economy as a result of the bitter trade dispute with the United States and the recent deterioration in Chinese economic data. China A-share equities, which are currently a de minimis part of the MSCI Emerging Markets Index, fell further into deep bear market territory; October marked the worst month for domestic-listed Chinese stocks since January 2016. Chinese authorities announced new rounds of targeted monetary and fiscal stimulus in order to help stem the slowdown, which included another 100 basis point (bp) cut to the reserve requirement ratio for some financial institutions as well as its first personal tax cut in seven years. In contrast, Latin America not only outperformed broad emerging markets, but stood out as the only region globally to record a positive return. The landslide victory for right-wing firebrand Jair Bolsonaro in the Brazilian presidential election ignited animal spirits for Brazilian assets due to his stances supporting pro-market reforms and his perceived intolerance for corruption. Notably, frontier markets equities (-3.5% in USD, -1.1% in EUR, and -1.5% in GBP) weathered the storm better than both EM and DM counterparts as index heavyweights Kuwait and Argentina suffered relatively modest losses.
Real assets also were not immune from October’s market turmoil. Commodity futures (-2.2% for the Bloomberg Commodity TR Index and -5.8% for the energy-heavy S&P GSCI™ Index) faltered as global growth prospects were downgraded. Energy and industrial metals, whose prices are heavily dependent on the strength of the global economy, were hit hardest, while losses were somewhat tempered by modest gains for precious metals and agriculture. Crude oil prices ($75.47 for Brent and $65.31 for WTI) fell as combined US, Saudi, and Russian production reached a record high and US inventories rose unexpectedly against downgrades to global demand. Energy MLPs (-8.0%) and global natural resources equities (-9.8% for the MSCI World Natural Resources Index in USD terms) reacted sharply to the drop in the underlying commodity prices. Developed markets REITs (-3.7% in USD terms) also fell but outperformed broader equity markets; UK REITs (-1.6%) outperformed both Europe ex UK REITs (-3.8%) and US REITs (-2.6%). Gold prices (2.0%) were the lone bright spot; rising in USD terms to $1,215.54 per troy ounce, benefiting from the flight to safety during a turbulent month for risk assets.
Global fixed income returns were mixed, providing little safety for investors looking to offset sharp losses in equities. US Treasuries (-0.5%) were slightly negative; losses were pared as an abrupt jump in ten-year yields north of 3.2% early in the month failed to hold ground. Likewise, the benchmark ten-year versus two-year spread widened intra-month to the steepest level since June before later settling back under 30 bps. Five- and ten-year Treasury yields closed the month higher than they began, rising 4 bps and 10 bps to end the month at 2.98% and 3.15%, respectively. UK gilts (0.9%) managed gains as five- and ten-year gilt yields dropped 14 bps each to 1.01% and 1.43%, respectively. Meanwhile, EMU government bonds (0.0%) were flat as declines in German bund yields were offset by a sharp rise in yields on Italian BTPs. US credit spreads widened as Treasuries outperformed both high-yield (-1.6%) and investment-grade (-1.5%) corporate bonds. Nominal Treasuries also outperformed US TIPS (-1.4%) and tax-exempt municipal bonds (-0.6%). Outside the United States, UK linkers (2.8%) posted solid gains, outperforming nominal gilts.
Most traditional safe-haven currencies rallied in October as volatility abruptly returned to risk asset markets, while those exposed to negative political developments in Europe fared poorly. The Japanese yen performed its traditional safe-haven role, appreciating against all major currencies. The US dollar was stronger against all major currencies save for the yen, appreciating the most against the Swiss franc and euro. The euro was broadly weaker, weighed down by rising political uncertainty, although the common currency managed slight gains against the Swiss franc. UK sterling generally fared better than the euro but depreciated as well, suffering its largest losses versus the yen and US dollar.
Currency Performance as of October 31, 2018
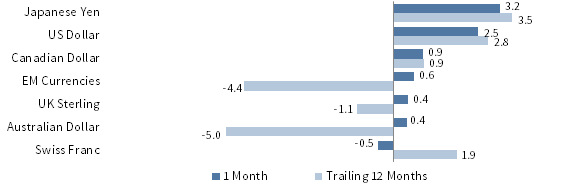
The US dollar strengthened against all major currencies save for the safe-haven Japanese yen, appreciating the most relative to the Swiss franc and euro. This is in line with the trailing 12 months, in which the greenback is down only relative to the Japanese yen.
VERSUS THE US DOLLAR
Total Return (%)
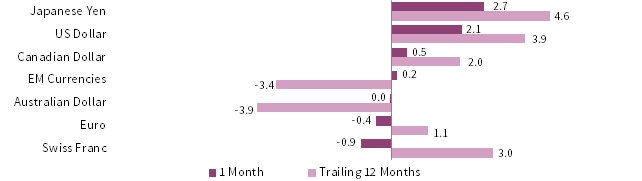
The euro broadly depreciated last month, weakening the most relative to the Japanese yen and US dollar and managing gains against only the Swiss franc. Over the past year the common currency was mixed, rising the most against the AU dollar and EM currencies but falling the most versus the Japanese yen and US dollar.
VERSUS THE EURO
Total Return (%)
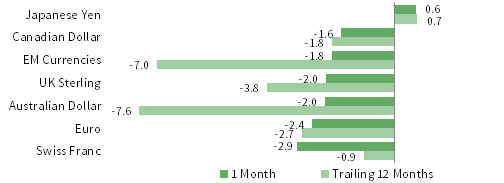
UK sterling was mostly weaker in October, depreciating the most against the Japanese yen and US dollar. Over the trailing 12 months, sterling depreciated against all but the AU dollar and EM currencies.
VERSUS THE POUND STERLING
Total Return (%)
Note: EM currencies is an equal-weighted basket of 20 currencies.
USD Market Performance as of October 31, 2018
Positive returns were few and far between last month; global equities sold off with US small caps and EM stocks falling the most, while US T-bills were the only asset class to eke out a gain. Fixed income assets also declined as US high-yield and IG corporate bonds underperformed Treasuries.

INDEX PERFORMANCE (US$)

COMPOSITE NORMALIZED P/E: MSCI US
December 31, 1969 – October 31, 2018

FIXED INCOME YIELDS
October 2017 – October 2018
Sources: Bloomberg Index Services Limited, Bloomberg L.P., FTSE International Limited, Frank Russell Company, Intercontinental Exchange, Inc., J.P. Morgan Securities, Inc., MSCI Inc., National Association of Real Estate Investment Trusts, Standard & Poor’s, and Thomson Reuters Datastream. MSCI data provided “as is” without any express or implied warranties.
EUR Market Performance as of October 31, 2018
EM and European equities led declines among most global risk assets in October; modest gains for EM local currency debt were the exception. Commodities fell, but outgained Europe ex UK REITs and DM equities over the trailing 12 months. IG euro-denominated bonds were roughly flat, outperforming high-yield equivalents.
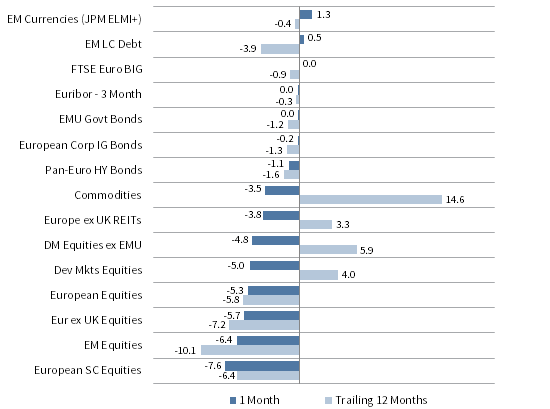
INDEX PERFORMANCE (€)
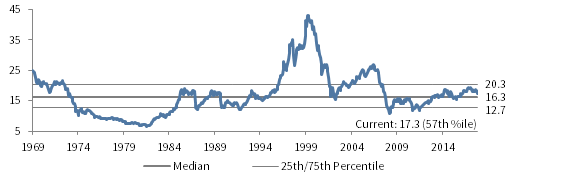
COMPOSITE NORMALIZED P/E: MSCI EUROPE EX UK
December 31, 1969 – October 31, 2018
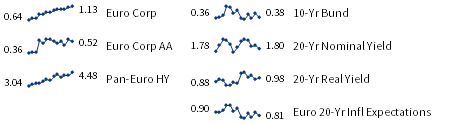
FIXED INCOME YIELDS
October 2017 – October 2018
Sources: Bloomberg Index Services Limited, Bloomberg L.P., EPRA, FTSE International Limited, J.P. Morgan Securities, Inc., MSCI Inc., National Association of Real Estate Investment Trusts, Standard & Poor’s, and Thomson Reuters Datastream. MSCI data provided “as is” without any express or implied warranties.
GBP Market Performance as of October 31, 2018
Global equities sold off last month, with EM equities, UK mid caps, and Europe ex UK stocks falling the most. UK REITs also declined but outperformed domestic equities. UK linkers led fixed income returns, outgaining nominal UK investment-grade bonds, and EM local currency debt, while UK high-yield bonds slightly declined.

INDEX PERFORMANCE (₤)
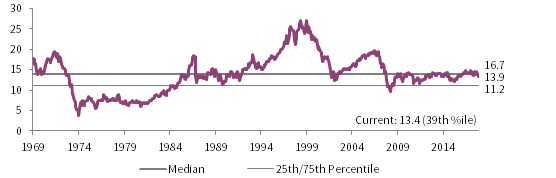
COMPOSITE NORMALIZED P/E: MSCI UK
December 31, 1969 – October 31, 2018

FIXED INCOME YIELDS
October 2017 – October 2018
Sources: Bloomberg Index Services Limited, Bloomberg L.P., EPRA, FTSE International Limited, Intercontinental Exchange, Inc., J.P. Morgan Securities, Inc., MSCI Inc., National Association of Real Estate Investment Trusts, Standard & Poor’s, and Thomson Reuters Datastream. MSCI data provided “as is” without any express or implied warranties.
Exhibit Notes
Performance Exhibits
Total return data for all MSCI indexes are net of dividend taxes.
US dollar index performance chart includes performance for the Bloomberg Barclays Aggregate Bond, Bloomberg Barclays Corporate Investment Grade, Bloomberg Barclays High Yield Bond, Bloomberg Barclays Municipal Bond, Bloomberg Barclays US TIPS, Bloomberg Barclays US Treasuries, ICE BofAML 91-Day Treasury Bills, FTSE® NAREIT All Equity REITs, J.P. Morgan ELMI+, J.P. Morgan GBI-EM Global Diversified, MSCI Emerging Markets, MSCI World, Russell 2000® , S&P 500 and S&P GSCI™ indexes.
Euro index performance chart includes performance for the Bloomberg Barclays Euro-Aggregate: Corporate, Bloomberg Barclays Pan-Euro High Yield, FTSE EMU Govt Bonds, FTSE Euro Broad Investment-Grade Bonds, EURIBOR 3M, FTSE® EPRA/NAREIT Europe ex UK RE, J.P. Morgan ELMI+, J.P. Morgan GBI-EM Global Diversified, MSCI Emerging Markets, MSCI Europe, MSCI Europe ex UK, MSCI Europe Small-Cap, MSCI World ex EMU, MSCI World, and S&P GSCI™ indexes.
UK sterling index performance chart includes performance for the Bloomberg Barclays Sterling Aggregate: Corporate Bond, ICE BofAML Sterling High Yield, FTSE® 250, FTSE® All-Share, FTSE British Government All Stocks, FTSE British Government Index-Linked All Stocks, FTSE® EPRA/NAREIT UK RE, J.P. Morgan ELMI+, J.P. Morgan GBI-EM Global Diversified, LIBOR 3M GBP, MSCI Emerging Markets, MSCI Europe ex UK, MSCI World, MSCI World ex UK, and S&P GSCI™ indexes.
Valuation Exhibits
The composite normalized P/E ratio is calculated by dividing the inflation-adjusted index price by the simple average of three normalized earnings metrics: ten-year average real earnings (i.e., Shiller earnings), trend-line earnings, and return on equity–adjusted earnings. We have removed the bubble years 1998–2000 from our mean and standard deviation calculations. All data are monthly.
Fixed Income Yields
US fixed income yields reflect Bloomberg Barclays Municipal Bond Index, Bloomberg Barclays US Corporate High Yield Bond Index, Bloomberg Barclays US Corporate Investment-Grade Bond Index, and the ten-year Treasury.
European fixed income yields reflect the ICE BofAML Euro Corporate AA Bond Index, ICE BofAML Euro Corporate Bond Index, Bloomberg Barclays Pan-European Aggregate High Yield Bond Index, Bloomberg Twenty-Year European Government Bond Index (nominal), ten-year German bund, 20-year European Inflation Swaps (inflation expectations), and the real yield calculated as the difference between the inflation expectation and nominal yield.
UK sterling fixed income yields reflect the ICE BofAML Sterling Corporate AA Bond Index, ICE BofAML Sterling Corporate Bond Index, UK ten-year gilts, Bank of England 20-year nominal yields, and Bloomberg Generic UK 20-year inflation-linked (real) yields.