Capital markets performance was generally positive in October, bolstered by improving economic growth, strong earnings results, and market-friendly political and policy developments. Global equities continued their year-long advance. Emerging markets outperformed developed markets, and global growth stocks resumed market leadership over value counterparts. Global government bonds underperformed global equities as rising US Treasury yields weighed on returns. Real assets performance was mixed as global natural resources equities and commodities advanced, but global REITs (in USD terms) and energy MLPs declined. Among currencies, the US dollar and UK sterling strengthened, while the euro declined.
The global macroeconomic and corporate earnings backdrop remains supportive of risk assets, and recent political developments should generally ensure economic policy continuity, with highly accommodative monetary policy expected to tighten only very gradually and fiscal policy in some cases set to become more stimulative going forward. Coming on the heels of German Prime Minister Angela Merkel’s re-election in September, Japan’s snap election last month enabled Prime Minister Shinzo Abe’s ruling coalition to maintain its supermajority in the lower house, while China’s 19th Party Congress solidified President Xi Jinping’s power for years to come. Even in the United States, despite more volatile political headlines, Republicans managed to make progress toward tax reform, and President Trump is now expected to nominate current US Federal Reserve Governor Jerome Powell, and not the more hawkish academic John Taylor, to succeed Janet Yellen as Fed chair. Germany’s election result could mean more domestic fiscal support as the announcement of a possible new coalition led the long-serving, austerity-minded finance minister to transition away from his current role, although a weakened Merkel means German political scrutiny of the European Central Bank’s (ECB’s) ultra-accommodative policy could increase. Still, the ECB pulled off a “dovish taper” in October, announcing its plan to gradually begin removing stimulus in January but signaling that it will likely remain highly accommodative longer than the market anticipated. Similarly in Japan, the ruling coalition’s victory could slow fiscal consolidation and should sustain the Bank of Japan’s (BOJ’s) substantial monetary easing, either through the reappointment of current BOJ Governor Haruhiko Kuroda, or a like-minded successor, for the next five-year term.
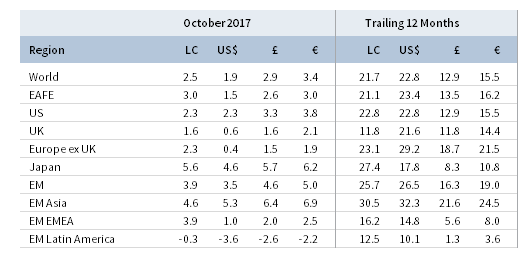
TOTAL RETURN FOR MSCI INDEXES (%)
US equities (2.3% for the S&P 500 Index) advanced for the 12th consecutive month and are now up 16.9% year-to-date. US stock indexes again set new record highs as economic and earnings growth both exceeded expectations, although US small caps (0.9%) underperformed. Third quarter GDP grew an estimated 3.0%, marking the fastest six-month stretch of growth in three years despite the impact of the recent hurricanes. With a little over half of S&P 500 companies reporting, third quarter earnings are now expected to grow 5% year-over-year, above earlier estimates, and over 50% of companies reported have also raised full-year 2017 earnings guidance. The IT sector is generating the second highest earnings growth, after energy, which contributed to IT stocks outperforming in October. While earnings growth for most sectors looks strong, the insurance industry is reporting the largest percentage decline due to catastrophic losses caused by the recent hurricanes and the earthquake in Mexico; excluding the insurance industry, third quarter earnings are expected to grow 7% year-over-year.
European equities (2.1%) underperformed developed markets peers. EMU stocks (2.4%) edged out Europe ex UK (2.3%) and UK (1.6%) equivalents in local currency terms. With almost 40% of Stoxx 600 companies reporting, earnings growth for third quarter is estimated to be 6%. Macro data for the region were more mixed as Eurozone GDP growth was better than expected, while inflation missed forecasts. UK inflation hit its highest level in over five years, and the Bank of England is widely expected to announce an interest rate increase this week, its first rate hike since 2007.
Japanese equities (5.6%) outperformed developed markets peers as the election result and continued strong earnings growth were boons for the market. The incumbent Liberal Democratic Party (LDP)-Komeito coalition exceeded expectations in last month’s snap election, maintaining its supermajority in Japan’s lower house and ensuring that Abenomics will continue. Following the election, the BOJ kept monetary policy unchanged as expected and maintained its growth forecasts but slightly downgraded its inflation expectations. On the back of the election win, Prime Minister Abe demanded Japanese companies lift pay by 3% next year. It is still early in the earnings cycle for Japan, with less than a quarter of companies reporting, but early results have been strong for the fourth quarter in a row.
Emerging markets equities (3.5% in USD, 4.6% in GBP, and 5.0% in EUR) continued to outperform developed markets counterparts, despite headwinds from US dollar strength. Heavily weighted emerging Asia outperformed emerging Europe, the Middle East & Africa and Latin America, the latter having declined. India (7.4%), Korea (8.4%), and Taiwan (6.3%) were primary drivers of Asia’s outperformance in USD terms. Indian stocks reacted positively to the government’s announced $32 billion bailout for state-controlled banks that will be rolled out over two years, and reflecting the Modi government’s economic reform progress, India jumped 30 places in the World Bank’s latest Doing Business rankings. China, at nearly 30% by far the largest country in the index, performed in line with broader emerging markets and has now returned 48.9% in USD year-to-date.
Real assets performance varied but was mostly positive. Commodity futures advanced (2.1% for the Bloomberg Commodity TR Index and 3.8% for the energy-heavy S&P GSCITM Index), led by gains in the energy, industrial metals, and livestock categories. Oil prices ($61.37 for Brent and $54.38 for WTI) increased, but conflicting impacts from Hurricanes Harvey and Irma caused continued divergence between Brent and WTI, as the former touched its highest point since 2015. Higher oil prices were driven in part by military tensions in the Kurdish region of Iraq following its independence referendum, as well as due to expectations that OPEC and Russia will agree to extend supply cuts into 2018. Global natural resources equities (0.7% for the MSCI World Natural Resources Index in USD terms) gained but underperformed global stocks, while energy MLPs (-4.1%) declined as one of the larger constituents cut its distribution, hurting sentiment. Global REITs (-0.4% in USD terms) also fell; Europe ex UK REITs (1.4%) outperformed US REITs (0.1%) and UK REITs (-0.1%). After advancing in third quarter, gold declined 1.1% to $1,269.46/troy ounce as the US dollar strengthened.
Global government bond performance was mixed. EMU government bonds (1.1%) and UK gilts (0.3%) advanced, while US Treasuries (-0.1%) slightly declined. The US Treasury yield curve shifted up and flattened slightly; yields for the five- and ten-year gained 9 basis points (bps) and 5 bps to finish at 2.01% and 2.38%, respectively. Five-year UK gilt yields gained 1 bp, while ten-year UK gilt yields fell 1 bp, finishing the month at 0.79% and 1.39%, respectively. US credit spreads narrowed as US high-yield bonds (0.4%) and US investment-grade corporate bonds (0.4%) both outperformed Treasuries. Among developed markets inflation-linked bonds, UK linkers (0.9%) and US TIPS (0.2%) outperformed nominal counterparts as breakevens moved higher along with oil prices and headline inflation.
The US dollar continued the rally from September, strengthening against all major developed markets currencies and our equal-weighted basket of EM currencies. The euro strengthened against the Canadian dollar, Swiss franc, and Australian dollar but retreated against the US dollar, Japanese yen, UK sterling, and our equal-weighted basket of EM currencies. Continuing recent trends, UK sterling strengthened against most major currencies and our basket of EM currencies, but weakened against the US dollar and Japanese yen.
Market Exhibits
Currency Performance as of October 31, 2017
The US dollar strengthened against all major DM currencies and our EM currency basket in October, continuing the rally that began in September after the greenback had weakened since the start of the year. Only the Japanese yen and Swiss franc have depreciated versus USD over the past 12 months.
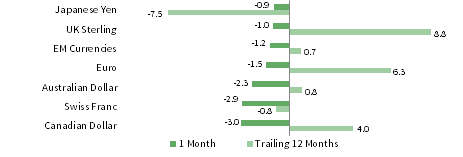
VERSUS THE US DOLLAR
Total Return (%)
The euro weakened against the US dollar, Japanese yen, UK sterling, and our EM currency basket but strengthened relative to the Canadian dollar, Swiss franc, and Australian dollar. Over the past year, the euro has appreciated against every major currency except for UK sterling.
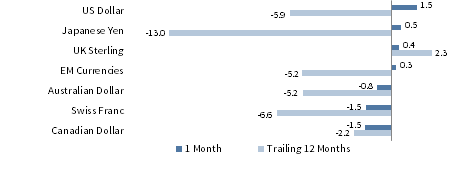
VERSUS THE EURO
Total Return (%)
UK sterling advanced on rate hike expectations as inflation touched its highest level in five years. The pound strengthened against the Canadian dollar, Swiss franc, Australian dollar, euro, and our EM currency basket, though it weakened against the US dollar and Japanese yen.
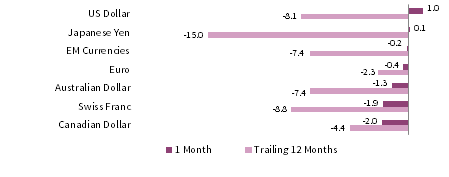
VERSUS THE POUND STERLING
Total Return (%)
Sources: MSCI Inc. and Thomson Reuters Datastream. MSCI data provided “as is” without any express or implied warranties.
Note: EM currencies is an equal-weighted basket of 20 currencies.
USD Market Performance as of October 31, 2017
Commodities and EM equities led risk assets higher, while US stocks outperformed developed markets equivalents, domestic bonds, and US REITs in October. The yield curve flattened and short-term T-Bills outperformed longer-dated Treasuries, as did US high-yield and investment-grade corporates.

INDEX PERFORMANCE (US$)

COMPOSITE NORMALIZED P/E: MSCI US
December 31, 1969 – October 31, 2017

FIXED INCOME YIELDS
October 2016 – October 2017
Sources: Barclays, Bloomberg L.P., BofA Merill Lynch, FTSE International Limited, Frank Russell Company, J.P. Morgan Securities, Inc., MSCI Inc., National Association of Real Estate Investment Trusts, Standard & Poor’s, and Thomson Reuters Datastream. MSCI data provided “as is” without any express or implied warranties.
Euro Market Performance as of October 31, 2017
Most asset classes experienced gains in euro terms, led by commodities and EM equities. Developed ex EMU stocks outperformed European equivalents, and European small caps outperformed large caps and REITs. Investment-grade European bonds gained in October but are barely positive over the past year.
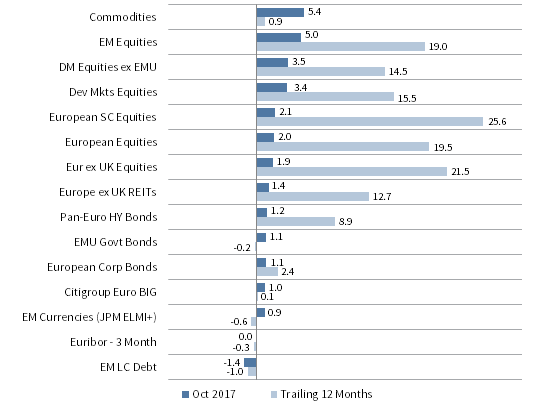
INDEX PERFORMANCE (€)

COMPOSITE NORMALIZED P/E: MSCI EUROPE EX UK
December 31, 1969 – October 31, 2017
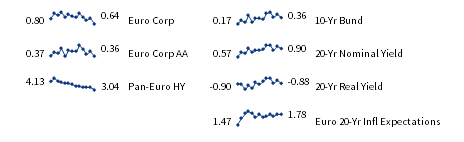
FIXED INCOME YIELDS
October 2016 – October 2017
Sources: Barclays, Bloomberg L.P., Citigroup Global Markets, EPRA, FTSE International Limited, J.P. Morgan Securities, Inc., MSCI Inc., National Association of Real Estate Investment Trusts, Standard & Poor’s, and Thomson Reuters Datastream. MSCI data provided “as is” without any express or implied warranties.
GBP Market Performance as of October 31, 2017
Sterling investors enjoyed solid returns in October despite currency strength. EM equities continued to outperform DM stocks, and UK mid-caps bested domestic large caps. UK high-yield and investment-grade corporates outperformed UK gilts. Commodities rallied sharply but remain down over the year.
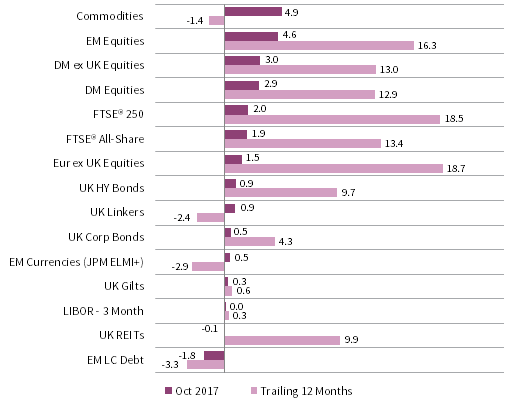
INDEX PERFORMANCE (£)

COMPOSITE NORMALIZED P/E: MSCI UK
December 31, 1969 – October 31, 2017

FIXED INCOME YIELDS
October 2016 – October 2017
Sources: Barclays, Bloomberg L.P., BofA Merill Lynch, EPRA, FTSE International Limited, J.P. Morgan Securities, Inc., MSCI Inc., National Association of Real Estate Investment Trusts, Standard & Poor’s, and Thomson Reuters Datastream. MSCI data provided “as is” without any express or implied warranties.
Exhibit Notes
Performance Exhibits
Total return data for all MSCI indexes are net of dividend taxes.
US dollar index performance chart includes performance for the Bloomberg Barclays Aggregate Bond, Bloomberg Barclays Corporate Investment Grade, Bloomberg Barclays High-Yield Bond, Bloomberg Barclays Municipal Bond, Bloomberg Barclays US TIPS, Bloomberg Barclays US Treasuries, BofA Merrill Lynch 91-Day Treasury Bills, FTSE® NAREIT All Equity REITs, J.P. Morgan ELMI+, J.P. Morgan GBI-EM Global Diversified, MSCI Emerging Markets, MSCI World, Russell 2000®, S&P 500, and S&P GSCI™ indexes.
Euro index performance chart includes performance for the Bloomberg Barclays Euro-Aggregate: Corporate, Bloomberg Barclays Pan-Euro High Yield, Citigroup EMU Govt Bonds, Citigroup Euro Broad Investment-Grade Bonds, Euribor 3-month, FTSE® EPRA/NAREIT Europe ex UK, J.P. Morgan ELMI+, J.P. Morgan GBI-EM Global Diversified, MSCI Emerging Markets, MSCI Europe, MSCI Europe ex UK, MSCI Europe Small-Cap, MSCI World ex EMU, MSCI World, and S&P GSCI™ indexes.
UK sterling index performance chart includes performance for the Bloomberg Barclays Sterling Aggregate: Corporate Bond, BofA Merrill Lynch Sterling High Yield, FTSE® 250, FTSE® All-Share, FTSE® British Government All Stocks, FTSE® British Government Index-Linked All Stocks, FTSE® EPRA/NAREIT UK RE, J.P. Morgan ELMI+, J.P. Morgan GBI-EM Global Diversified, LIBOR 3M GBP, MSCI Emerging Markets, MSCI Europe ex UK, MSCI World, MSCI World ex UK, and S&P GSCI™ indexes.
Valuation Exhibits
The composite normalized P/E ratio is calculated by dividing the inflation-adjusted index price by the simple average of three normalized earnings metrics: ten-year average real earnings (i.e., Shiller earnings), trend-line earnings, and return on equity–adjusted earnings. We have removed the bubble years 1998–2000 from our mean and standard deviation calculations. All data are monthly.
Fixed Income Yields
US fixed income yields reflect Bloomberg Barclays Municipal Bond Index, Bloomberg Barclays US Corporate High-Yield Bond Index, Bloomberg Barclays US Corporate Investment-Grade Bond Index, and the ten-year Treasury.
European fixed income yields reflect the BofA Merrill Lynch Euro Corporate AA Bond Index, BofA Merrill Lynch Euro Corporate Bond Index, Barclays Pan-European Aggregate High Yield Bond Index, Bloomberg Twenty-Year European Government Bond Index (nominal), ten-year German bund, 20-year European Inflation Swaps (inflation expectations), and the real yield calculated as the difference between the inflation expectation and nominal yield.
UK sterling fixed income yields reflect the BofA Merrill Lynch Sterling Corporate AA Bond Index, BofA Merrill Lynch Sterling Corporate Bond Index, UK ten-year gilts, Bank of England 20-year nominal yields, and Bloomberg Generic UK 20-year inflation-linked (real) yields. Current UK 20-year nominal yield data are as of October 30, 2017.