Global markets wobbled in October as most asset classes declined. On a broad basis, both equities and bonds were negative, with global government bonds underperforming equities as bond yields rose sharply. Strong downward moves in the pound sterling, yen, and euro versus the US dollar pulled down developed markets equity returns in USD terms; on a local currency basis US equities were the worst-performing major developed equity market. Emerging markets equities, in contrast, were in the black, and their outperformance of developed counterparts was even greater in foreign currency terms given largely stable emerging markets currencies. Corporate credits outperformed government bonds as global high-yield bonds enjoyed small gains. Real assets mostly declined as oil prices failed to hold earlier gains with an OPEC supply agreement increasingly in doubt; higher bond yields also weighed on precious metals prices, as well as the high-yielding REIT and energy MLP categories.
It is becoming increasingly clear that monetary policy is reaching its natural limits as deflation risks somewhat subside despite still sluggish growth and with the specter of political risks on the horizon. The latter contributed to increased volatility for the month, particularly with respect to UK assets as the British pound dropped and gilts sold off amid heightened fears that the UK government will pursue a “hard Brexit” from the European Union in the upcoming Article 50 negotiations. Such a scenario would mean the United Kingdom forfeits unfettered access to the EU common market for British goods and services, including financial products, to regain sovereignty over immigration policies. Political developments also contributed to US equities’ underperformance as late-breaking news in the US presidential contest created renewed uncertainty over whether Hillary Clinton or Donald Trump will win the country’s November 8 election. A renewed focus on monetary policy divergence also played a role in relative currency and asset price moves as rising expectations that the US Federal Reserve will deliver another rate hike in December helped push the US dollar higher versus pound sterling, euro, and yen. Within global equities, sharply higher government bond yields helped drive relative sector performance—financials led cyclical sectors to meaningfully outperform defensives. Value stocks beat their growth counterparts as well.
US equities (-1.8%) suffered their worst month since January despite record merger & acquisition announcements and growing indications that the recent earnings recession has come to an end. Third quarter results to date for the S&P 500 have comfortably exceeded previously downgraded expectations, with consensus blended estimates now showing year-over-year growth for the first time in over a year. Financials delivered some of the more positive surprises, particularly on Wall Street with better than expected trading profits reported by the bulge bracket US investment banks. US bank stocks also benefitted from sharply higher bond yields as growth and inflation trends increasingly point toward a Fed rate hike in December that would ease some pressure from bank net interest margins. Financials’ strong month made mega-cap value the best performing US market segment; small-cap growth was the worst. Overall, US small caps (-4.8%) gave back much of their prior year-to-date outperformance, trailing large caps by 280 basis points (bps) in October.
European equities (0.3%) outpaced global developed markets; gains in the Eurozone (1.3%) and the United Kingdom (0.9%) were offset by losses in Switzerland (-3.5%) and Denmark (-4.0%). Small caps (-1.2%) in Europe underperformed large caps (0.7%). As in the United States, third quarter results season for European companies has gone better than expected, particularly for banks, materials, and health care stocks, although that did not prevent the latter from substantially underperforming in October. Earnings results to date for consumer staples have largely disappointed in contrast, contributing to their underperformance for the month.
Japanese equities (5.1%) outperformed all major developed markets, but yen weakness ate into those returns for unhedged USD investors. Financials were the best performing sector as Japanese bank stocks rallied following the Bank of Japan’s late September policy announcement to begin targeting a 0.0% yield for ten-year government bonds to ease the strain on banks from the BOJ’s negative interest rate policy. Currency weakness and positive earnings results also contributed to the outperformance of the more export-oriented materials, consumer discretionary, information technology, and industrials sectors.
Emerging markets (0.6%) outperformed developed markets equivalents (-0.7%). This was entirely driven by strong returns in Latin America (7.5%) that were nearly totally offset by slight declines in heavily weighted emerging Asia (-0.4%) and in emerging Europe, the Middle East, and Africa (-0.4%). Brazil (11.1%) was the top performing country as the stock market continued to rally amid hopes of better economic policies following former President Dilma Rousseff’s August impeachment. Political risks weighed on the Philippines (-2.9%), South Africa (-2.9%), and Thailand (-1.3%), with the latter mourning the death of its longstanding monarch. Sentiment toward emerging markets equities remained positive but was more subdued, as indicated by lower estimated inflows from foreign portfolio investors in October than in recent months. China’s official third quarter GDP estimate, although right in line with the government’s 6.5% target for 2016, belied further weakening of the Chinese yuan and a pickup in capital outflows from Chinese residents.
Real assets mostly declined, with the exception of developed natural resources equities (0.4% for the MSCI World Natural Resources Index), which benefitted from healthy gains in metals and mining stocks despite lower precious metals prices. The gold spot price declined 3.6%, closing at $1,273.88/troy ounce, as higher bond yields weighed on sentiment for gold as they did for high-yielding assets such as developed REITs (-5.7%) and energy MLPs (-4.5%). Commodity futures (-0.5% for the Bloomberg Commodity TR Index and -1.5% for the energy-heavy S&P GSCI™) experienced small losses due to declines in the energy and precious metals categories. Crude oil prices failed to hold earlier gains as a tentative agreement among OPEC members to curb their supply looked increasingly fraught amid disputes over production by key members and geopolitical rivals Iran and Iraq. WTI fell 2.9% and Brent dropped 1.5%, closing the month at $46.86 and $48.30, respectively.
Global developed markets government bonds (-1.5%) sold off as sovereign yields continued their rebound from record lows observed over the summer amid growing recognition that global growth is bottoming and further monetary easing may not be forthcoming. Ten-year yields for US, German, and UK government bonds jumped 24 bps, 29 bps, and 48 bps, respectively, in October alone. UK gilts (-3.9%) fell sharply as currency weakness due to heightened fears of a “hard Brexit” contributed to rising inflation expectations, and as a better than expected third quarter GDP growth estimate demonstrated the economy’s resilience so far in the face of the shock referendum result. US Treasuries (-1.1%) were similarly impacted by a somewhat better growth outlook, with third quarter GDP rising 2.9% annualized versus about 1.0% in the first half of 2016, as well as rising expectations for a December rate hike. US tax-exempt bonds (-1.0%) were slightly ahead of US Treasuries. US corporate credit spreads contracted and US high-yield bonds (0.4%) posted small gains at the index level. Global linkers (-0.7%) outperformed nominal bonds, led by returns for US TIPS (-0.4%) and UK linkers (-0.6%).
The US dollar strengthened against all major currencies and an equal-weighted basket of emerging markets currencies; notable exceptions were the Brazilian real, Mexican peso, and South African rand. The potential for a complete split from the European Union drove the British pound sharply lower in October versus every currency we track. Sterling has now dropped 18% versus the US dollar since the June 23 referendum and 29% since the July 2014 peak, in line with the pound’s median full cycle decline since 1972. The euro weakened versus the US dollar, Australian dollar, EM currency basket, Canadian dollar, and Swiss franc, but strengthened relative to the UK pound and Japanese yen.
Market Exhibits
Comparing Current Decline in GBP/USD to Historical Declines
Fears that the UK government will pursue a “hard Brexit” from the EU in upcoming negotiations drove the pound sharply weaker in October. Sterling has now dropped 18% versus the US dollar since the June 23 referendum and 29% since the July 2014 peak, in line with the currency’s median full cycle decline since 1972
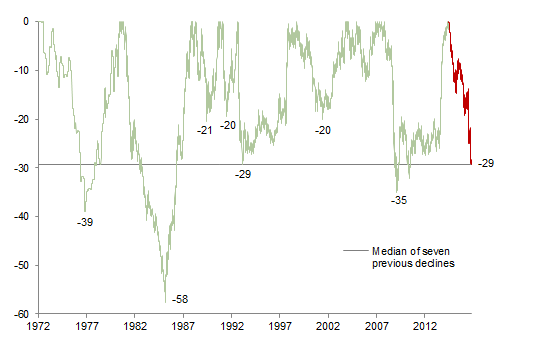
Comparing Current Decline in GBP/USD to Historical Declines
January 1, 1972 – October 31, 2016 • Percent (%) Decline From Recent High
Notes: Data are daily. The pound has fallen 29% from the high on July 2, 2014, to the low on October 25, 2016. This does not imply the pair has reached a final low for this cycle.
US Consumer Price Inflation Trends
Trend US inflation has been slowly picking up over the past one to two years, and markets believe the Fed will deliver another rate hike at its December meeting. Yet the Fed’s preferred trend inflation measure, the Core PCE Index, remains below its 2% target, reinforcing the view that this tightening cycle will be gradual and shallow relative to its predecessors

US Consumer Price Inflation Trends
September 30, 2013 – September 30, 2016 • Year-Over-Year Percent Change (%)
Notes: Core CPI and core PCE exclude food and energy prices. Median CPI represents Cleveland Fed median CPI and is a median of the CPI components.
Third Quarter 2016 US Revenue and Earnings Results vs Expectations
Third quarter results to date for the S&P 500 have comfortably exceeded previously downgraded expectations, with financials delivering some of the more positive surprises, particularly on Wall Street with better than expected trading profits reported by the bulge bracket US investment banks
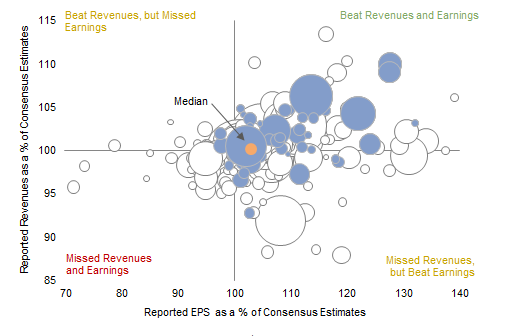
Third Quarter 2016 US Revenue and Earnings Results vs Expectations
As of October 31, 2016
Notes: Companies in the financial sector shown in blue. Analysis based on 307 companies that reported Q3 results as of October 31, 2016. There are 38 outlier firms whose earnings or revenue deviations were greater than the scale of the graph. For 24 of the firms shown in the chart, the quarterly results reflect the three months ending August 31, 2016, rather than September 30, 2016. Size of bubble based on market cap.
MSCI World Returns by Sector
Better results and the prospective benefit to net interest margins from higher bond yields mean that financials were the best performing developed markets sector in October after previously trailing every sector this year through September. Cyclical sectors in general outperformed their defensive counterparts for the month as rising bond yields hurt the relative attractiveness of sectors like health care, telecom services, and real estate

MSCI World Returns by Sector
As of October 31, 2016 • Percent (%)
Notes: All data are local currency. Real estate became its own sector as of September 1, 2016; therefore YTD performance is not shown.
Currency Performance
The US dollar rose against all major developed markets currencies in October; only the Japanese yen and Australian dollar are stronger relative to USD over the last 12 months. The greenback also appreciated versus an equal-weighted basket of EM currencies for the month
The euro weakened against the major currencies for the month except the Japanese yen and UK sterling. The euro has been relatively stable versus the US dollar over the past year, strong relative to the British pound, and sharply weaker vis-à-vis the Japanese yen and Australian dollar
The British pound fell sharply against all the currencies we track as comments by both UK and EU officials stoked fears of a “hard Brexit” outcome to the upcoming Article 50 negotiations. For the trailing 12 months, UK sterling has plunged more than 25% versus most major currencies
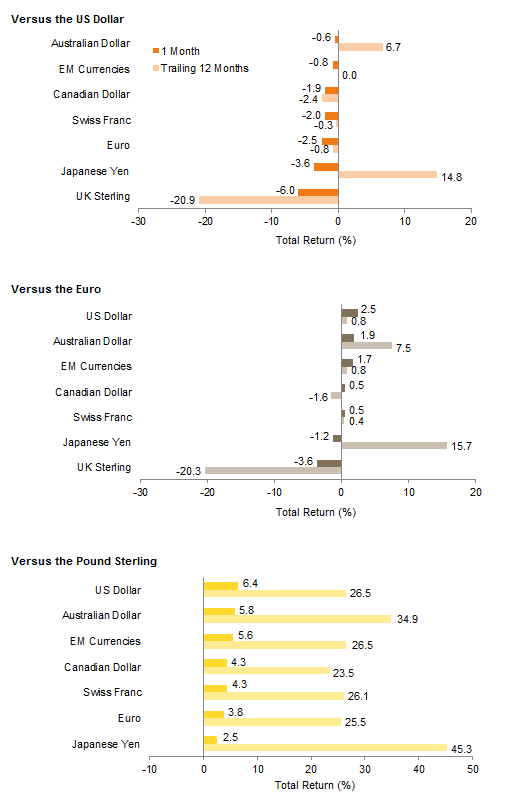
Currency Performance
As of October 31, 2016
Note: EM currencies is an equal-weighted basket of 20 currencies.
Index Performance (USD)
US high-yield bonds and EM equities gained slightly in October, in contrast to declines across the vast majority of asset classes for USD investors. All US bond categories outperformed developed markets equities, which were roughly in line with US equities in USD terms. US small caps and US REITs suffered large declines, cutting into the strong gains they generated earlier this year
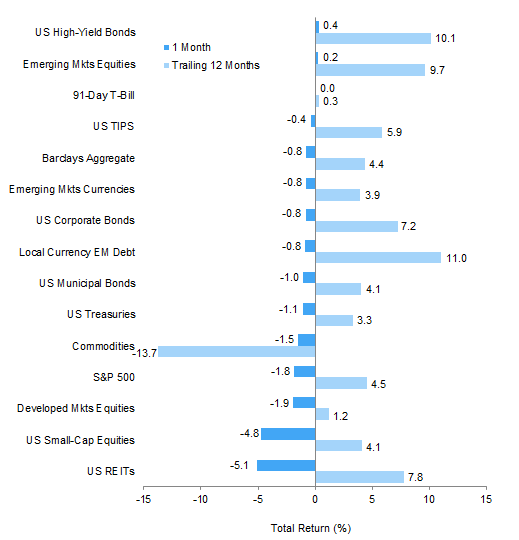
Index Performance (USD)
As of October 31, 2016

MSCI US Composite Normalized P/E
December 31, 1969 – October 31, 2016
Sources: Barclays, Bloomberg L.P., BofA Merill Lynch, FTSE International Limited, Frank Russell Company, J.P. Morgan Securities, Inc., MSCI Inc., National Association of Real Estate Investment Trusts, Standard & Poor’s, and Thomson Reuters Datastream. MSCI data provided “as is” without any express or implied warranties.

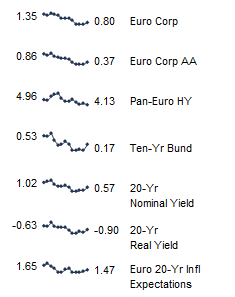
Fixed Income Yields
October 2015 – October 2016
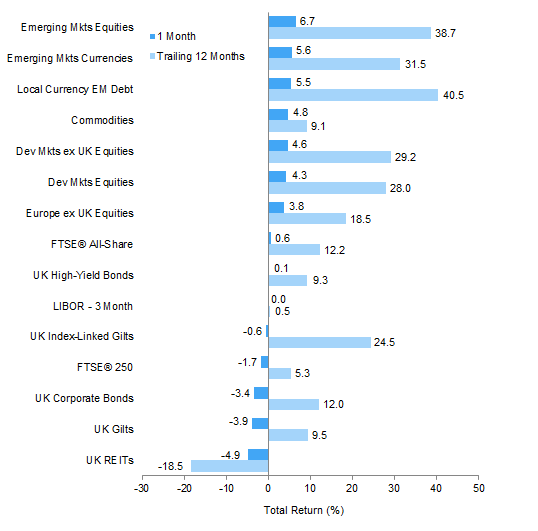
Index Performance (€)
Euro weakness helped EM assets outperform developed markets equivalents for the month, as they have over the trailing 12 months. Commodities, developed markets equities, and pan-euro high-yield bonds also gained, while European equities and Eurozone investment-grade bonds declined, with European small caps and Europe ex UK REITs the worst performers

Index Performance (€)
As of October 31, 2016
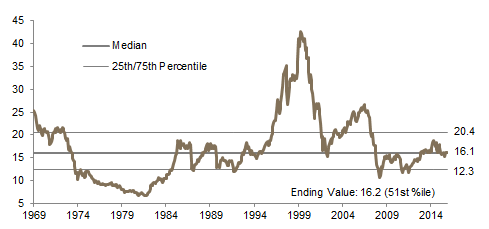
MSCI Europe ex UK Composite Normalized P/E
December 31, 1969 – October 31, 2016
Sources: Barclays, Bloomberg L.P., Citigroup Global Markets, EPRA, FTSE International Limited, J.P. Morgan Securities, Inc., MSCI Inc., National Association of Real Estate Investment Trusts, Standard & Poor’s, and Thomson Reuters Datastream. MSCI data provided “as is” without any express or implied warranties.
Fixed Income Yields
October 2015 – October 2016
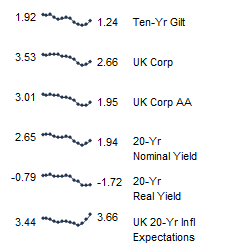
Index Performance (₤)
With the exception of high-yield bonds and large caps, UK assets declined for the month, while weakness in the British pound pushed up the performance of global assets in GBP terms. Despite the uncertainty surrounding “Brexit,” among domestic asset categories only UK REITs have experienced declines over the last year
Index Performance (£)
As of October 31, 2016
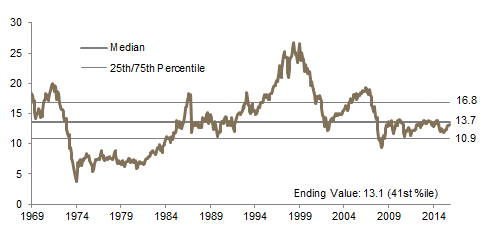
MSCI UK Composite Normalized P/E
December 31, 1969 – October 31, 2016
Sources: Barclays, Bloomberg L.P., BofA Merrill Lynch, EPRA, FTSE International Limited, J.P. Morgan Securities, Inc., MSCI Inc., National Association of Real Estate Investment Trusts, Standard & Poor’s, and Thomson Reuters Datastream. MSCI data provided “as is” without any express or implied warranties.
Fixed Income Yields
October 2015 – October 2016
Exhibit Notes
Performance Exhibits
Total returns for MSCI developed markets indexes are net of dividend taxes. Total returns for MSCI emerging markets indexes are gross of dividend taxes.
US dollar index performance chart includes performance for the Bloomberg Barclays Aggregate Bond, Bloomberg Barclays Corporate Investment Grade, Bloomberg Barclays High-Yield Bond, Bloomberg Barclays Municipal Bond, Bloomberg Barclays US TIPS, Bloomberg Barclays US Treasuries, BofA Merrill Lynch 91-Day Treasury Bills, FTSE® NAREIT All Equity REITs, J.P. Morgan ELMI+, J.P. Morgan GBI-EM Global Diversified, MSCI Emerging Markets, MSCI World, Russell 2000®, S&P 500, and S&P GSCI™ indexes.
Euro index performance chart includes performance for the Bloomberg Barclays Euro-Aggregate: Corporate, Bloomberg Barclays Pan-Euro High Yield, Citigroup EMU Govt Bonds, Citigroup Euro Broad Investment-Grade Bonds, EURIBOR 3M, FTSE® EPRA/NAREIT Europe ex UK, J.P. Morgan ELMI+, J.P. Morgan GBI-EM Global Diversified, MSCI Emerging Markets, MSCI Europe, MSCI Europe ex UK, MSCI Europe Small-Cap, MSCI World ex EMU, MSCI World, and S&P GSCI™ indexes.
UK sterling index performance chart includes performance for the Bloomberg Barclays Sterling Aggregate: Corporate Bond, BofA Merrill Lynch Sterling High Yield, FTSE® 250, FTSE® All-Share, FTSE® British Government All Stocks, FTSE® British Government Index-Linked All Stocks, FTSE® EPRA/NAREIT UK RE, J.P. Morgan ELMI+, J.P. Morgan GBI-EM Global Diversified, LIBOR 3M GBP, MSCI Emerging Markets, MSCI Europe ex UK, MSCI World, MSCI World ex UK, and S&P GSCI™ indexes.
Valuation Exhibits
The composite normalized P/E ratio is calculated by dividing the inflation-adjusted index price by the simple average of three normalized earnings metrics: ten-year average real earnings (i.e., Shiller earnings), trend-line earnings, and return on equity–adjusted earnings. We have removed the bubble years 1998–2000 from our mean and standard deviation calculations. All data are monthly.
Fixed Income Yields
US fixed income yields reflect Bloomberg Barclays Municipal Bond Index, Bloomberg Barclays US Corporate High-Yield Bond Index, Bloomberg Barclays US Corporate Investment-Grade Bond Index, and the ten-year Treasury.
European fixed income yields reflect the BofA Merrill Lynch Euro Corporate AA Bond Index, BofA Merrill Lynch Euro Corporate Bond Index, Barclays Pan-European Aggregate High Yield Bond Index, Bloomberg Twenty-Year European Government Bond Index (nominal), ten-year German bund, 20-year European Inflation Swaps (inflation expectations), and the real yield calculated as the difference between the inflation expectation and nominal yield.
UK sterling fixed income yields reflect the BofA Merrill Lynch Sterling Corporate AA Bond Index, BofA Merrill Lynch Sterling Corporate Bond Index, UK ten-year gilts, and Bank of England 20-year nominal, real, and zero coupon (inflation expectations) yields.