October saw a strong rally in risk assets as accommodative stances from major central banks, more stable commodity prices, and reasonable earnings releases supported investors’ renewed risk appetites. Asset classes that suffered the greatest declines last quarter led performance this month. Natural resources equities, energy master limited partnerships, and Japanese stocks all rebounded roughly 10% in October following double-digit third quarter losses for each. Emerging markets, EMU, and US equities also experienced strong gains, as did global high-yield bonds.
The major central banks’ ongoing voyage into uncharted waters continues to be the focal point for global capital markets. The prospects for global monetary policy divergence have been much discussed, and it appears that process is now poised to unfold. As expected, the Bank of England (BOE) and the US Federal Reserve both announced decisions to maintain their near-zero interest rate policies. At the same time, their latest official statements made an effort to further signal to markets that the first rate hikes are likely to occur sooner rather than later, with the Fed specifically indicating that a December rate hike remains on the table. Meanwhile, policymakers for the European Central Bank (ECB) and Bank of Japan (BOJ) also convened, both suggesting they are prepared to expand their quantitative easing programs in the near term if conditions warrant, perhaps as early as December. For its part, the People’s Bank of China (PBOC), in a surprise move, announced another round of cuts to its benchmark lending and deposit rates as well as to its bank reserve requirement ratios.
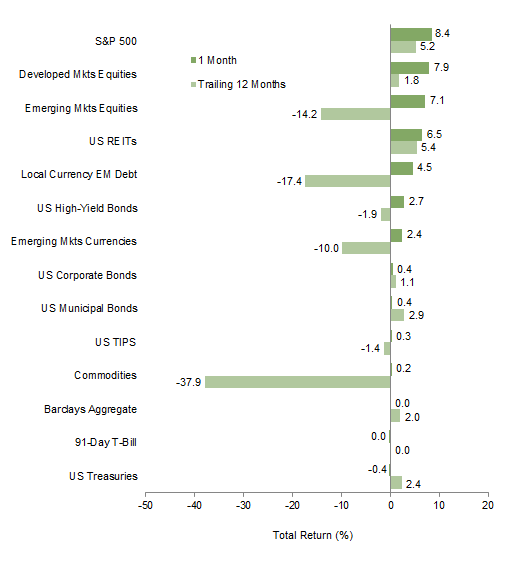
US equities (8.4%) responded to the most recent signs of major central banks’ continued support by recording their best month in four years. As perhaps further confirmation of the liquidity-driven rally, large caps significantly outperformed small caps. Meanwhile, growth stocks outperformed their value counterparts, led by large- and mega-cap growth names, suggesting that investors continue to favor quality growth in this uncertain environment. Strong earnings announcements from several large-cap information technology and health care stocks also reinforced the resiliency of these business models, although the recent negative headlines regarding Valeant Pharmaceuticals demonstrate not all are without risks. Third quarter earnings season is nearing completion, with approximately two-thirds of the S&P 500 now having reported, and the results to date have been slightly better than feared. While year-on-year earnings per share growth is still expected to be mildly negative in aggregate, driven entirely by the energy sector downturn, more than half of S&P 500 sectors are still expected to generate positive earnings growth this quarter.
In Europe, EMU (9.7%) and Europe ex UK (8.2%) equities continue to outpace UK equivalents (5.2%). UK-listed large caps are expected to suffer third quarter year-on-year earnings declines north of 20%, largely driven by further profit losses among natural resources equities. Earnings growth appears to be holding up better on the Continent in aggregate, given the rebound in the financial sector and tailwind from a cheaper currency, though slashed forecasts for Volkswagen and companies selling into emerging markets have led to some minor downgrades elsewhere. Strong earnings are anticipated in the Netherlands, Portugal, and Spain, while estimates for other European countries are weaker by comparison, with flat earnings estimated in Germany and declines expected in France and Switzerland.
Japanese equities (10.9%) outperformed most other major developed markets as export-oriented sectors enjoyed a strong rally in the absence of further depreciation of the Chinese yuan. Japan’s government continues to promote stock market participation by local savers, with the BOJ’s holdings of domestic stock exchange-traded funds (ETFs) now accounting for over half of all local equity ETF assets outstanding. The pending initial public offering of the government’s Japan Post Holdings, the country’s largest privatization since 1987, further reflects the Abe administration’s attempts to revive the economy and reorient the local culture from saving to investing.
Emerging markets equities (5.4%) were led higher by index heavyweight China (9.1%) as emerging Asia (6.1%) outpaced emerging Europe, the Middle East & Africa (4.7%) and Latin America (3.0%). Emerging markets equity performance was even stronger in US dollar and euro terms, as many emerging markets currencies showed gains for the month. A number of new reforms announced by the Chinese government were among the most important developments in the emerging world, as China continues to make its case for international reserve currency status with the International Monetary Fund. In addition to more policy easing from the PBOC, policymakers also took steps to further liberalize the currency and capital account, lifting the official ceiling on the benchmark one-year deposit rate and suggesting plans to begin allowing select domestic Chinese investors to directly buy offshore assets. The government also announced plans for new social reforms, including abolition of the one-child policy and expansion of social security to the entire elderly population.
The US dollar (0.6% based on the US dollar index) strengthened modestly against the euro and yen in anticipation of further quantitative easing from the ECB and BOJ. In contrast, the pound sterling appreciated against the dollar after a more hawkish statement out of the BOE following its most recent policy meeting. Emerging markets and commodity currencies also strengthened as commodity prices stabilized, while a stable Chinese yuan in October allayed, for the time being, investor fears regarding the risks of deepening currency wars in Asia.
Global government bonds (0.1%) gained slightly in aggregate. US Treasuries (-0.4%) and UK gilts (-1.1%) underperformed EMU sovereign bonds (1.1%) as rates sold off across the US and UK yield curves. Meanwhile, corporate credit spreads narrowed as US high-yield bonds (2.7%) enjoyed their best month in nearly four years amid near record mutual fund and ETF inflows, outperforming US investment-grade corporates (0.4%). European (3.1%) and UK (1.6%) high-yield bonds also outperformed investment-grade corporate and sovereign equivalents. US tax-exempt bonds (0.4%) generated gains on the month in what was generally a more benign environment for credit risk.
Inflation-sensitive assets experienced sharp performance dispersion as natural resources equities (10.4%) and energy master limited partnerships (9.7%) rallied sharply, despite little movement in spot prices for the underlying commodities themselves (-0.4% for the Bloomberg Commodity Total Return Index and 0.2% for the energy-heavy S&P GSCI™). Gold (2.4%) led precious metals higher, while industrial metals prices continued to fall. Within the energy complex, crude oil prices (3.4% for WTI and 2.4% for Brent) appreciated modestly, whereas natural gas fell sharply. Rising US Treasury yields failed to stymy the rebound in US REITs (6.5%), and US Treasury Inflation-Protected Securities (0.3%) managed modest gains.
Global growth expectations have been consistently downgraded throughout the year amid China’s economic slowdown and still-lackluster growth across much of the developed world. Global manufacturing activity is barely expanding, while growth in services has been in a general downtrend for several months
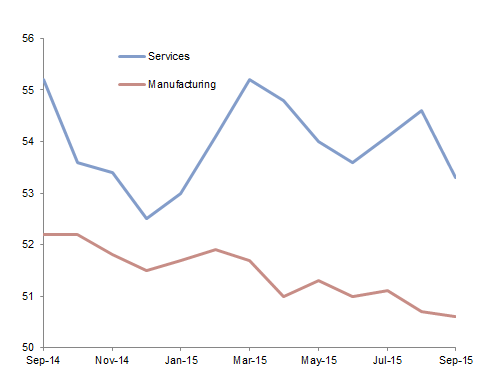
Global Manufacturing and Services PMI
September 30, 2014 – September 30, 2015
Sources: Bloomberg L.P. and J.P. Morgan Securities, Inc.
Note: 50 signifies no change on prior month.
Core consumer price inflation remains well below the 2% target of most major central banks and shows few signs up picking up, despite ongoing quantitative easing programs in the United States, United Kingdom, Eurozone, and Japan
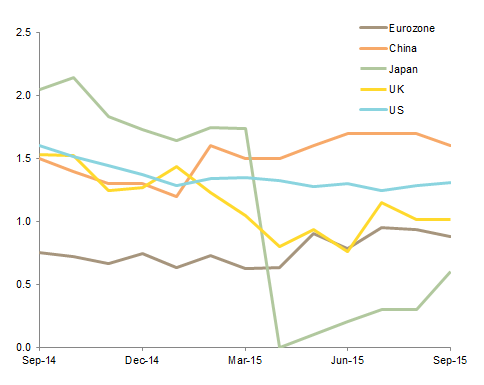
Core Inflation Rates
September 30, 2014 – September 30, 2015 • Year-Over-Year Change (%)
Source: Thomson Reuters Datastream.
Notes: Based on year-over-year changes in monthly CPI levels. US data are the core Personal Consumption Expenditures
China took further steps to loosen its monetary policy in October, cutting its benchmark lending and deposit rates by 25 bps each, while lowering its bank reserve requirement ratios by another 50 bps
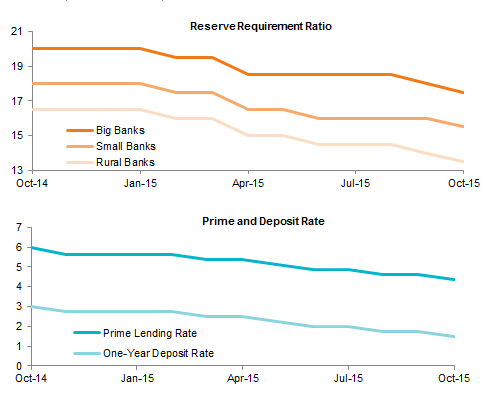
Chinese Monetary Easing
October 31, 2014 – October 31, 2015
Sources: People’s Bank of China and Thomson Reuters Datastream.
Risk assets rallied sharply in October, clawing back some of their third quarter losses, in response to signals of further monetary easing from the major central banks
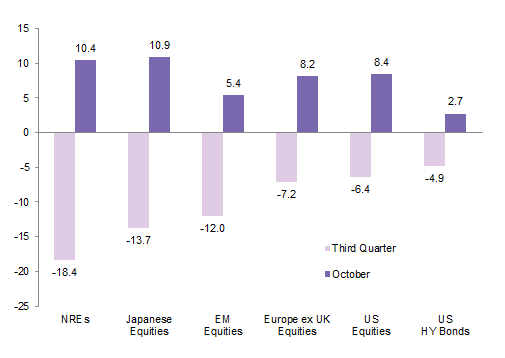
Risk Asset Performance
As of October 31, 2015 • Local Currency • Percent (%)
Sources: Barclays, MSCI Inc., Standard & Poor’s, and Thomson Reuters Datastream. MSCI data provided “as is” without any express or implied warranties.
Notes: All returns are total returns. Total returns for MSCI developed markets indexes are net of dividend taxes. Total returns for MSCI emerging markets indexes are gross of dividend taxes.
US equities outperformed developed markets peers amid a strong rally in global equities and following their third quarter losses. Emerging markets assets also rebounded, with their performance in dollar terms benefitting from stronger local currencies. US high-yield bonds enjoyed their best monthly performance in four years as investor demand for riskier assets recovered, while US investment-grade fixed income returns were flat
Index Performance (US$)
As of October 31, 2015
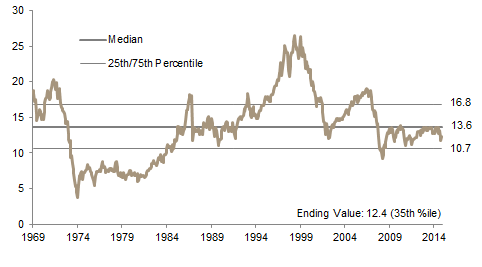
MSCI US Composite Normalized P/E
December 31, 1969 – October 31, 2015
Sources: Barclays, BofA Merill Lynch, FTSE International Limited, J.P. Morgan Securities, Inc., MSCI Inc., National Association of Real Estate Investment Trusts, Standard & Poor’s, and Thomson Reuters Datastream. MSCI data provided “as is” without any express or implied warranties.
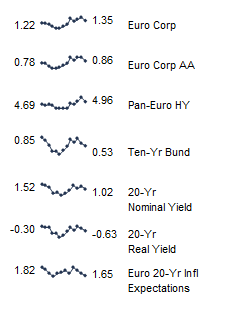
Fixed Income Yields
October 2014 – October 2015
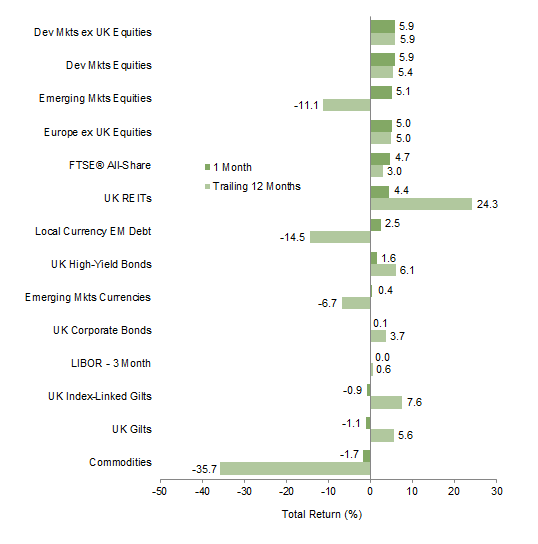
Developed markets equities led the strong rebound in risk assets, with a weaker euro causing EMU equities to slightly underperform international developed markets and emerging markets equivalents. Euro-denominated bonds enjoyed more muted gains, with high-yield bonds outperforming their investment-grade counterparts
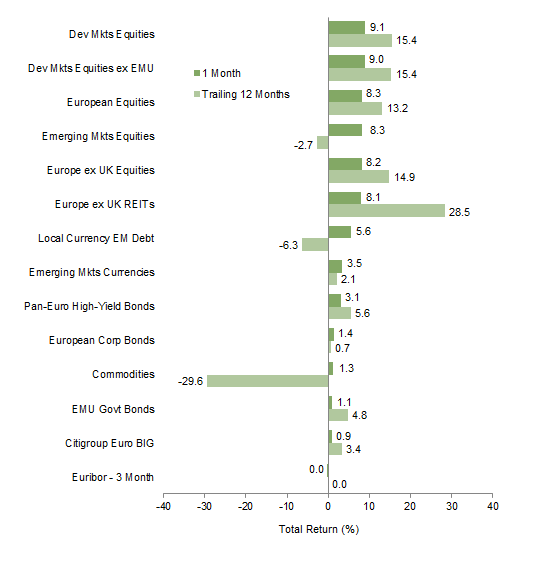
Index Performance (€)
As of October 31, 2015
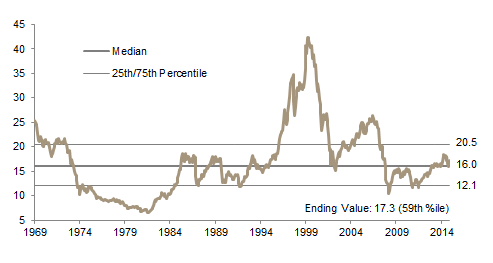
MSCI Europe ex UK Composite Normalized P/E
December 31, 1969 – October 31, 2015
Sources: Barclays, Bloomberg L.P., BofA Merill Lynch, Citigroup Global Markets, EPRA, FTSE International Limited, MSCI Inc., J.P. Morgan Securities, Inc., National Association of Real Estate Investment Trusts, Standard & Poor’s, and Thomson Reuters Datastream. MSCI data provided “as is” without any express or implied warranties.
Fixed Income Yields
October 2014 – October 2015
UK equities underperformed developed and emerging markets stocks despite pound strength, as muted returns from consumer services, financials, and industrials dragged overall domestic market performance lower. Domestic REITs continued their strong performance, keeping pace with the broader UK market, and have now widely outperformed all other asset classes on a trailing 12-month basis
Index Performance (₤)
As of October 31, 2015
MSCI UK Composite Normalized P/E
December 31, 1969 – October 31, 2015
Sources: Bank of England, Barclays, BofA Merrill Lynch, EPRA, FTSE International Limited, J.P. Morgan Securities, Inc., MSCI Inc., National Association of Real Estate Investment Trusts, Standard & Poor’s, and Thomson Reuters Datastream. MSCI data provided “as is” without any express or implied warranties.
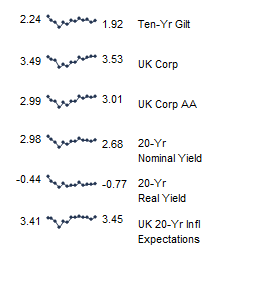
Fixed Income Yields
October 2014 – October 2015
Emerging markets and major commodity exporter currencies rallied in October as commodity prices showed signs of stabilizing. The US dollar strengthened modestly versus the euro and yen in further anticipation of near-term monetary policy divergence, while the pound appreciated against most of its peers following better economic data and a more hawkish tone from some BOE policymakers
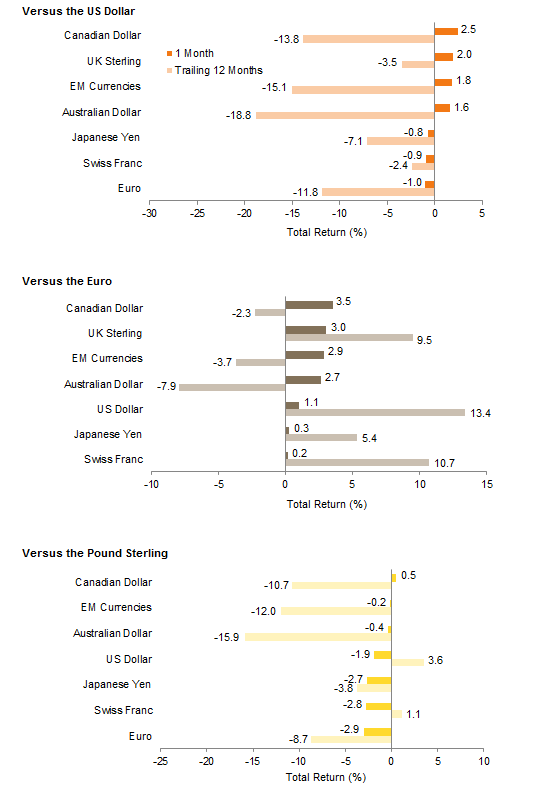
Currency Performance
As of October 31, 2015
Sources: MSCI Inc. and Thomson Reuters Datastream. MSCI data provided “as is” without any express or
implied warranties.
Note: EM currencies is an equal-weighted basket of 20 currencies.
Exhibit Notes
Performance Exhibits
Total returns for MSCI developed markets indexes are net of dividend taxes. Total returns for MSCI emerging markets indexes are gross of dividend taxes.
US dollar index performance chart includes performance for the Barclays Aggregate Bond, Barclays Corporate Investment Grade, Barclays High Yield Bond, Barclays Municipal Bond, Barclays US TIPS, Barclays US Treasuries, BofA Merrill Lynch 91-Day Treasury Bills, FTSE® NAREIT All Equity REITs, J.P. Morgan ELMI+, J.P. Morgan GBI-EM Global Diversified, MSCI Emerging Markets, MSCI World, S&P 500, and S&P GSCI™ indexes.
Euro index performance chart includes performance for the Barclays Euro-Aggregate: Corporate, Barclays Pan-Euro High Yield, Citigroup EMU Govt Bonds, EURIBOR 3M, FTSE® EPRA/NAREIT Europe ex UK RE, J.P. Morgan ELMI+, J.P. Morgan GBI-EM Global Diversified, MSCI Emerging Markets, MSCI Europe, MSCI Europe ex UK, MSCI World, MSCI World ex EMU, and S&P GSCI™ indexes.
UK sterling index performance chart includes performance for the Barclays Sterling Aggregate: Corporate Bond, BofA Merrill Lynch Sterling High Yield, FTSE® All-Share, FTSE® British Government All Stocks, FTSE® British Government Index-Linked All Stocks, FTSE® EPRA/NAREIT UK RE, J.P. Morgan ELMI+, J.P. Morgan GBI-EM Global Diversified, LIBOR 3M GBP, MSCI Emerging Markets, MSCI Europe ex UK, MSCI World, MSCI World ex UK, and S&P GSCI™ indexes.
Valuation Exhibits
The composite normalized P/E ratio is calculated by dividing the inflation-adjusted index price by the simple average of three normalized earnings metrics: ten-year average real earnings (i.e., Shiller earnings), trend-line earnings, and return on equity–adjusted earnings. We have removed the bubble years 1998–2000 from our mean and standard deviation calculations. All data are monthly.
Fixed Income Yields
US fixed income yields reflect Barclays Municipal Bond Index, Barclays US Corporate High Yield Bond Index, Barclays US Corporate Investment-Grade Bond Index, and the ten-year Treasury.
European fixed income yields reflect the BofA Merrill Lynch Euro Corporate AA Bond Index, BofA Merrill Lynch Euro Corporate Bond Index, Barclays Pan-European Aggregate High Yield Bond Index, Bloomberg Twenty-Year European Government Bond Index (nominal), ten-year German bund, 20-year European Inflation Swaps (inflation expectations), and the real yield calculated as the difference between the inflation expectation and nominal yield.
UK sterling fixed income yields reflect the BofA Merrill Lynch Sterling Corporate AA Bond Index, BofA Merrill Lynch Sterling Corporate Bond Index, UK ten-year gilts, and Bank of England 20-year nominal, real, and zero coupon (inflation expectations) yields.