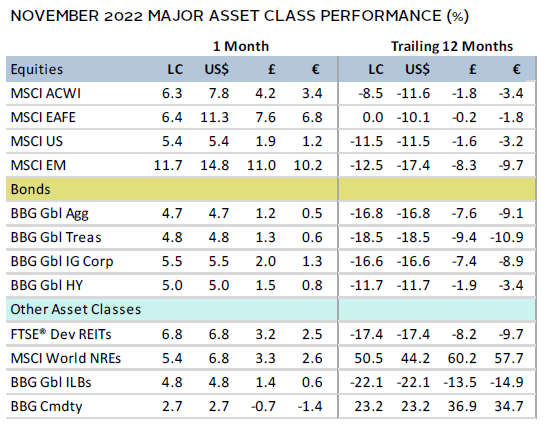
Asset markets broadly advanced in November. The global equity rally continued as surging Chinese shares helped broader emerging markets outpace developed peers. Value bested growth for a fourth straight month, while large caps outgained small caps. Bond markets delivered some of their strongest monthly returns on record as yields fell sharply. Most real assets categories gained—save for oil prices—with gold prices advancing for the first time in eight months. The US dollar weakened the most in 12 years, while the euro and UK sterling were more mixed.
Sources: Bloomberg Index Services Limited, Bloomberg L.P., EPRA, FTSE International Limited, MSCI Inc., National Association of Real Estate Investment Trusts, and Thomson Reuters Datastream. MSCI data provided “as is” without any express or implied warranties.
Note: Local currency returns for the Bloomberg fixed income indexes, the Bloomberg Commodity Index, and the FTSE® Developed REITs are in USD terms.
The Macro Picture
Signs of slowing inflation and indications that the Federal Reserve could soon downshift its trajectory of interest rate hikes boosted both equity and bond markets in November. After the Fed’s fourth straight rate hike of 75 basis points (bps) early in the month, US consumer and producer price reports both showed slower rises than expected, which catalyzed a sharp rally in asset prices.
Still, the Fed’s work to tame inflation appears far from finished. The labor market is still robust and consumer spending has proven resilient. Fed Chairman Jerome Powell noted those factors could require the Fed to lift rates more than previously expected back in September, even if the incremental increases are of a smaller magnitude going forward. Financial conditions also loosened in November due to the gains in asset prices, running counter to the Fed’s ultimate goal of raising borrowing costs to rein in inflation.
Developments in China continued to play a large role in shaping the economic and financial market outlook. Record COVID-19 cases and the continuation of the zero-COVID policy have weighed on the near-term demand outlook. More broadly, preliminary purchasing manager index (PMI) data again pointed to contracting economic activity across much of the globe, while leading indicator measures suggested continued waning economic momentum in the months ahead. These factors contributed to double-digit declines in oil prices. However, Chinese equities and industrial metals rallied during the month, as investors focused on signs that China’s zero-COVID policy could be phased out sooner than expected. Indeed, public backlash against the containment measures reached a fever pitch in November, but a shift away from the longstanding policy will undoubtedly pose a new set of challenges for the country.
Equities
US equities advanced for a second straight month but lagged their developed ex US peers for the eighth time this year. US stocks have now rallied 14% off their mid-October lows but remained roughly 15% below peak levels reached earlier this year. All 11 S&P 500 Index sectors gained, led by the cyclical materials, industrials, and financials sectors. Consumer discretionary, energy, and healthcare gained the least. Value topped growth for a fourth straight month, bringing year-to-date outperformance to 23 percentage points. Large caps led small caps on the month, with year-to-date performance of the two segments roughly on par.
Inflation and Fed policy gripped market attention in November. With these themes, the bulk of the month’s gains occurred on just two days. Both headline and core inflation rates slowed more than expected in October to 7.7% and 6.3% year-over-year (YoY), respectively, sending the US stock market up almost 6% the day of the report. US shares gained more than 3% on the final trading day of the month following comments from Fed Chairman Powell that cemented expectations for a slower pace of rate hikes going forward.
Economic data were mixed in November. Preliminary PMI figures fell deeper into contractionary territory, with new orders falling at the fastest pace since 2009 (outside of the initial COVID-19 pandemic shock). Consumer spending and the labor market have remained resilient, but sentiment slipped in November following several months of recovery. Despite these crosscurrents, third quarter GDP growth was upwardly revised during the month, and the Fed’s running estimate of fourth quarter growth is at nearly 3% annualized.
European equities outgained broader developed markets, delivering their strongest monthly gains for the year. Within the broader European benchmark, UK shares edged Europe ex UK counterparts, outperforming for the ninth time this calendar year.
Eurozone inflation eased more than expected in November to 10.0% YoY, which followed the prior month’s record high of 10.6%. This was the first softening in 17 months, driven by slowing energy and services prices. Core inflation held steady at 5% YoY. Lower energy prices contributed to a 4.2% month-over-month decline in German input prices—the largest decline on record since at least the early 1950s. Still, despite the recent easing, European Central Bank (ECB) policymakers remained wary of the peak inflation narrative and communicated a willingness to tighten into economic weakness. Preliminary PMI measures remained in contractionary territory in November.
The new UK government unveiled more conservative fiscal plans than their short-lived predecessors, including tax increases and spending cuts totaling £55 billion over the next five years. On the monetary side, the Bank of England (BOE) raised policy rates by 75 bps in early November, their largest hike in more than 30 years. UK inflation accelerated to a 41-year high of 11.1% YoY in October, driven by surging food and energy costs. Policymakers indicated a willingness to continue tightening despite expectations for a drawn-out recession next year. Indeed, UK GDP declined 0.2% in third quarter, while preliminary PMI data for November remained firmly in contractionary territory.
Japanese equities gained on the month but lagged broader developed peers. However, Japanese shares outperformed in major currency terms as the yen’s value surged from a more than 30-year low against the US dollar. In fact, the yen’s 7% appreciation versus the greenback was the strongest in more than six years. Japanese authorities have spent around $64 billion intervening in currency markets since September to support the currency. Japanese GDP contracted a milder-than-expected 1.2% annualized in calendar third quarter as imports increased and private spending remained sluggish. Both factors were exacerbated by the yen’s weakness and rising inflation. In October, imports rose more than 50% YoY, while inflation reached a 30-year high at 3.8%. Manufacturing activity turned contractionary for the first time since early 2021, according to preliminary PMI measures for November, while industrial production contracted more than expected in October.
Pacific ex Japan equities topped the developed markets index, advancing by double digits. Hong Kong delivered a standout performance, up nearly 24%. Singapore, Australia, and New Zealand also outperformed broader developed stocks but to a lesser extent. New Zealand equities gained the least as the Reserve Bank of New Zealand raised the cash rate by a record high 75 bps to 4.25%. The central bank expects GDP to contract next year and turned more hawkish over concerns about persistent inflationary pressures from higher wages. The Reserve Bank of Australia lifted its policy rate by just 25 bps, but highlighted concerns over tight labor markets—with the unemployment rate at 50-year lows—and rising wages. Still, they expect growth of around 1.5% next year.
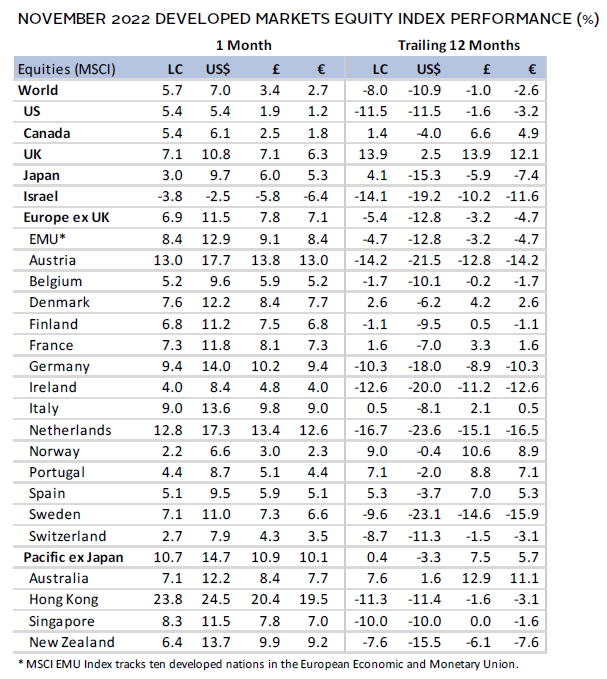
Sources: MSCI Inc. and Thomson Reuters Datastream. MSCI data provided “as is” without any express or implied warranties.
Emerging markets equities rallied in November. Both the monthly gain and the outperformance over developed markets were the largest since 2009, but emerging markets stocks have still underperformed year-to-date. Chinese stocks surged nearly 30% on the month and accounted for roughly two-thirds of the broader index gain. This meant that emerging Asia outperformed among the major regions, whereas emerging Europe, the Middle East & Africa and Latin America lagged. Falling commodity prices weighed on performance in the latter regions. Among major emerging markets countries, China and Taiwan outperformed, South Africa, Korea, and India advanced but lagged the broader index, and Brazil and Saudi Arabia declined.
Chinese equities gained despite record COVID-19 cases and widespread containment measures imposed across the country. Authorities refined aspects of their zero-COVID policy, including shortening quarantine times and narrowing the definition of close contacts subject to testing and isolation. Despite these tweaks, the virus’s surge and associated restrictions contributed to social unrest and public backlash against the policy. Markets viewed these developments positively as they raised the probability that the policy could be phased out soon, leading to a more sustained economic reopening. Authorities also unveiled plans to ease credit conditions for the beleaguered property sector, which represented the most comprehensive support measures to date. These policy adjustments came as economic momentum continued deteriorating. Retail sales and exports unexpectedly declined in October, industrial output softened more than expected, and official PMI measures pointed to continued contractionary activity.

Sources: MSCI Inc. and Thomson Reuters Datastream. MSCI data provided “as is” without any express or implied warranties.
Fixed Income
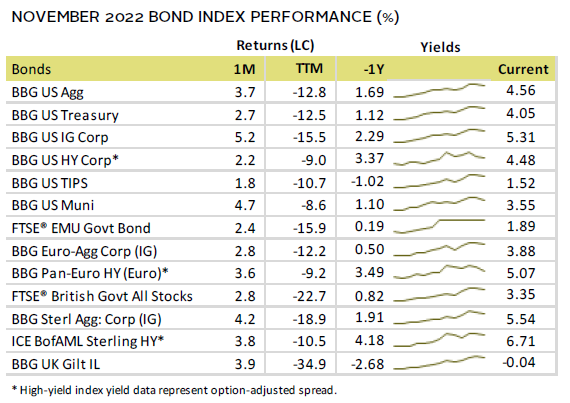
US fixed income assets rallied, with the aggregate index notching its strongest monthly gain since 2008. Investment-grade corporate bonds advanced the most, given their higher duration, but remained a laggard over the trailing 12 months. Treasury yields declined the most at the longer end of the curve, with five- and ten-year yields down 45 bps and 42 bps to 3.82% and 3.68%, respectively. The relative stability at the shorter end meant that the US yield curve reached its most inverted state since the early 1980s. This dynamic likely reflects the combination of the Fed’s expected higher-for-longer approach to short-term interest rates coupled with a weakening economic outlook. TIPS lagged as ten-year real yields declined 24 bps to 1.34%.
Euro- and sterling-denominated fixed income performance largely followed that of their US counterparts, with investment-grade corporates outperforming government bonds. Gilts gained the least among UK fixed income categories, with five- and ten-year yields down 34 bps and 37 bps to 3.22% and 3.25%, respectively. Despite the government’s adjusted fiscal plans, UK debt sales are expected to increase materially in the coming years, a dynamic that could keep upward pressure on yields. Ten-year German bund yields fell 21 bps to 1.95% and the yield curve inverted.


Real Assets
Commodity futures were mixed in November. Both industrial and precious metals prices surged, whereas energy declined. Copper prices rose by double digits—their first gains in seven months—as investors discounted the potential for improved demand from China if it relaxes its zero-COVID policy.
Oil prices ($85.43 for Brent and $80.55 for WTI) declined, touching levels not seen since the end of last year before Russia’s invasion of Ukraine. Lower oil prices reflected several crosscurrents, including signs of slowing economic growth globally, ongoing COVID-related Chinese oil demand concerns, and resilient supply of Russian oil in global markets. Still, other mitigating factors appear likely to keep supply restricted as OPEC+ has moved to cut production and an EU embargo on Russian oil goes into effect in early December.
Momentum for natural resources equities and energy MLPs continued, with both gaining on the month despite weaker underlying commodity prices.
Global REITs advanced for a second straight month as government bond yields declined. Developed Asia and US REITs gained the most, whereas gains for Europe ex UK and UK REITs were more muted. Chinese property stocks rebounded sharply on the month after Chinese authorities eased financing conditions for the sector.
Gold prices rose to $1,751.94/troy ounce, posting their first gain in eight months. Falling yields, slowing inflation, and US dollar depreciation contributed to the strong month for the yellow metal.

Sources: Alerian, Bloomberg L.P., EPRA, FTSE International Limited, Intercontinental Exchange, Inc., MSCI Inc., National Association of Real Estate Investment Trusts, Standard & Poor’s, and Thomson Reuters Datastream. MSCI data provided “as is” without any express or implied warranties.
Note: Gold performance based on spot price return.
USD-Based Investors
Signs of easing inflation and expectations for slower monetary tightening led to gains for most asset classes. Emerging markets equities surged—driven largely by Chinese shares—doubling the return of their developed peers. US equities lagged the broader developed market, while US small caps gained the least among equity categories. Bond markets rallied, led by the relatively more rate-sensitive investment-grade corporates. Among real assets, gold prices rebounded and outperformed, while REITs advanced for a second straight month. Commodities declined in aggregate on falling oil prices despite a sharp rise for industrial metals.
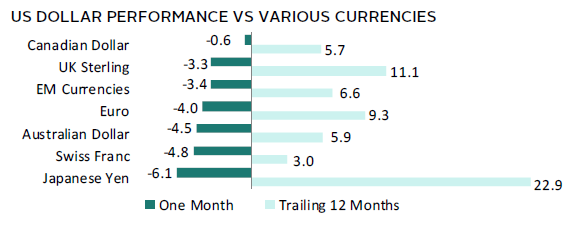
The US dollar weakened the most in 12 years against a basket of developed peers. The greenback depreciated the most vis-à-vis the Japanese yen, Swiss franc, and Australian dollar, but was mostly on par with the Canadian dollar. The dollar’s recent strength was apparent over the trailing 12 months, broadly gaining in value against the currencies we track.
Inflation and Fed policy gripped market attention in November. Both headline and core inflation rates slowed more than expected in October to 7.7% and 6.3% YoY, respectively, sending the US stock market up almost 6% the day of the report. US shares gained more than 3% on the final trading day of the month following comments from Fed Chairman Powell that cemented expectations for a slower pace of rate hikes going forward. Preliminary PMI figures fell deeper into contractionary territory, with new orders falling at the fastest pace since 2009 (outside of the initial pandemic shock). Consumer spending and the labor market have remained resilient, but sentiment slipped in November following several months of recovery.

Sources: Bloomberg Index Services Limited, FTSE International Limited, Frank Russell Company, Intercontinental Exchange, Inc., J.P. Morgan Securities, Inc., MSCI Inc., National Association of Real Estate Investment Trusts, Standard & Poor’s, and Thomson Reuters Datastream. MSCI data provided “as is” without any express or implied warranties.
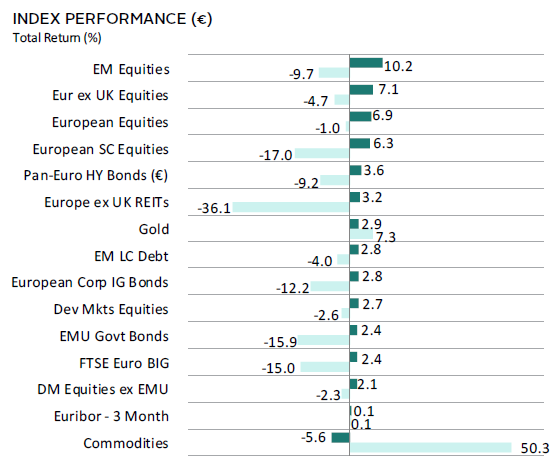
EUR-Based Investors
Signs of easing inflation and expectations for slower monetary tightening led to gains for most asset classes. Emerging markets equities surged—driven largely by Chinese shares—with returns nearly fourfold that of their developed peers. European equities were among the top performers for the month, handily outperforming broader developed stocks. Bond markets also rallied, led by high-yield and investment-grade corporates. Among real assets, REITs advanced for a second straight month, while gold prices rebounded. Commodities declined in aggregate on falling oil prices despite a sharp rise for industrial metals.
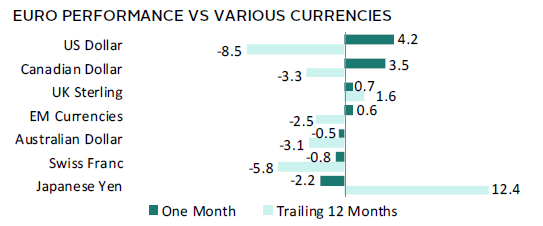
Euro performance was mixed in November. The common currency appreciated the most versus the US and Canadian dollars, but weakened vis-à-vis the Japanese yen, Swiss franc, and Australian dollar. The euro mostly depreciated over the past 12 months but strengthened versus the broadly weaker Japanese yen and UK sterling.
Eurozone inflation eased more than expected in November to 10.0% YoY, which followed the prior month’s record high of 10.6%. This was the first softening in 17 months, driven by slowing energy and services prices. Core inflation held steady at 5% YoY. Lower energy prices contributed to a 4.2% month-over-month decline in German input prices—the largest decline on record since at least the early 1950s. Still, despite the recent easing, ECB policymakers remained wary of the peak inflation narrative and communicated a willingness to tighten into economic weakness. Preliminary PMI measures remained in contractionary territory in November.
Sources: Bloomberg Index Services Limited, EPRA, European Banking Federation, FTSE Fixed Income LLC, FTSE International Limited, Intercontinental Exchange, Inc., J.P. Morgan Securities, Inc., MSCI Inc., National Association of Real Estate Investment Trusts, Standard & Poor’s, and Thomson Reuters Datastream. MSCI data provided “as is” without any express or implied warranties.
GBP-Based Investors
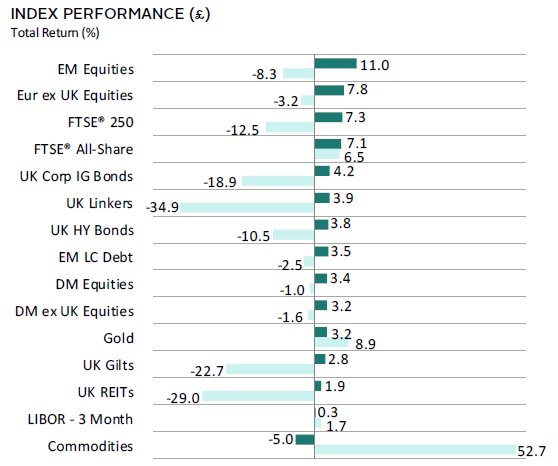
Signs of easing inflation and expectations for slower monetary tightening led to gains for most asset classes. Emerging markets equities surged—driven largely by Chinese shares—more than tripling the return of their developed peers. UK shares outgained the broader developed index, as domestically oriented mid caps outperformed. Bond markets also rallied, led by corporates and linkers. Still, UK fixed income posted the largest drawdowns over the past 12 months. Among real assets, gold prices rebounded, while REITs advanced for a second straight month. Commodities declined in aggregate on falling oil prices despite a sharp rise for industrial metals.
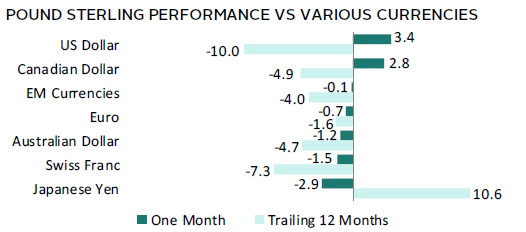
UK sterling mostly weakened in November, depreciating the most versus the Japanese yen, Swiss franc, and Australian dollar. The pound managed to gain against the broadly weaker US and Canadian dollars. Sterling was also notably weaker over the past year, gaining in value only vis-à-vis the Japanese yen.
The new UK government unveiled more conservative fiscal plans than their short-lived predecessors, including tax increases and spending cuts totaling £55 billion over the next five years. On the monetary side, the BOE raised policy rates by 75 bps in early November, their largest hike in more than 30 years. UK inflation accelerated to a 41-year high of 11.1% YoY in October, driven by surging food and energy costs. Policymakers indicated a willingness to continue tightening despite expectations for a drawn-out recession next year. Indeed, UK GDP declined 0.2% in third quarter, while preliminary PMI data for November remained firmly in contractionary territory.
Sources: Bloomberg Index Services Limited, EPRA, FTSE International Limited, Intercontinental Exchange, Inc., J.P. Morgan Securities, Inc., MSCI Inc., National Association of Real Estate Investment Trusts, Standard & Poor’s, and Thomson Reuters Datastream. MSCI data provided “as is” without any express or implied warranties.
Performance Exhibits
All data are total returns unless otherwise noted. Total return data for all MSCI indexes are net of dividend taxes.
USD-Based Investors index performance chart includes performance for the Bloomberg US Aggregate Bond, Bloomberg US Corporate Investment Grade, Bloomberg US High Yield Bond, Bloomberg Municipal Bond, Bloomberg US TIPS, Bloomberg US Treasuries, ICE BofAML 91-Day Treasury Bills, FTSE® NAREIT All Equity REITs, J.P. Morgan GBI-EM Global Diversified, LBMA Gold Price, MSCI Emerging Markets, MSCI World, Russell 2000®, S&P 500, and S&P GSCI™ indexes.
EUR-Based Investors index performance chart includes performance for the Bloomberg Euro-Aggregate: Corporate, Bloomberg Pan-Euro High Yield (Euro), EURIBOR 3M, FTSE EMU Govt Bonds, FTSE Euro Broad Investment-Grade Bonds, FTSE® EPRA/NAREIT Europe ex UK RE, J.P. Morgan GBI-EM Global Diversified, LBMA Gold Price AM, MSCI Emerging Markets, MSCI Europe, MSCI Europe ex UK, MSCI Europe Small-Cap, MSCI World ex EMU, MSCI World, and S&P GSCI™ indexes.
GBP-Based Investors index performance chart includes performance for the Bloomberg Sterling Aggregate: Corporate Bond, Bloomberg Sterling Index-Linked Gilts, ICE BofAML Sterling High Yield, FTSE® 250, FTSE® All-Share, FTSE® British Government All Stocks, FTSE® EPRA/NAREIT UK RE, J.P. Morgan GBI-EM Global Diversified, LBMA Gold Price AM, LIBOR 3M GBP, MSCI Emerging Markets, MSCI Europe ex UK, MSCI World, MSCI World ex UK, and S&P GSCI™ indexes.
EM currencies is an equal-weighted basket of 20 emerging markets currencies.
Fixed Income Performance Table
Performance data for US TIPS reflect the Bloomberg US TIPS Index, with yields represented by the Bloomberg Global Inflation Linked Bond Index: US.