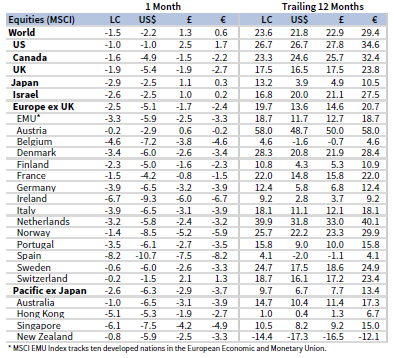
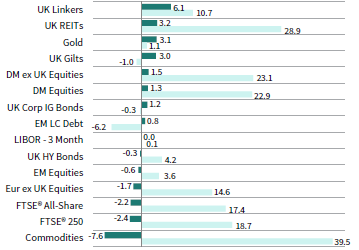
Risk assets sold off in November as pandemic-related developments introduced new uncertainties to the economic outlook. Equity markets broadly declined, with developed markets outperforming emerging counterparts. Growth and large-cap stocks held up relatively well, besting value and small-cap peers. Sovereign bonds topped corporate counterparts and yields declined, reflecting the risk-off shift. Real asset categories posted the steepest losses, highlighted by a sharp decline in oil prices. The US dollar appreciated as investors bid up typical safe-haven currencies, the euro was mixed, and UK sterling generally weakened.
Sources: Bloomberg Index Services Limited, Bloomberg L.P., EPRA, FTSE International Limited, MSCI Inc., National Association of Real Estate Investment Trusts, and Thomson Reuters Datastream. MSCI data provided “as is” without any express or implied warranties.
Note: Local currency returns for the Bloomberg fixed income indexes, the Bloomberg Commodity Index, and the FTSE® Developed REITs are in USD terms.
The Macro Picture
Concerns about a new COVID-19 variant sapped investor risk appetite near the end of the month. The variant, dubbed “Omicron,” was discovered in southern Africa and classified as a Variant of Concern by the World Health Organization. While much is still unknown about the new strain and its impact on the efficacy of current vaccines, the news triggered risk-off sentiment. Crude oil prices plunged amid newfound concerns about future demand as many countries imposed new international travel restrictions. Global equities stumbled; Eurozone equities lagged developed markets as surging COVID-19 infections prompted authorities to reimpose containment measures and lockdowns. Safe-haven assets—US Treasuries, inflation-linked bonds, and the US dollar—rallied amid the flight to safety.
The emergence of the new strain has created fresh challenges for policymakers. In recent months, surging inflationary pressures and tightening labor markets have boosted the case for more hawkish monetary policy. The Federal Reserve began tapering pandemic-era asset purchases at a rate of $15 billion per month in November and discussed increasing this pace as soon as December’s policy meeting. Moreover, investors had also expected policymakers to begin hiking interest rates by mid-June 2022. But the new COVID-19 variant has caused markets to push back their rate hike expectations by several months, anticipating that policymakers will take a more cautious approach. Still, newly renominated Fed Chairman Jerome Powell has recently given more hawkish signals, reversing course on the view that the current inflationary bout is transitory.
Equities
US equities declined but proved more resilient than their developed ex US and emerging markets peers. US stocks had notched fresh all-time highs in November before the discovery of the new variant led to a sharp price drawdown, similar to the equity reaction earlier this year when the Delta variant was first detected to have spread well beyond India. Nine of 11 S&P 500 sectors posted losses, with some of this year’s top gainers declining the most. Financials, communication services, and energy each fell more than 5%, whereas information technology and consumer discretionary gained. Growth and large-cap stocks bested their value and small-cap counterparts, respectively. S&P 500 Index companies grew EPS 40% year-over-year in third quarter, exceeding earlier expectations and delivering near record-high profit margins.
Economic data released in November appeared to bolster the case for tighter monetary policy. US inflation exceeded expectations, rising at the highest year-over-year rate since the early 1990s, with the headline index hitting 6.2%. Further, the United States added more jobs than expected in October, initial unemployment claims fell to a 52-year low, and the unemployment rate dropped to 4.6%. Consumer spending and retail sales growth accelerated and surprised to the upside despite an unexpected decline in sentiment and confidence indicators, which were dented by the recent inflationary spike. Following months of negotiations, US President Biden signed the $1 trillion bipartisan infrastructure bill into law. In addition, the US House of Representatives passed a broader social spending bill totaling nearly $2 trillion, but the bill is expected to see significant changes in the Senate.
European equities fell, lagging the broader developed index. However, European stocks edged the developed ex US equity universe. UK equities bested their Europe ex UK counterparts, but broad sterling weakness meant they lagged continental peers in major currency terms.
Euro area inflation continued accelerating and exceeded expectations in November, reaching 4.9% year-over-year, which marks the highest rate since the euro’s inception. German consumer prices rose 5.2%, the fastest rate since 1992, and harmonized prices rose 6.0%. Still, European Central Bank officials reiterated their view that inflation is transitory even as input prices also accelerated. Surging COVID-19 cases and inflation prints have hurt recent sentiment indicators. Eurozone consumer and economic confidence declined in November, hitting seven- and six-month lows, respectively. Olaf Scholz is set to become Germany’s next Chancellor upon securing a coalition deal to form the so-called “traffic light” government, which will emphasize policy surrounding climate change.
The Bank of England (BOE) surprised markets by standing pat on raising policy interest rates in November. Rate setters took a patient approach to see how the labor market fared following the expiration of the pandemic furlough scheme. Later data appeared to put the BOE back under pressure to hike rates, as inflation of 4.2% year-over-year reached its highest in a decade and employment gains exceeded expectations. However, fears related the Omicron variant clouded the outlook for future interest rate decisions. In third quarter, UK GDP expanded 1.3% quarter-over-quarter, missing consensus expectations and slowing from the prior quarter’s 5.5% rate. Output remains 2.1% below pre-pandemic levels, the largest gap among G7 countries.
Japanese equities trailed all other major developed markets regions in November and have now lagged the broader developed markets index by more than 10 percentage points year-to-date. Japanese shares underperformed due in part to Japanese yen appreciation amid safe-haven capital flows. New Prime Minister Fumio Kishida announced a sizable $383 billion stimulus package to support the ailing economic recovery. Indeed, the Japanese economy contracted by a larger-than-expected 3.0% annualized in calendar third quarter, buffeted by weak consumer spending, business investment, and exports amid supply chain disruptions and a COVID-19 resurgence. Japanese core consumer prices declined 0.7% in October.
Pacific ex Japan equities lagged their broader developed peers as all countries posted losses. Singapore and Hong Kong trailed the broader Pacific ex Japan index, while New Zealand and Australia outperformed. Australian GDP contracted in third quarter at a milder-than-expected 1.9% quarter-over-quarter rate, supported by strong government stimulus. Monthly retail sales growth accelerated 4.9% in October, reflecting the easing of virus containment measures. The Reserve Bank of Australia (RBA) dropped its yield-control policy, but pushed back on market expectations for an accelerated rate hiking timeline, as core inflation has risen to the lower end of the RBA’s target range and wage growth (2.2% in third quarter) remained below target. The Reserve Bank of New Zealand raised rates by 0.25% for a second consecutive month, bringing the policy rate to 0.75% as inflation and employment run above target levels. New Zealand inflation hit 4.9% year-over-year in third quarter, while the unemployment rate fell to an all-time low of 3.4%.
Sources: MSCI Inc. and Thomson Reuters Datastream. MSCI data provided “as is” without any express or implied warranties.
Emerging markets equities trailed their developed counterparts in November and fell into the red for the year-to-date period; they now lag by 21 percentage points this year. The recent bout of underperformance has occurred despite ultra-loose US financial conditions, which have typically been positive for emerging markets stocks. Among major regions, heavily weighted emerging Asia matched the broader index, emerging Europe, the Middle East & Africa underperformed, and Latin America outperformed. Saudi Arabia, Russia, and index heavyweight China were the primary detractors among major emerging countries, Korea, India, and Brazil declined but bested the broader index, and Taiwan and South Africa advanced.
Currency depreciation has weighed on performance in major currency terms despite several central banks hiking rates this year; Mexico and South Africa continued this trend in November. The Turkish central bank is a stark policy response outlier, cutting rates despite high inflation on political pressure stemming from President Erdogan’s unorthodox economic views. The lira has depreciated 44% this year versus the dollar. Overall market impact remains limited, however, given the country’s relatively low weighting in major benchmarks.
Chinese stocks lagged as the new variant’s emergence clouded the economic outlook given the country’s “zero-COVID” policy. The People’s Bank of China’s third quarter monetary policy report indicated a dovish shift, emphasizing stable credit growth and support for the real economy. The report also highlighted stabilizing real estate prices and calibrating policy for steady development. Housing prices fell for a second straight month, but there were no additional real estate sector defaults in November.
Sources: MSCI Inc. and Thomson Reuters Datastream. MSCI data provided “as is” without any express or implied warranties.
Fixed Income
Investment-grade US fixed income assets benefitted from the late-November risk-off environment as Treasury yields gyrated and the yield curve flattened. In contrast, US high-yield corporate bonds declined and lagged all major fixed income categories. Five- and ten-year Treasury yields fell 4 bps and 12 bps to 1.14% and 1.43%, respectively. However, ten-year yields touched as high as 1.67% intra-month. Shorter-term maturities rose modestly, while the ten-year/two-year yield spread narrowed 16 bps to 0.91%. US TIPS and tax-exempt municipal bonds outperformed. Breakeven inflation rates finished moderately lower; however, five- and ten-year measures reached series highs during the month at 3.17% and 2.76%, respectively, following the strong US inflation print.
Performance among sterling- and euro-denominated bonds mirrored that of their US counterparts. Five-and ten-year UK Gilt yields declined 21 bps each to 0.58% and 0.82%, respectively. Unlike the US, the UK sovereign yield curve shifted downward in parallel manner. Inflation-linked gilts delivered top performance once again as inflation expectations remained elevated. Ten-year German bund yields fell 19 bps to -0.34%. Yields generally fell to a similar extent across maturities, though the yield curve ultimately flattened.
Real Assets
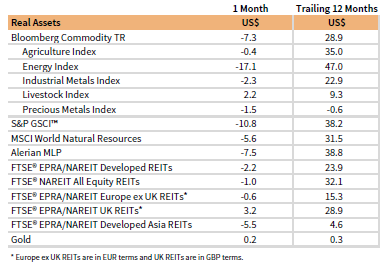
Commodity futures sank, posting their largest losses since the onset of the pandemic. Energy was the largest detractor, while industrial and precious metals also declined. Still, European natural gas prices continued climbing after Germany suspended certification of Russia’s Nord Stream 2 pipeline and Belarus threatened to cut off gas transit to the European Union over a mounting refugee crisis.
Oil prices ($70.57 for Brent and $66.18 for WTI) posted double-digit declines as markets digested the implications of a slowdown in international travel stemming from the emergence of the Omicron variant. Additionally, the United States announced plans to release 50 million barrels of oil from strategic reserves in an unprecedented coordination with other non-OPEC+ countries including China, Japan, India, South Korea, and the United Kingdom. However, OPEC+ members are expected to scrap an anticipated production boost in early December, yielding limited market impact.
Global natural resources equities and energy MLPs declined alongside oil prices, trailing broader equity benchmarks.
Global developed REITs declined, led lower by developed Asia REITs, US REITs, and Europe ex UK REITs. UK REITs were the only major region that gained.
Gold prices were relatively unchanged, ending the month at $1,780.05/troy ounce. The yellow metal had risen nearly 5% intra-month on climbing inflation expectations before concerns about interest rate hikes and a stronger US dollar upended price momentum.
Sources: Alerian, Bloomberg L.P., EPRA, FTSE International Limited, Intercontinental Exchange, Inc., MSCI Inc., National Association of Real Estate Investment Trusts, Standard & Poor’s, and Thomson Reuters Datastream. MSCI data provided “as is” without any express or implied warranties.
Note: Gold performance based on spot price return.
USD-Based Investors
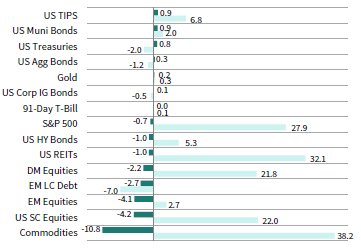
Risk assets declined in November as a new COVID-19 variant emerged, adding new uncertainty to the economic outlook. All major equity markets declined, with US stocks proving the most resilient. Small caps and emerging markets shares—two of the riskier equity segments—sold off the most. Commodities trailed all other asset classes, buffeted by a sharp oil price decline, but remained the top performer over the past year. Investment-grade bonds and gold posted modest gains amid the risk-off environment.
The US dollar generally appreciated, receiving its typical safe-haven bid and gaining the most versus the Australian dollar, EM currencies, and UK sterling. The greenback only weakened versus the Japanese yen, another safe-haven currency. The dollar has strengthened over the past year, declining in value only relative to the Canadian dollar.
S&P 500 Index companies grew EPS 40% year-over-year in third quarter, exceeding earlier forecasts and delivering near record-high profit margins. US inflation data trounced expectations, rising at the highest year-over-year rate since the early 1990s, with the headline index hitting 6.2%. Additionally, the United States added more jobs than expected in October, initial unemployment claims fell to a 52-year low, and the unemployment rate dropped to 4.6%. Consumer spending and retail sales growth accelerated and surprised to the upside despite an unexpected decline in sentiment and confidence indicators, which were dented by the recent inflationary spike.
Sources: Bloomberg Index Services Limited, Frank Russell Company, FTSE International Limited, Intercontinental Exchange, Inc., J.P. Morgan Securities, Inc., MSCI Inc., National Association of Real Estate Investment Trusts, Standard & Poor’s, and Thomson Reuters Datastream. MSCI data provided “as is” without any express or implied warranties.
EUR-Based Investors
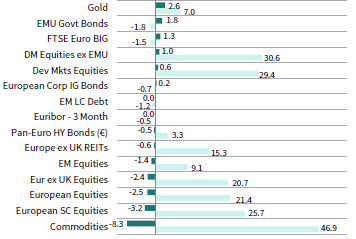
Investment-grade bonds and gold advanced the most in November, benefitting from a risk-off environment as a new COVID-19 variant emerged, introducing heightened uncertainty to the economic outlook. European equities trailed both developed and emerging peers due in part to rising cases in the region, which led to the reimposition of lockdowns and other containment measures. European small caps lagged other major equity categories. Commodities declined the most, buffeted by a sharp oil price decline, but remained the top performer over the past year, whereas high-yield corporate bonds retreated.
Euro performance was mixed for the month, depreciating versus safe havens such as the Japanese yen, US dollar, and Swiss franc, but advancing vis-à-vis the Australian dollar, emerging markets currencies, UK sterling, and the Canadian dollar. The common currency mostly weakened over the past year, gaining only relative to the Japanese yen and emerging markets currencies.
Stoxx 600 Index companies’ reported EPS growth in third quarter topped other major developed regions, exceeding analyst estimates by 11 percentage points. Euro area inflation continued accelerating and exceeding expectations in November, reaching 4.9% year-over-year, which marks the highest rate since the euro’s inception. German consumer prices rose 5.2%, the fastest rate since 1992, and harmonized prices rose 6.0%. Eurozone consumer and economic confidence declined in November, hitting seven-month and six-month lows, respectively.
Sources: Bloomberg Index Services Limited, EPRA, European Banking Federation, FTSE Fixed Income LLC, FTSE International Limited, Intercontinental Exchange, Inc., J.P. Morgan Securities, Inc., MSCI Inc., National Association of Real Estate Investment Trusts, Standard & Poor’s, and Thomson Reuters Datastream. MSCI data provided “as is” without any express or implied warranties.
GBP-Based Investors
Relative asset performance largely reflected a risk-off environment as a new COVID-19 variant emerged, introducing heightened uncertainty to the economic outlook. Domestic UK shares lagged all other major equity categories, with UK mid caps trailing the most. Emerging markets stocks lagged their developed counterparts and have gained the least among equities over the past year. Commodities trailed all other asset classes, buffeted by a sharp oil price decline, but remained the top performer over the past year. Investment-grade bonds and gold were among the top-performing assets, whereas high-yield corporate bonds declined.
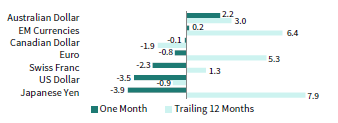
UK sterling mostly declined in November, falling the most vis-à-vis the safe-haven Japanese yen, US dollar, and Swiss franc, but gaining relative to the Australian dollar and emerging markets currencies. The opposite is generally true over the past year as the pound gained versus all except for the US and Canadian dollars.
The BOE surprised markets by standing pat on raising policy interest rates in November. Rate setters opted for a patient approach to see how the labor market fared following the expiration of the pandemic furlough scheme. Later data appeared to put the BOE back under pressure to hike rates, as inflation of 4.2% year-over-year reached its highest in a decade and employment gains exceeded expectations. However, fears related the new COVID-19 variant clouded the outlook for future interest rate decisions. In third quarter, UK GDP expanded 1.3% quarter-over-quarter, missing consensus expectations and slowing from the prior quarter’s 5.5% rate. Output remains 2.1% below pre-pandemic levels, the largest gap among G7 countries.
Sources: Bloomberg Index Services Limited, EPRA, FTSE International Limited, Intercontinental Exchange, Inc., ICE Benchmark Administration Ltd., J.P. Morgan Securities, Inc., MSCI Inc., National Association of Real Estate Investment Trusts, Standard & Poor’s, and Thomson Reuters Datastream. MSCI data provided “as is” without any express or implied warranties.
Performance Exhibits
All data are total returns unless otherwise noted. Total return data for all MSCI indexes are net of dividend taxes.
USD-Based Investors index performance chart includes performance for the Bloomberg US Aggregate Bond, Bloomberg US Corporate Investment Grade, Bloomberg US High Yield Bond, Bloomberg Municipal Bond, Bloomberg US TIPS, Bloomberg US Treasuries, ICE BofAML 91-Day Treasury Bills, FTSE® NAREIT All Equity REITs, J.P. Morgan GBI-EM Global Diversified, LBMA Gold Price, MSCI Emerging Markets, MSCI World, Russell 2000®, S&P 500, and S&P GSCI™ indexes.
EUR-Based Investors index performance chart includes performance for the Bloomberg Euro-Aggregate: Corporate, Bloomberg Pan-Euro High Yield (Euro), EURIBOR 3M, FTSE EMU Govt Bonds, FTSE Euro Broad Investment-Grade Bonds, FTSE® EPRA/NAREIT Europe ex UK RE, J.P. Morgan GBI-EM Global Diversified, LBMA Gold Price AM, MSCI Emerging Markets, MSCI Europe, MSCI Europe ex UK, MSCI Europe Small-Cap, MSCI World ex EMU, MSCI World, and S&P GSCI™ indexes.
GBP-Based Investors index performance chart includes performance for the Bloomberg Sterling Aggregate: Corporate Bond, Bloomberg Sterling Index-Linked Gilts, ICE BofAML Sterling High Yield, FTSE® 250, FTSE® All-Share, FTSE® British Government All Stocks, FTSE® EPRA/NAREIT UK RE, J.P. Morgan GBI-EM Global Diversified, LBMA Gold Price AM, LIBOR 3M GBP, MSCI Emerging Markets, MSCI Europe ex UK, MSCI World, MSCI World ex UK, and S&P GSCI™ indexes.
EM currencies is an equal-weighted basket of 20 emerging markets currencies.
Fixed Income Performance Table
Performance data for US TIPS reflect the Bloomberg US TIPS Index, with yields represented by the Bloomberg Global Inflation Linked Bond Index: US.

