Equity markets continued climbing in November, as tentative signs of economic resilience and optimism over a potential US-China trade deal boosted risk assets. Global equity performance was generally strong, led by US equities, as developed markets stocks outperformed emerging equivalents for the tenth time this calendar year. Global growth stocks outperformed value, while small caps topped large caps. High-yield and investment-grade corporate bonds outperformed sovereigns as yields rose and credit spreads tightened. Real assets performance was generally weak and mixed across categories. Among currencies, the US dollar and UK sterling broadly appreciated, whereas euro performance was mixed.
Has the recent global economic growth slowdown finally bottomed? Equity markets seem to think so, as nascent signs of growth stabilization helped provide a tailwind to risk assets in November. Moreover, risk-on sentiment was also boosted by hopes that the United States and China would finalize a “Phase One” trade deal, as well as easier financial conditions stemming from recent central bank easing. US stocks reached new all-time highs during the month, while non-US markets in aggregate ticked higher, but have not surpassed their January 2018 peaks. The CBOE Volatility (VIX) Index, which measures implied US equity market volatility, fell to its lowest level since August 2018 and investors took record positions in the “short volatility” trade. However, the muted volatility expectations could be indicative of excessive optimism in the markets. The majority of 2019’s equity market gains have been driven by multiple expansion, as earnings growth has flatlined or turned negative. In calendar third quarter, earnings per share contracted on a year-over-year basis across the United States, Europe, and Japan, and recent full year 2019 EPS growth expectations on a global basis continued to fall to a meager 0.1%. Further, the recent US passage of two bills pertaining to the unrest in Hong Kong may introduce additional complications to current trade negotiations. Despite some indications that the recent deterioration in economic data may be abating, manufacturing and services activity indicators still imply soft economic growth moving forward. Indeed, major economies such as the United Kingdom and Germany avoided technical recessions in third quarter, but various manufacturing and business activity indicators still imply a weak growth outlook. In addition, global trade volumes contracted on a year-over-year basis for the fourth consecutive month. In China—the world’s second-largest economy—there were few signs of improvement, which prompted the People’s Bank of China to cut rates for the first time since 2016 and take measures to inject liquidity into the banking system. Also, consistent with the recent theme of weaker economic outlooks, the Organisation for Economic Co-operation and Development lowered its economic growth expectations to decade lows.
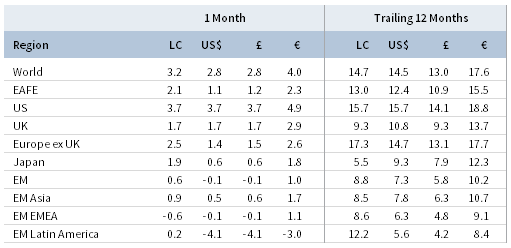
TOTAL RETURN FOR MSCI INDEXES (%)
US equities (3.6% for the S&P 500 Index) outperformed global ex us counterparts in November and touched all-time highs during the month, bringing year-to-date performance to 27.6%. Nine of 11 S&P 500 sectors advanced, led by information technology, financials, and healthcare, whereas the defensive and yield-sensitive utilities and real estate sectors declined. Growth stocks outperformed value counterparts for the tenth time in the past 12 months, while small caps bested large caps for the third consecutive month. With reporting season nearly complete, S&P 500 third quarter EPS growth registered a 2% contraction, which marks three straight quarters of year-over-year earnings declines. Expectations were well managed ahead of the reporting season as 75% of companies beat analyst estimates, surprising in aggregate by 4%. Looking ahead, analysts now project fourth quarter earnings to decline 1%, bringing full year 2019 earnings growth expectations down to just 1%. US economic growth was revised up to 2.1% annualized in third quarter, driven largely by strong consumer spending. Consumer sentiment generally remained near all-time highs last month as the labor market continued to add more jobs than expected. While household spending and retail sales grew month-over-month in October, year-over-year trends fell to the lowest levels in several months. The manufacturing outlook was more mixed; activity gauges firmed, but missed expectations and remained weak overall, durable goods orders exceeded expectations, and industrial production fell to the lowest year-over-year growth rate since late 2016.
European equities (1.5% in USD, 2.7% in EUR, 1.5% in GBP) advanced, but underperformed broader developed markets stocks. UK equities outperformed Europe ex UK counterparts in major currency terms as sterling generally appreciated, which weighed on UK shares in local currency terms. European earnings declined in third quarter for the second consecutive period, although a greater-than-average proportion of companies beat earnings and sales estimates, highlighting the reduced expectations leading into the reporting season. With few definitive developments in the ongoing Brexit saga, market attention turned to polling for the upcoming UK general election on December 12, which currently puts the Conservative Party in the lead. The Bank of England held policy interest rates steady at its November meeting, but two committee members unexpectedly voted for rate cuts as UK inflation in October slowed to a nearly three-year low. Some positive signs emerged that Germany’s recent manufacturing slump may be bottoming out; activity indicators improved (but remain squarely in contractionary territory), exports expanded on a year-over-year basis, and manufacturing orders increased from the month prior. However, healthier German economic data of late appear to reduce the likelihood of a larger fiscal stimulus package. In addition, the economic outlook remains murky; both the European Commission and Germany’s Council of Economic Experts downgraded their growth forecasts for 2019 and 2020.
Japanese equities (0.6% in USD, 1.8% in EUR, 0.6% in GBP) gained, but have underperformed broader developed stocks in ten of the past 12 months. Based on reports from nearly 60% of companies, in calendar third quarter Japanese earnings contracted 1%, which marks the fourth consecutive quarter of year-over-year earnings declines. The Japanese economy expanded at a 0.2% annualized rate in calendar third quarter, underwhelming expectations and dragged by the volatile inventories category; household consumption, business investment, and government spending all contributed to growth. In a bid to support the economy, Prime Minister Shinzo Abe’s government announced in November the first economic stimulus package since 2016, while both monetary and fiscal policymakers considered issuing a 50-year government bond to lock in low borrowing costs. Manufacturing activity remained in contractionary territory for the seventh consecutive month, while services activity indicated only moderate growth. Japan’s October industrial output declined more than expected and marked the largest drop since late 2017.
Emerging markets equities (-0.1% in USD, 1.0% in EUR, -0.1% in GBP) underperformed developed markets counterparts, bringing year-to-date underperformance to nearly 13 percentage points in local currency terms. In major currency terms, heavily weighted emerging Asia outperformed, emerging Europe, the Middle East & Africa performed in line with the broader index, and Latin America trailed. Latin American shares fared better in local currency terms as most currencies depreciated vis-á-vis major developed counterparts. Among major emerging markets countries, Taiwan, China, and Brazil outperformed, India matched the broader index, and Korea and South Africa lagged. Data indicated the Chinese economic struggles continued as exports fell for a third consecutive month, fixed asset investment growth sunk to its lowest level on record, and industrial profits declined nearly 10% year-over-year in October. In addition, despite record “Singles Day” sales volume from Alibaba, overall Chinese retail sales growth slumped to a 16-year low. Moody’s and S&P downgraded South Africa’s economic outlook to “negative” from “stable,” citing slow growth and a deteriorating fiscal and debt situation. South African equities trail broader emerging markets year-to-date. Frontier markets equities (1.4% in USD, 2.6% in EUR, 1.4% in GBP) generally advanced in November.
Commodity futures (-2.6% for the Bloomberg Commodity TR Index and 0.0% for the energy-heavy S&P GSCI™ Index) were generally weaker, as precious and industrial metals faltered. Oil prices ($62.43 for Brent and $55.17 for WTI) rose in November on expectations for further Organization of the Petroleum Exporting Countries production cuts, even as the organization cut its forward oil demand outlook and US production continued to rise to fresh records. Global natural resources equities (1.5% for the MSCI World Natural Resources Index in USD terms) advanced in November, while energy MLPs (-5.8%) declined and are now in the red year-to-date. MLPs are currently mired in an historic sell-off despite a stronger fundamental backdrop at the partnership level; the Alerian MLP Index has declined for ten consecutive weeks and 17 of the last 20. Global developed REITs (-1.2% in USD terms) declined, but performance varied by region. US REITs (-1.5%) and Asia REITS (-2.1% in USD terms) sold off, whereas UK REITs (2.4%) and Europe ex UK REITs (2.2%) advanced. Gold prices (-3.2%) declined to $1,461.54 per troy ounce as yields moved higher and the US dollar strengthened.
Rising bond yields weighed on sovereign fixed income performance, whereas corporate credits fared better. US high-yield (0.3%) and corporate investment-grade bonds (0.3%) outperformed US Treasuries (-0.3%) amid higher yields and tighter credit spreads. Five- and ten-year Treasury yields rose 11 and 9 basis points (bps) to 1.62% and 1.78%, respectively, but pared back from higher levels intra-month. Short-term rates rose to a lesser degree, expanding the 10-year/3-month yield spread to its widest month-end level since February. As in the United States, UK gilts (-0.8%) underperformed UK high-yield (1.2%) and corporate investment-grade (-0.1%) counterparts. Five- and ten-year gilt yields climbed 6 bps apiece to 0.46% and 0.66%, respectively. EMU government bonds (-0.9%) also declined as German ten-year bund yields rose to -0.35%. US tax-exempt municipal bonds (0.3%) and TIPS (0.2%) outperformed nominal Treasuries as inflation expectations climbed, while, in the United Kingdom, linkers (-1.7%) underperformed nominal gilts.
Among major currencies, the US dollar and UK sterling broadly appreciated, while the euro was mixed. The US dollar advanced against most currencies we track, appreciating the most against the Australian dollar, our equal-weighted emerging markets currency basket, and the Japanese yen; the greenback was effectively flat against the UK sterling. The dollar was mixed over the trailing 12 months. The euro strengthened the most against the Australian dollar, EM currencies, and the Japanese yen, but declined the most relative to the US dollar and UK sterling. The common currency was broadly weaker over the past year, but appreciated against the Australian dollar. UK sterling advanced against most currencies in November, yet was essentially flat versus the US dollar. Sterling appreciated over the past year against all but the Japanese yen.
Currency Performance as of November 30, 2019
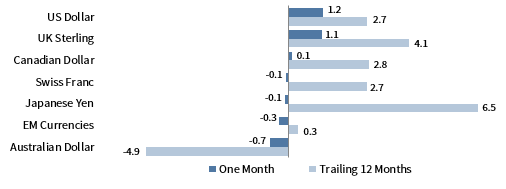
The US dollar broadly appreciated in November, gaining the most relative to the Australian dollar, an equal-weighted basket of emerging markets currencies, and the Japanese yen, but was flat vis-à-vis UK sterling. The greenback was more mixed over the past year.
VERSUS THE US DOLLAR
Total Return (%)
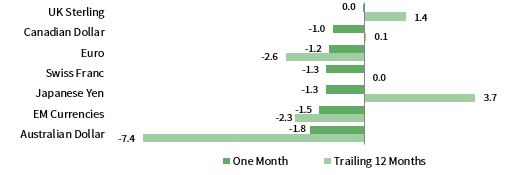
The euro was mixed, declining relative to the US dollar, UK sterling, and Canadian dollar, but gaining the most against the Australian dollar, emerging markets currencies, and the Japanese yen. The common currency generally depreciated over the past year, save for against the Australian dollar.
VERSUS THE EURO
Total Return (%)
UK sterling broadly strengthened as the Conservative Party maintained a lead in the polls heading into December’s general election. Over the past year, UK sterling was generally stronger, advancing against all but the safe-haven Japanese yen.
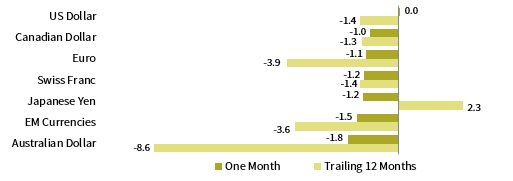
VERSUS THE POUND STERLING
Total Return (%)
Note: EM currencies is an equal-weighted basket of 20 currencies.
USD Market Performance as of November 30, 2019
US and DM equities outperformed in November, while other asset classes experienced more muted returns. US small caps bested large caps, while US stocks outperformed non-US equivalents. HY and IG corporates outgained Treasuries as yields moved higher. REITs and gold declined, but returned the most over the past year.
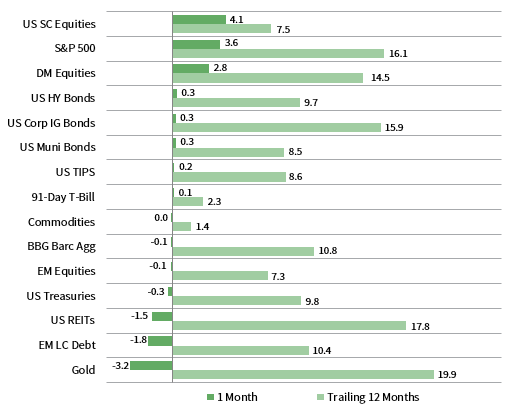
INDEX PERFORMANCE (US$)
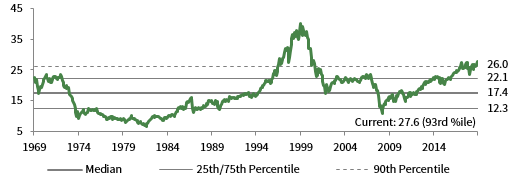
COMPOSITE NORMALIZED P/E: MSCI US
December 31, 1969 – November 30, 2019
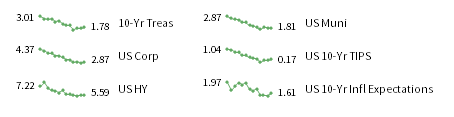
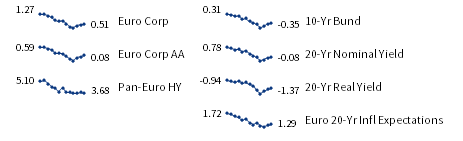
FIXED INCOME YIELDS
November 2018 – November 2019
Euro Market Performance as of November 30, 2019
Equities gained the most, whereas safe-haven government bonds and gold declined. European small caps bested large-cap counterparts, while European stocks in aggregate underperformed broader developed markets peers. HY delivered the lone fixed income gain, outperforming IG corporate and sovereign bonds.
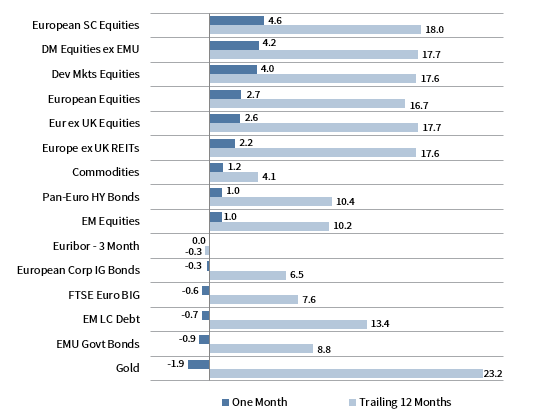
INDEX PERFORMANCE (€)
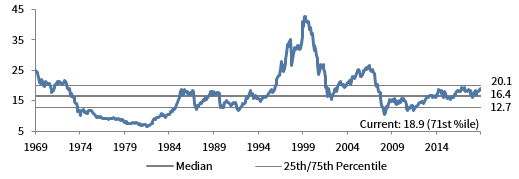
COMPOSITE NORMALIZED P/E: MSCI EUROPE EX UK
December 31, 1969 – November 30, 2019
FIXED INCOME YIELDS
November 2018 – November 2019
Sources: Sources: Bloomberg Index Services Limited, Bloomberg L.P., FTSE International Limited, Frank Russell Company, Intercontinental Exchange, Inc., J.P. Morgan Securities, Inc., MSCI Inc., National Association of Real Estate Investment Trusts, Standard & Poor’s, and Thomson Reuters Datastream. MSCI data provided “as is” without any express or implied warranties.
GBP Market Performance as of November 30, 2019
UK equities bested Europe ex UK counterparts, but underperformed broader developed markets. UK mid caps advanced the most last month. UK linkers and gilts underperformed HY and IG corporate counterparts as real and nominal yields rose.

INDEX PERFORMANCE (₤)
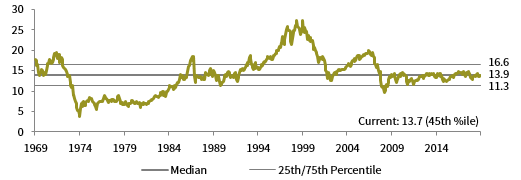
COMPOSITE NORMALIZED P/E: MSCI UK
December 31, 1969 – November 30, 2019
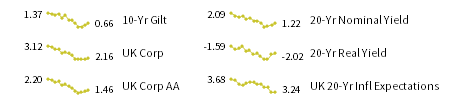
FIXED INCOME YIELDS
November 2018 – November 2019
Sources: Sources: Bloomberg Index Services Limited, Bloomberg L.P., FTSE International Limited, Frank Russell Company, Intercontinental Exchange, Inc., J.P. Morgan Securities, Inc., MSCI Inc., National Association of Real Estate Investment Trusts, Standard & Poor’s, and Thomson Reuters Datastream. MSCI data provided “as is” without any express or implied warranties.
Exhibit Notes
Performance Exhibits
Total return data for all MSCI indexes are net of dividend taxes.
US dollar index performance chart includes performance for the Bloomberg Barclays Aggregate Bond, Bloomberg Barclays Corporate Investment Grade, Bloomberg Barclays High-Yield Bond, Bloomberg Barclays Municipal Bond, Bloomberg Barclays US TIPS, Bloomberg Barclays US Treasuries, BofA Merrill Lynch 91-Day Treasury Bills, FTSE® NAREIT All Equity REITs, J.P. Morgan ELMI+, J.P. Morgan GBI-EM Global Diversified, MSCI Emerging Markets, MSCI World, Russell 2000®, S&P 500, and S&P GSCI™ indexes.
Euro index performance chart includes performance for the Bloomberg Barclays Euro-Aggregate: Corporate, Bloomberg Barclays Pan-Euro High Yield, Citigroup EMU Govt Bonds, Citigroup Euro Broad Investment-Grade Bonds, Euribor 3-month, FTSE® EPRA/NAREIT Europe ex UK, J.P. Morgan ELMI+, J.P. Morgan GBI-EM Global Diversified, MSCI Emerging Markets, MSCI Europe, MSCI Europe ex UK, MSCI Europe Small-Cap, MSCI World ex EMU, MSCI World, and S&P GSCI™ indexes.
UK sterling index performance chart includes performance for the Bloomberg Barclays Sterling Aggregate: Corporate Bond, BofA Merrill Lynch Sterling High Yield, FTSE® 250, FTSE® All-Share, FTSE® British Government All Stocks, FTSE® British Government Index-Linked All Stocks, FTSE® EPRA/NAREIT UK RE, J.P. Morgan ELMI+, J.P. Morgan GBI-EM Global Diversified, LIBOR 3M GBP, MSCI Emerging Markets, MSCI Europe ex UK, MSCI World, MSCI World ex UK, and S&P GSCI™ indexes.
Valuation Exhibits
The composite normalized P/E ratio is calculated by dividing the inflation-adjusted index price by the simple average of three normalized earnings metrics: ten-year average real earnings (i.e., Shiller earnings), trend-line earnings, and return on equity–adjusted earnings. We have removed the bubble years 1998–2000 from our mean and standard deviation calculations. All data are monthly.
Fixed Income Yields
US fixed income yields reflect Bloomberg Barclays Municipal Bond Index, Bloomberg Barclays US Corporate High Yield Bond Index, Bloomberg Barclays US Corporate Investment-Grade Bond Index, and the ten-year Treasury.
European fixed income yields reflect the BofA Merrill Lynch Euro Corporate AA Bond Index, BofA Merrill Lynch Euro Corporate Bond Index, Bloomberg Barclays Pan-European Aggregate High Yield Bond Index, Bloomberg Twenty-Year European Government Bond Index (nominal), ten-year German bund, 20-year European Inflation Swaps (inflation expectations), and the real yield calculated as the difference between the inflation expectation and nominal yield.
UK sterling fixed income yields reflect the ICE BofAML Sterling Corporate AA Bond Index, ICE BofAML Sterling Corporate Bond Index, UK ten-year gilts, Bank of England 20-year nominal yields, and Bloomberg Generic UK 20-year inflation-linked (real) yields.