Capital markets performance was mixed in November as political developments took the spotlight from improving macroeconomic conditions and strong earnings results. Global equities advanced for the 13th consecutive month in US dollar but were flat in UK sterling and declined in euro. Developed markets outperformed emerging markets for the second time in three months, and global growth stocks continued to outperform value counterparts, though by a slim margin as technology stocks experienced a sharp sell-off late in the month. Global government bonds underperformed global equities with yield curves flattening across major economies. Real assets returns were mixed as commodities, global natural resources equities, and global REITs advanced, while energy MLPs declined. Among currencies, the euro and UK sterling strengthened, while the US dollar declined.
Several important macroeconomic and political developments occurred, which contributed to market moves during the month and will also likely help drive market trends going forward. US President Donald Trump continued to make his mark on domestic monetary policy, opting for continuity as he nominated current US Federal Reserve Governor Jerome Powell to succeed Janet Yellen as Fed chair, prompting her to announce her planned retirement at the end of her term early next year. Trump also nominated Marvin Goodfriend, an academic monetary economist who has been critical of Fed policy, to fill one of the three current vacancies on the Fed board. Meanwhile, the Republican-led US Senate appeared on the verge of passing a tax reform bill as the month closed out. Across the Atlantic, the Bank of England (BOE) hiked rates, as expected, for the first time in a decade, but communicated that any further tightening will be very gradual. Negotiators for the United Kingdom and European Union appeared to make progress toward a compromise on the terms of the former’s “Brexit bill,” which, if agreed, would allow the two sides to begin discussions regarding an all-important transitional agreement. In Germany, talks collapsed among Chancellor Angela Merkel’s party and two rivals to form a historic tri-partite coalition, creating uncertainty as to the political direction and leadership of the Eurozone’s largest economy. Finally, OPEC and a group of non-OPEC oil producers, led by Russia, agreed to extend their supply quota through the end of 2018, which should help continue balancing global supply with demand over the coming months.
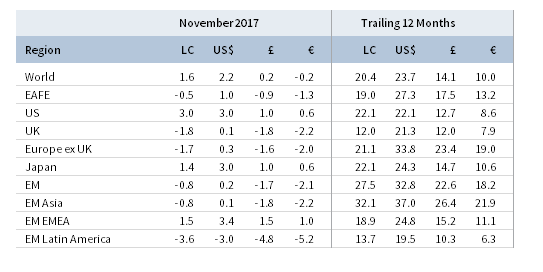
TOTAL RETURN FOR MSCI INDEXES (%)
US equities (3.1% for the S&P 500 Index) advanced for the 13th consecutive month—their longest run since the late 1950s—and are now up 20.5% year-to-date. US stock indexes again set new record highs, boosted by increased optimism for US tax reform late in the month. Third quarter earnings grew an estimated 6% year-over-year according to FactSet, above earlier estimates, led by energy and information technology. Five of seven industries within the IT sector experienced double-digit earnings growth, and the sector was the highest contributor to US earnings growth. Turning to stock performance, all 11 sectors were in the black for the month, with the telecommunications, consumer staples, and consumer discretionary sectors outperforming the most, the latter buoyed by expectations of strong Black Friday sales. Value stocks edged growth stocks after trailing for most of the month, and large caps eked past small caps, as the latter rallied into month-end on tax reform hopes. Macro data continued to impress as the unemployment rate reached its lowest level in 17 years and with third quarter GDP revised slightly upward to 3.3%. The latest reading on the Fed’s preferred inflation metric remained unchanged and well below the 2% target but is not expected to present a roadblock for an expected December rate hike; market participants priced in a 100% probability over the final trading days of the month.
European equities (-1.7%) declined and underperformed developed markets peers. Europe ex UK stocks (-1.7%) edged out UK (-1.8%) and EMU (-2.0%) equivalents in local currency terms. European earnings growth for third quarter is estimated to have been 9%, beating expectations; however, growth falls to 5% excluding the energy sector. Eurozone economic data remained strong as September retail sales growth recovered, the unemployment rate reached its lowest level since January 2009, consumer confidence turned positive for the first time in almost 17 years, and the manufacturing PMI reached its second highest reading on record. Regional political risk increased when talks between German Chancellor Angela Merkel’s CDU Party to form a coalition government with the business-friendly FDP and left-wing Green Party fell apart mid-month, but progress made between EU and UK negotiators late in the month lessened fears of a disorderly Brexit.
Japanese equities (1.4%) advanced but underperformed developed markets peers. The Tokyo Stock Price Index (TOPIX) closed early in the month at its highest level since February 1990, but those gains quickly reversed as volatility picked up during the second half of the month. Earnings data continued to impress; calendar third quarter earnings grew an estimated 16% year-on-year, boosted by the weaker yen. Third quarter GDP grew an estimated 1.4%; the seven consecutive quarters of economic growth is the longest streak since an eight-quarter run that ended in 2001.
Emerging markets equities (0.2% in USD, -1.7% in GBP, and -2.1% in EUR) underperformed developed markets despite tailwinds from USD weakness. Emerging markets have now underperformed developed counterparts for the second time in three months after outperforming each of the first eight months of the year in major currency terms but remain well ahead year-to-date. Relative to broader emerging markets, emerging Europe, the Middle East & Africa outperformed, heavily weighted emerging Asia performed roughly in line, and Latin America underperformed. Among the major markets, only Russia and South Africa enjoyed positive returns in all major currencies.
Real assets performance varied. Commodity futures were mixed (-0.5% for the Bloomberg Commodity TR Index versus 1.4% for the energy-heavy S&P GSCI™ Index) with gains in energy offsetting declines in industrial metals and livestock. Oil prices ($63.57 for Brent and $57.40 for WTI) increased, perhaps in anticipation of an end-of-the-month announcement by OPEC and Russia to extend oil production cuts through the end of 2018. Global natural resources equities (1.2% for the MSCI World Natural Resources Index in USD terms) gained but underperformed global stocks, while energy MLPs (-1.4%) continued to decline as questions around tax treatment of pass-through entities as a result of the US Congress’s ongoing tax reform debate weighed on sentiment. Global REITs (2.8% in USD terms) outperformed most asset classes; US REITs (2.7%) outperformed Europe ex UK REITs (1.1%) and UK REITs (0.1%). Gold (0.8%) advanced in USD terms to $1,279.13/troy ounce after two consecutive months of declines.
Global government bond performance was mixed. EMU government bonds (0.3%) and UK gilts (0.3%) advanced, while US Treasuries (-0.1%) slightly declined for the third consecutive month. The US Treasury yield curve continued to flatten, driven mostly by rising near-term rates as Fed rate hike expectations grew; the benchmark ten-year versus two-year yield spread finished the month at its lowest level since late 2007. Progress on the Senate’s tax reform bill caused US Treasuries to sell off into month-end, and yields for the five- and ten-year rose 13 basis points (bps) and 4 bps to finish at 2.14% and 2.42%, respectively. Five-year UK gilt yields increased 4 bps following the BOE’s rate hike, while ten-year UK gilt yields fell 1 bp, finishing the month at 0.83% and 1.38%, respectively. US credit spreads widened as US investment-grade corporate bonds (-0.1%) performed in line with US Treasuries and outperformed US high-yield bonds (-0.3%). US tax-exempt bonds (-0.5%) underperformed taxable investment-grade equivalents due to a surge in supply as issuers reacted to uncertainty caused by the ongoing tax reform debate regarding the future tax-exempt status of certain types of municipal bonds. Among developed markets inflation-linked bonds, UK linkers (0.6%) and US TIPS (0.1%) outperformed nominal counterparts.
The US dollar reversed its recent rally as it weakened against all major currencies, save for the Australian dollar, and our equal-weighted basket of EM currencies. With the exception of the euro, UK sterling strengthened against all major currencies and our equal-weighted basket of EM currencies, with gains mostly occurring in the final days of the month on news of a potential Brexit compromise. Continuing the recent trends, the euro strengthened against all major currencies and our equal-weighted basket of EM currencies.
Market Exhibits
Currency Performance as of November 30, 2017
The US dollar weakened against all major DM currencies, save for the Australian dollar, as well as versus our EM currency basket, reversing a rally that began in September. All major currencies have appreciated against the US dollar over the past 12 months.
VERSUS THE US DOLLAR
Total Return (%)
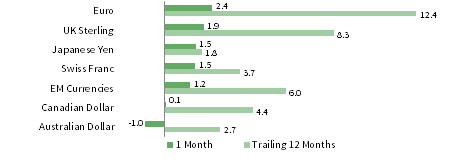
The euro strengthened against all major currencies and our EM currency basket over the past month and the trailing 12 months as the Eurozone’s economic recovery progressed and currency markets anticipated less accommodative policy from the European Central Bank.
VERSUS THE EURO
Total Return (%)
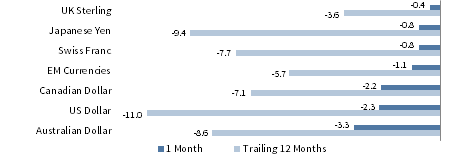
UK sterling advanced on positive developments in Brexit negotiations at month’s end, reversing trends from earlier in the month following the BOE’s dovish rate hike. The pound strengthened against all major DM currencies, save for the euro, and our EM currency basket over the past month and year.

VERSUS THE POUND STERLING
Total Return (%)
Note: EM currencies is an equal-weighted basket of 20 currencies.
USD Market Performance as of November 30, 2017
US large-cap and small-cap equities led risk assets higher, outperforming developed and emerging markets equivalents, domestic bonds, and US REITs in November. The US Treasury yield curve flattened and credit spreads widened as US investment-grade bonds outperformed US high-yield bonds.

INDEX PERFORMANCE (US$)
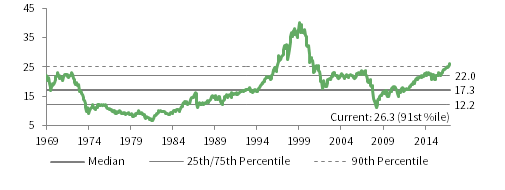
COMPOSITE NORMALIZED P/E: MSCI US
December 31, 1969 – November 30, 2017

FIXED INCOME YIELDS
November 2016 – November 2017
Sources: Barclays, Bloomberg L.P., BofA Merill Lynch, FTSE International Limited, Frank Russell Company, J.P. Morgan Securities, Inc., MSCI Inc., National Association of Real Estate Investment Trusts, Standard & Poor’s, and Thomson Reuters Datastream. MSCI data provided “as is” without any express or implied warranties.
Euro Market Performance as of November 30, 2017
Europe ex UK REITs and EMU investment-grade bonds were among the few asset classes to experience gains, but European bonds lagged equities over the past year. Developed ex EMU stocks barely advanced, while European and EM equivalents declined. European small caps edged out large caps.
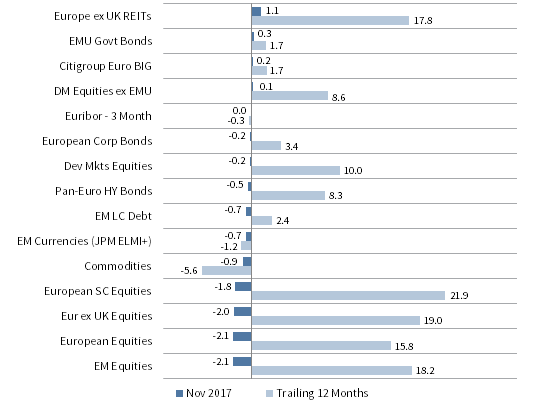
INDEX PERFORMANCE (€)
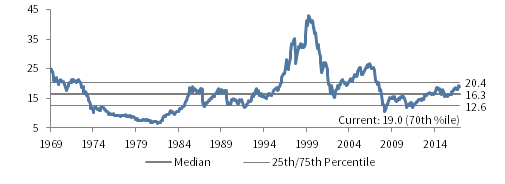
COMPOSITE NORMALIZED P/E: MSCI EUROPE EX UK
December 31, 1969 – November 30, 2017
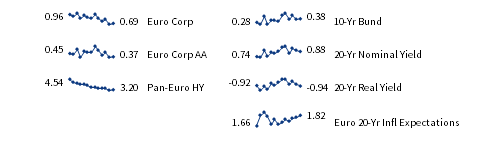
FIXED INCOME YIELDS
November 2016 – November 2017
Sources: Barclays, Bloomberg L.P., Citigroup Global Markets, EPRA, FTSE International Limited, J.P. Morgan Securities, Inc., MSCI Inc., National Association of Real Estate Investment Trusts, Standard & Poor’s, and Thomson Reuters Datastream. MSCI data provided “as is” without any express or implied warranties.
GBP Market Performance as of November 30, 2017
UK linkers and developed ex UK equities led mixed results across asset classes, while EM equities and UK stocks declined the most. Wider credit spreads meant UK gilts outperformed UK investment-grade corporates and UK high-yield bonds. Only commodities have declined over the past year.

INDEX PERFORMANCE (£)
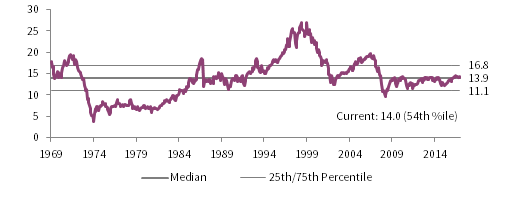
COMPOSITE NORMALIZED P/E: MSCI UK
December 31, 1969 – November 30, 2017
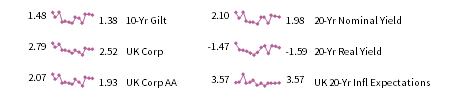
FIXED INCOME YIELDS
November 2016 – November 2017
Sources: Barclays, Bloomberg L.P., BofA Merill Lynch, EPRA, FTSE International Limited, J.P. Morgan Securities, Inc., MSCI Inc., National Association of Real Estate Investment Trusts, Standard & Poor’s, and Thomson Reuters Datastream. MSCI data provided “as is” without any express or implied warranties.
Exhibit Notes
Performance Exhibits
Total return data for all MSCI indexes are net of dividend taxes.
US dollar index performance chart includes performance for the Bloomberg Barclays Aggregate Bond, Bloomberg Barclays Corporate Investment Grade, Bloomberg Barclays High-Yield Bond, Bloomberg Barclays Municipal Bond, Bloomberg Barclays US TIPS, Bloomberg Barclays US Treasuries, BofA Merrill Lynch 91-Day Treasury Bills, FTSE® NAREIT All Equity REITs, J.P. Morgan ELMI+, J.P. Morgan GBI-EM Global Diversified, MSCI Emerging Markets, MSCI World, Russell 2000®, S&P 500, and S&P GSCI™ indexes.
Euro index performance chart includes performance for the Bloomberg Barclays Euro-Aggregate: Corporate, Bloomberg Barclays Pan-Euro High Yield, Citigroup EMU Govt Bonds, Citigroup Euro Broad Investment-Grade Bonds, Euribor 3-month, FTSE® EPRA/NAREIT Europe ex UK, J.P. Morgan ELMI+, J.P. Morgan GBI-EM Global Diversified, MSCI Emerging Markets, MSCI Europe, MSCI Europe ex UK, MSCI Europe Small-Cap, MSCI World ex EMU, MSCI World, and S&P GSCI™ indexes.
UK sterling index performance chart includes performance for the Bloomberg Barclays Sterling Aggregate: Corporate Bond, BofA Merrill Lynch Sterling High Yield, FTSE® 250, FTSE® All-Share, FTSE® British Government All Stocks, FTSE® British Government Index-Linked All Stocks, FTSE® EPRA/NAREIT UK RE, J.P. Morgan ELMI+, J.P. Morgan GBI-EM Global Diversified, LIBOR 3M GBP, MSCI Emerging Markets, MSCI Europe ex UK, MSCI World, MSCI World ex UK, and S&P GSCI™ indexes.
Valuation Exhibits
The composite normalized P/E ratio is calculated by dividing the inflation-adjusted index price by the simple average of three normalized earnings metrics: ten-year average real earnings (i.e., Shiller earnings), trend-line earnings, and return on equity–adjusted earnings. We have removed the bubble years 1998–2000 from our mean and standard deviation calculations. All data are monthly.
Fixed Income Yields
US fixed income yields reflect Bloomberg Barclays Municipal Bond Index, Bloomberg Barclays US Corporate High-Yield Bond Index, Bloomberg Barclays US Corporate Investment-Grade Bond Index, and the ten-year Treasury.
European fixed income yields reflect the BofA Merrill Lynch Euro Corporate AA Bond Index, BofA Merrill Lynch Euro Corporate Bond Index, Barclays Pan-European Aggregate High Yield Bond Index, Bloomberg Twenty-Year European Government Bond Index (nominal), ten-year German bund, 20-year European Inflation Swaps (inflation expectations), and the real yield calculated as the difference between the inflation expectation and nominal yield.
UK sterling fixed income yields reflect the BofA Merrill Lynch Sterling Corporate AA Bond Index, BofA Merrill Lynch Sterling Corporate Bond Index, UK ten-year gilts, Bank of England 20-year nominal yields, and Bloomberg Generic UK 20-year inflation-linked (real) yields. Current UK 20-year nominal yield data are as of November 29, 2017.