The US elections and the OPEC summit were major factors driving global market performance in November, with the outcomes of both reinforcing the reflation trade that began over the summer. Global bonds corrected sharply; developed markets equities as a whole gained, though returns were unevenly distributed; and emerging markets equities fell. Large currency moves once again meant vastly different outcomes depending on one’s home currency—the US dollar and UK pound appreciated strongly versus the euro, yen, and emerging markets currencies. Natural resources equities outperformed global stocks as energy shares rallied hard along with oil prices at month-end, when OPEC and Russia announced an agreement to cut global crude production by more than expected. Other real assets categories lagged as higher bond yields hurt investor appetite for gold and REITs.
Please see Aaron Costello, “Is the Bond Bull Market Over?,” CA Answers, November 15, 2016.
The implications of the recent economic and political developments are potentially significant for multiple asset classes. Improving economic fundamentals and a shift toward more balanced economic policies could spell the end to the 35-year bond bull market as sovereign yields price in the potential for higher growth and/or inflation. The reflation trade also has important consequences for global equities from a factor and sector standpoint. The seismic shifts observed in the bond market in recent months have contributed to a rotation within the equity market away from lower-beta, defensive stocks—whether the quality growth names or the high-yielding bond proxies that investors have favored in recent years—and into higher-beta, cyclical names geared to higher growth, inflation, and interest rates. The outperformance of value indexes over their growth counterparts that began a year ago has accelerated in recent months as a result of higher concentration within cyclical sectors like financials. Bank stocks in particular significantly outperformed in November, as recent events suggest that some relief may soon come from the heavy regulatory burden and financial repression that has characterized the post–global financial crisis environment.
US equities (3.7%), and particularly small caps (11.2%), outperformed on expectations that tax cuts and fiscal stimulus will be prioritized by the incoming government, suggesting a potential boost to earnings next year. The election came amid the conclusion of third quarter results season for the S&P 500, which showed positive year-over-year growth in both revenues and earnings per share for the first time in over a year. All the major US stock indexes hit record highs during the month, with the Russell 2000® Index of small caps experiencing a 15-day winning streak, the longest consecutive advance in 20 years. Small-cap value was the best-performing segment as these stocks stand to benefit the most from lower taxes and stronger domestic growth; mega-cap growth was the worst performer by comparison.
European ex UK equities (-0.1%) underperformed developed markets as Denmark (-4.2%), Portugal (-4.0%), and Spain (-5.4%) suffered large declines. The latter two weighed on returns for Eurozone equities (-0.3%) overall and offset gains in Ireland (4.6%) and France (1.5%), among others. Political risks stemming from the upcoming Italian constitutional referendum also weighed on Eurozone equities despite generally better earnings results, which showed positive growth in earnings per share on a year-over-year basis. Losses in Italy (-0.4%) were modest although beleaguered Italian bank stocks were volatile during the month. UK stocks (-2.0%) gave back some of their year-to-date gains. Increased uncertainty now surrounds the timeline for “Brexit” given the High Court’s ruling that Parliament must vote on Brexit plans, which caused sterling to rally and weighed on UK stock prices.
Japan (5.8%) was the best-performing major developed equity market for a second straight month, though meaningful yen weakness actually translated to losses for unhedged USD and GBP investors and wiped out most of the gains in other foreign currency terms. The yen’s sharp reversal since October from persistent strength earlier this year (more than 18% stronger year-over-year versus USD in third quarter) demonstrates the currency’s ongoing importance for the corporate sector. Third quarter results for Japanese companies were a mixed bag. Growth in earnings per share, from third quarter 2015, was negative but better than recent quarters. Top-line growth was very weak in contrast, with a large majority of companies missing sales estimates and nearly all sectors showing year-over-year declines; currency strength was a major headwind for exporters.
Emerging markets equities (-2.2%) substantially underperformed developed markets equivalents (around 500 to 700 basis points (bps) depending on one’s currency) as higher global interest rates, a stronger greenback, and the incoming US President’s protectionist campaign rhetoric weighed on sentiment, triggering outflows. Foreign investors pulled an estimated US$8 billion from equities during the month, the worst since last December when the first Federal Reserve rate hike occurred. All three regions declined, with Latin America (-4.6%) trailing emerging Asia (-2.0%) and emerging Europe, the Middle East, and Africa (-0.7%) after outperforming in recent months. Countries with large current account deficits and high USD-denominated debt exposure—Brazil (-5.1%), India (-5.2%), Indonesia (-9.1%), South Africa (-4.3%), and Turkey (-5.9%)—were among the worst performers. Mexico (-5.0%) also underperformed as the US election outcome presents risks for the economy given President-elect Donald Trump’s campaign statements promising tougher stances on trade and immigration toward the US’s southern neighbor. Egypt (33.1%) was the best-performing market after the central bank devalued its currency by nearly 50% to meet the IMF’s requirements to release a US$12 billion loan to support the ailing economy. Greece (13.5%) and Russia (6.5%) also outperformed.
Real assets produced a wide spectrum of returns. Global natural resources equities (5.4% for the MSCI World Natural Resources Index) outperformed the broader equities category with above market gains from both energy and metals & mining shares due in part to higher prices for crude oil and industrial metals. WTI and Brent rose 5.5% and 4.5% for the month, ending at $49.44 and $50.47, respectively, after both rallied roughly 9% on November 30 when OPEC and Russia announced a joint agreement between the cartel and some non-OPEC producers to cap supply well below current production levels, a deal which looked in doubt into the eleventh hour. The announcement also boosted energy MLPs (2.3%) as supply cuts could provide a floor to crude prices at a level which makes North American shale production more viable. Copper surged about 20% on the improved global growth outlook after lagging for most of this year’s commodity rally. Commodity futures (1.3% for the Bloomberg Commodity TR Index and 2.5% for the energy-heavy S&P GSCI™) experienced more modest gains as the precious metals category suffered losses, offsetting strong gains from energy and industrial metals. The gold spot price plunged 7.9% to $1,173.76/troy ounce in response to sharply higher bond yields. Global developed REITs (-2.7%) were similarly affected.
Global developed markets government bonds (-1.9%) corrected further amid sharp yield increases and steeper curves in most regions. Ten-year yields for US, UK, and German sovereigns jumped 53 bps, 19 bps, and 11 bps, respectively. The entire US yield curve shifted higher and now sits above levels of a year ago, just prior to the Fed’s first rate hike of this cycle. US Treasuries (-2.7%) suffered their worst month since January 2009 as the market priced in a combination of better economic data, with the latest estimate of third quarter GDP growth revised up to 3.2%, and expectations for higher growth and/or inflation from the incoming government’s proposed policies. US tax-exempt bonds (-3.7%) also dropped the most since the depths of the global financial crisis as President-elect Trump’s policy proposals could hurt demand while boosting supply. UK gilts (-1.3%) also declined on better than expected economic data as well as expectations of increased supply as the British government announced greater debt-financed spending plans in the coming years to support the economy through Brexit. Global linkers (-2.7%) underperformed nominal bonds, primarily due to a correction in UK linkers (-5.4%); US TIPS (-1.9%) outperformed Treasuries in contrast. US high-yield corporates (-0.5%) were supported by higher commodity prices and growth expectations, outperforming investment-grade equivalents (-2.7%), which performed in line with US government bonds.
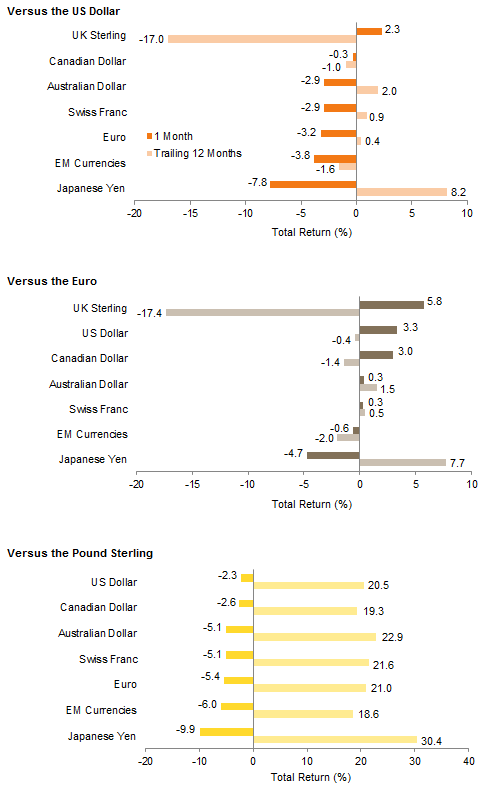
The US dollar index touched a 14-year high during the month, appreciating against all the currencies we track with the exception of the British pound, which strengthened across the board. The greenback was driven higher as the Fed Funds futures market has now fully priced in a mid-December rate hike; rising expectations for further monetary policy divergence widened short-term rate differentials between US Treasuries and major developed counterparts. Sterling experienced a large bounce from its cycle low following the UK High Court ruling. The euro weakened considerably against the UK pound, US dollar, and Canadian dollar, but strongly appreciated versus the Japanese yen; movements versus the Swiss franc and the emerging markets currency basket were muted by comparison. The Mexican peso was among the hardest hit emerging markets currencies due to the US election outcome, while the Chinese yuan hit an eight-year low versus the US dollar.
Market Exhibits
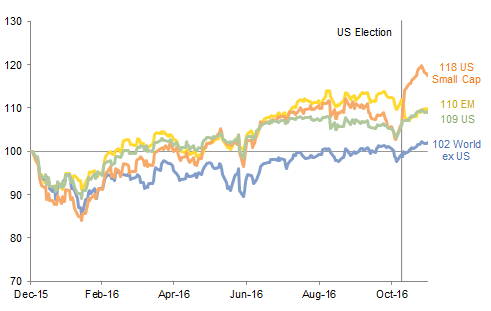
YTD Performance of Global Equities
US equities bounced in November, as the market began to price in better growth potential following the election. US small caps in particular outperformed given expectations of lower taxes and fiscal stimulus boosting domestic growth and shareholder returns. Strong US equity performance helped push up returns for developed markets, while emerging markets underperformed as sentiment turned negative
YTD Performance of Global Equities
As of November 30, 2016 • Local Currency • December 31, 2015 = 100
Sources: Frank Russell Company, MSCI Inc., and Thomson Reuters Datastream. MSCI data provided “as is” without any express or implied warranties.
Notes: Data are daily. Performance reflects total returns in local currency. US Small Cap represented by the Russell 2000® Index. Other regions represented by associated MSCI index. Total returns for developed markets indexes are net of dividend taxes. Total returns for emerging markets indexes are gross of dividend taxes.
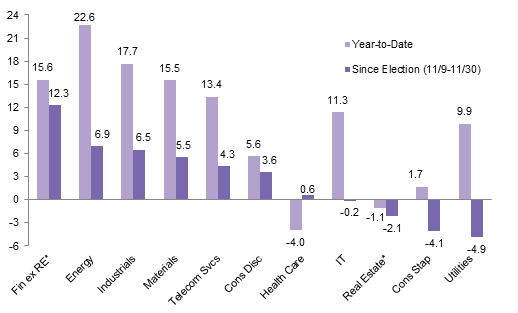
YTD Performance of US Equity Sectors
Cyclical sectors have outperformed defensives this year, a trend that accelerated following the US election as investors gravitated to stocks geared to higher growth, inflation, and interest rates, led by financials. In contrast, defensive growth stocks and low-volatility bond proxies have sold off in recent months, with consumer staples, real estate, and utilities underperforming the most post-election
YTD Performance of US Equity Sectors
As of November 30, 2016 • Percent (%)
Sources: MSCI Inc. and Thomson Reuters Datastream. MSCI data provided “as is” without any express or implied warranties.
Notes: Data represent total returns net of dividend taxes in USD terms for the MSCI US Index. * Real estate became its own sector as of September 1, 2016; we have removed the real estate sector from financials for calendar year 2016 to estimate YTD returns for the “Real Estate” and “Financials ex Real Estate” sectors. The reported YTD return for the financial sector (with real estate included through August 31, 2016) is 17.4%.
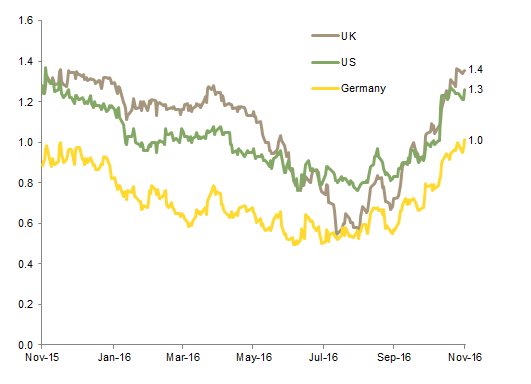
Ten-Year vs Two-Year Government Bond Spreads
Yield curves have steepened but in different ways and for different reasons. US yields have risen throughout the curve, implying expectations for higher inflation but also growth and Fed tightening. Steeper European curves from higher long rates could indicate expectations for higher inflation (and possibly growth) but for central banks to remain accommodative, or may simply reflect higher term premiums
Ten-Year vs Two-Year Government Bond Spreads
November 30, 2015 – November 30, 2016 • Percent (%)
Sources: Bank of England, Federal Reserve, and Thomson Reuters Datastream.
Note: Data are daily.
OPEC Crude Oil Production Quotas and Total Output
On November 30, OPEC and Russia announced a joint agreement to reduce global crude oil production by a combined 1.8 million barrels per day, a larger than expected supply cut, starting in January 2017. Crude oil prices rallied ~9% on that day as the market appeared to believe the decision would place a floor under global prices going forward

OPEC Crude Oil Production Quotas and Total Output
July 31, 1998 – November 30, 2016 • Barrels per Day (millions)
Sources: Bloomberg L.P. and OPEC.
Notes: Prior to January 2012, OPEC production and quota data exclude Iraq. Total output data are as of October 31, 2016. OPEC decided to suspend the existing quota following the December 2015 meeting. The new quota agreed on at the November 30, 2016 meeting will go into effect in January 2017.
Currency Performance
The US dollar index touched a 14-year high, appreciating against all the currencies we track with the exception of the British pound. The greenback was driven higher as the Fed Funds futures market has now fully priced in a mid-December rate hike
The euro weakened considerably against the UK pound, US Dollar, and Canadian dollar, but strongly appreciated versus the Japanese yen; movements versus the Swiss franc and the EM currency basket were muted by comparison
Sterling experienced a large bounce from its cycle low, strengthening across the board, as the UK High Court ruled that the constitution requires Parliament to vote on Brexit plans, suggesting that the start of Article 50 negotiations could be delayed past the government’s stated March 31, 2017, deadline
Currency Performance
As of November 30, 2016
Sources: MSCI Inc. and Thomson Reuters Datastream. MSCI data provided “as is” without any express
or implied warranties.
Note: EM currencies is an equal-weighted basket of 20 currencies.
Index Performance (USD)
US equities outperformed, with US small caps rallying over 11%, their best month since October 2011. Commodities also gained as energy and industrial metals prices rallied and more than offset weakness in precious metals. US bonds experienced sharp corrections, with the exception of high-yield bonds, which benefitted from rising commodity prices and higher growth expectations. Losses suffered by emerging markets assets were magnified by US dollar strength
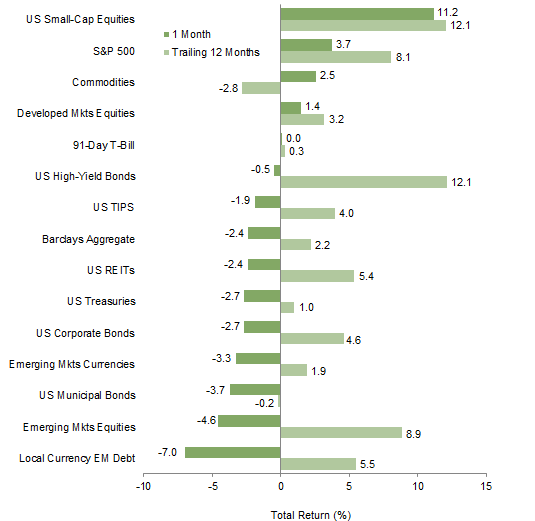
Index Performance (USD)
As of November 30, 2016
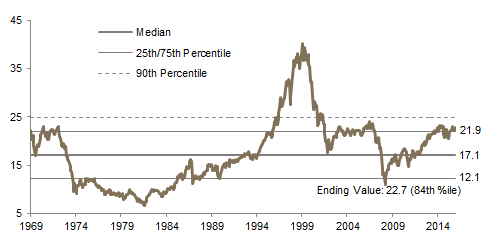
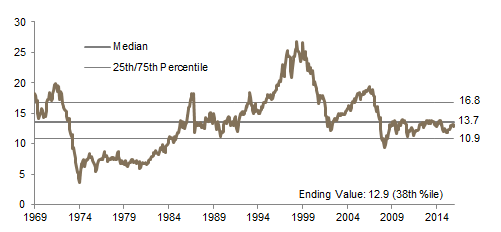
MSCI US Composite Normalized P/E
December 31, 1969 – November 30, 2016
Sources: Barclays, Bloomberg L.P., BofA Merill Lynch, FTSE International Limited, Frank Russell Company, J.P. Morgan Securities, Inc., MSCI Inc., National Association of Real Estate Investment Trusts, Standard & Poor’s, and Thomson Reuters Datastream. MSCI data provided “as is” without any express or implied warranties.
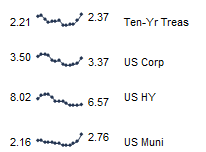
Fixed Income Yields
November 2015 – November 2016
Index Performance (€)
Euro weakness magnified returns for USD-denominated assets, with commodities generating the highest returns. Developed markets equities outperformed European equivalents, which also gained but entirely due to exposure to a stronger British pound. Europe ex UK equities and pan-European high-yield bonds were flat, while investment-grade European bonds retreated, along with emerging markets assets and Europe ex UK REITs
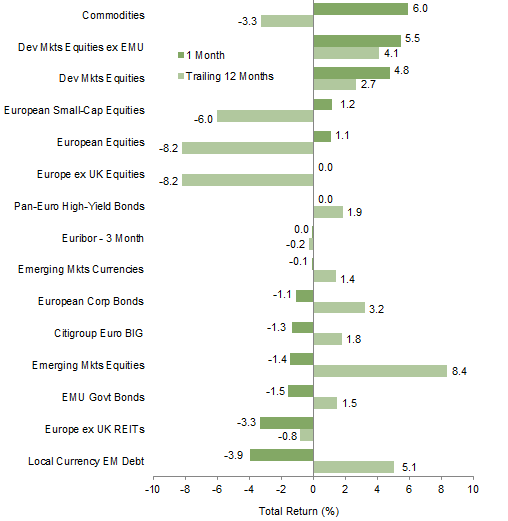
Index Performance (€)
As of November 30, 2016

MSCI Europe ex UK Composite Normalized P/E
December 31, 1969 – November 30, 2016
Sources: Barclays, Bloomberg L.P., Citigroup Global Markets, EPRA, FTSE International Limited, J.P. Morgan Securities, Inc., MSCI Inc., National Association of Real Estate Investment Trusts, Standard & Poor’s, and Thomson Reuters Datastream. MSCI data provided “as is” without any express or implied warranties.
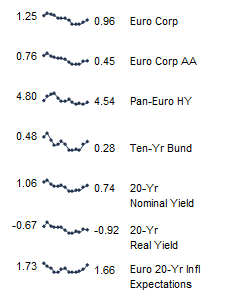
Fixed Income Yields
November 2015 – November 2016
Index Performance (₤)
Sterling strength weighed considerably on the performance of all foreign currency denominated assets, erasing gains for developed markets equities and nearly so for commodities. While returns were basically flat in November, domestic UK risk assets (mid-cap stocks, high-yield bonds, REITs) were among the top performers. Both UK gilts and UK linkers suffered corrections, particularly the latter after strong year-to-date performance. Emerging markets assets declined significantly in GBP terms

Index Performance (₤)
As of November 30, 2016
MSCI UK Composite Normalized P/E
December 31, 1969 – November 30, 2016
Sources: Barclays, Bloomberg L.P., BofA Merrill Lynch, EPRA, FTSE International Limited, J.P. Morgan Securities, Inc., MSCI Inc., National Association of Real Estate Investment Trusts, Standard & Poor’s, and Thomson Reuters Datastream. MSCI data provided “as is” without any express or implied warranties.
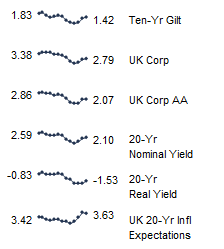
Fixed Income Yields
November 2015 – November 2016
Exhibit Notes
Performance Exhibits
Total returns for MSCI developed markets indexes are net of dividend taxes. Total returns for MSCI emerging markets indexes are gross of dividend taxes.
US dollar index performance chart includes performance for the Bloomberg Barclays Aggregate Bond, Bloomberg Barclays Corporate Investment Grade, Bloomberg Barclays High-Yield Bond, Bloomberg Barclays Municipal Bond, Bloomberg Barclays US TIPS, Bloomberg Barclays US Treasuries, BofA Merrill Lynch 91-Day Treasury Bills, FTSE® NAREIT All Equity REITs, J.P. Morgan ELMI+, J.P. Morgan GBI-EM Global Diversified, MSCI Emerging Markets, MSCI World, Russell 2000®, S&P 500, and S&P GSCI™ indexes.
Euro index performance chart includes performance for the Bloomberg Barclays Euro-Aggregate: Corporate, Bloomberg Barclays Pan-Euro High Yield, Citigroup EMU Govt Bonds, Citigroup Euro Broad Investment-Grade Bonds, EURIBOR 3M, FTSE® EPRA/NAREIT Europe ex UK, J.P. Morgan ELMI+, J.P. Morgan GBI-EM Global Diversified, MSCI Emerging Markets, MSCI Europe, MSCI Europe ex UK, MSCI Europe Small-Cap, MSCI World ex EMU, MSCI World, and S&P GSCI™ indexes.
UK sterling index performance chart includes performance for the Bloomberg Barclays Sterling Aggregate: Corporate Bond, BofA Merrill Lynch Sterling High Yield, FTSE® 250, FTSE® All-Share, FTSE® British Government All Stocks, FTSE® British Government Index-Linked All Stocks, FTSE® EPRA/NAREIT UK RE, J.P. Morgan ELMI+, J.P. Morgan GBI-EM Global Diversified, LIBOR 3M GBP, MSCI Emerging Markets, MSCI Europe ex UK, MSCI World, MSCI World ex UK, and S&P GSCI™ indexes.
Valuation Exhibits
The composite normalized P/E ratio is calculated by dividing the inflation-adjusted index price by the simple average of three normalized earnings metrics: ten-year average real earnings (i.e., Shiller earnings), trend-line earnings, and return on equity–adjusted earnings. We have removed the bubble years 1998–2000 from our mean and standard deviation calculations. All data are monthly.
Fixed Income Yields
US fixed income yields reflect Bloomberg Barclays Municipal Bond Index, Bloomberg Barclays US Corporate High-Yield Bond Index, Bloomberg Barclays US Corporate Investment-Grade Bond Index, and the ten-year Treasury.
European fixed income yields reflect the BofA Merrill Lynch Euro Corporate AA Bond Index, BofA Merrill Lynch Euro Corporate Bond Index, Barclays Pan-European Aggregate High Yield Bond Index, Bloomberg Twenty-Year European Government Bond Index (nominal), ten-year German bund, 20-year European Inflation Swaps (inflation expectations), and the real yield calculated as the difference between the inflation expectation and nominal yield.
UK sterling fixed income yields reflect the BofA Merrill Lynch Sterling Corporate AA Bond Index, BofA Merrill Lynch Sterling Corporate Bond Index, UK ten-year gilts, and Bank of England 20-year nominal, real, and zero coupon (inflation expectations) yields.