November brought renewed US dollar strength and commodity price weakness as some better-than-expected recent US economic data and hawkish comments from the US Federal Reserve highlighted the disparity between a seemingly healthy US economy and economic challenges abroad. After a strong October, global developed markets equities posted modest gains in local currency terms, led by Eurozone and Japanese stocks, while emerging markets equities declined. Small caps strongly outperformed large caps across major markets. Natural resources equities suffered losses, driven by large declines in commodity spot prices. US high-yield bonds also sold off amid further commodity-related credit fears. Among major sovereign bond markets, US Treasuries retreated, while UK gilts and Eurozone sovereign bonds rallied.
Monetary policy divergence is now beginning to play out in real time, with rising interest rate differentials at least partially contributing to the US dollar’s resurgence in November. A strong October jobs report and the upwardly revised third quarter GDP estimate for the US economy improved the prospects for the Fed to announce its first rate hike in almost a decade at its December meeting. This was reflected in the Fed Funds futures market, where, as of month-end, the market was pricing in a 74% probability of a December liftoff—this figure stood as low as 26% in mid-October. The US Treasury yield curve has continued to flatten as a result, with short-end yields rising anywhere between 14 bps for three-month bills and 19 bps for two-year notes in anticipation of a higher benchmark interest rate. The yield spread between two-year US T-notes and equivalent German bunds is now at its widest level this year given expectations that the European Central Bank (ECB) will announce further quantitative easing at its meeting later this week. The euro weakened to just $1.06 as of month-end, raising the possibility of reaching euro/dollar parity for the first time since 2002.
US equities (0.3% in November) saw their fourth quarter rally stall as earnings growth estimates for fourth quarter and calendar year 2016 were downgraded further. Though still negative year-over-year, actual third quarter earnings results for the S&P 500 were better than feared, with three out of every four index constituents beating subdued estimates. In contrast, the majority of S&P 500 companies missed revenue estimates, as US dollar strength and commodity price weakness contributed to a third consecutive quarter of negative top-line growth. Disappointing manufacturing data for November suggest that these headwinds have persisted into fourth quarter. The pending change in US interest rate policy appeared to drive equity sector performance as financials outperformed, while rate-sensitive utilities and telecommunications stocks lagged. In contrast to international markets, value stocks barely edged out growth stocks on a broad market basis. Meanwhile, small caps outperformed large caps for the first time since June, with small-cap growth stocks in particular enjoying strong gains.
In Europe, EMU (2.9%) and Europe ex UK (2.7%) equities continued their leadership over UK stocks (0.3%) in response to renewed euro weakness and in anticipation of further ECB quantitative easing. The latest Eurozone economic data were better than expected, but inflation continues to disappoint, indicating a still-tepid recovery and increasing expectations for additional ECB stimulus. Currency fluctuations and earnings trends helped drive further return dispersion between the United Kingdom and the Continent, as weakness in energy and materials has caused UK earnings estimates to plunge to -14.5% for the full calendar year, while EMU earnings (7.2%) have held up much better. Exposure to metals and mining stocks in particular again weighed on UK large caps’ overall performance; with lower natural resources exposure, UK small caps continued their outperformance in November.
Japanese equities (1.1%) rose modestly, while negative third quarter GDP growth confirmed that the Japanese economy suffered a mid-year technical recession. Fiscal year 2016 earnings estimates have also held up well in Japan in part due to the weaker currency. The latest economic activity data for October were more promising, suggesting Japan will return to growth this quarter. However, inflation remains far below the Bank of Japan’s target. With the central bank under political pressure but reluctant to expand its quantitative easing program, the Abe government is said to be contemplating an additional fiscal spending package for the current year. Export-oriented sectors outperformed more domestic-facing sectors on balance against this backdrop as did small caps, resuming their leadership from earlier this year.
Emerging markets equities (-2.7%) underperformed developed markets stocks, and no region went unscathed, with losses in Latin America (-2.5%) and emerging Asia (-2.6%) slightly less than those in emerging Europe, the Middle East & Africa (-3.2%). The homogenous regional performance masked greater dispersion at the country level. Turkey (-6.0%) was weighed down by instability in neighboring Syria, while commodity exporters Qatar (-13.8%), Colombia (-8.9%), and Peru (-8.6%) also plunged. In contrast, Russia (3.4%) advanced due to likely misplaced speculation that EU economic sanctions would be lifted given prospects for cooperation with Western powers in response to the tragic Paris attacks. The latest economic data out of China, whose equities returned -3.3%, were mixed. The official November purchasing manager index (PMI) for manufacturers fell more than forecast, while the services PMI exceeded expectations.
The US dollar strengthened against most major currencies as the Fed appears poised to begin raising rates in December. The euro and Swiss franc weakened the most versus the dollar, followed by the British pound and Japanese yen. The dollar also appreciated against many emerging markets currencies, as rising US yields reduce the dollar’s usefulness as a funding currency. The Chinese yuan depreciated only modestly versus the dollar, as the People’s Bank of China continued to intervene heavily in the foreign exchange market during the lead up to the currency’s inclusion in the International Monetary Fund’s reserve currency basket, officially announced on November 30.
Global government bonds (0.0%) were largely unchanged in aggregate. However, UK gilts (0.9%) and Eurozone sovereign bonds (0.4%) outperformed US Treasuries (-0.4%), where the yield curve flattened meaningfully in anticipation of a December Fed rate liftoff. US tax-exempt bonds (0.4%) enjoyed modest gains despite rising concern about further Puerto Rico defaults, while US investment-grade corporate credits (-0.2%) were basically flat. Falling commodity prices and fund outflows weighed on US high-yield bonds (-2.2%), though with yields around 8%, many believe at least some default risk is already priced in.
Inflation-sensitive assets were nearly all in the red, but some more than others. Commodities (-7.3% for the Bloomberg Commodity Total Return Index and -9.0% for the energy-heavy S&P GSCI™) suffered sharp declines led by falling energy and industrial metals prices. Prices for crude oil ($41.65 for WTI and $44.61 for Brent) approached their 2015 lows amid rising oil inventories and no signals from the Saudi-led OPEC cartel of any near-term change in production policy. Industrial metals prices fell 5.8% as the supply glut shows no signs of abating despite clearly falling Chinese demand. Precious metals prices, which fell 7.4%, are similarly exposed to supply/demand imbalances, with gold savers also sensitive to changes in US interest rate policy as prices fell nearly 7%. Energy master limited partnerships (-8.1%) gave back most of their October gains, while natural resources equities (-1.6%) sustained more modest losses, though the headline performance concealed a sharp sell-off in metals and mining stocks. Rate-sensitive US REITs (-0.2%) were resilient despite the prospects for a December rate hike, while yields on US Treasury Inflation-Protected Securities, which returned -0.1% for the month, continued to move further into positive territory.
The probability of a December interest rate liftoff by the Fed increased dramatically since the FOMC’s October meeting, contributing to the US dollar strengthening versus most major currencies
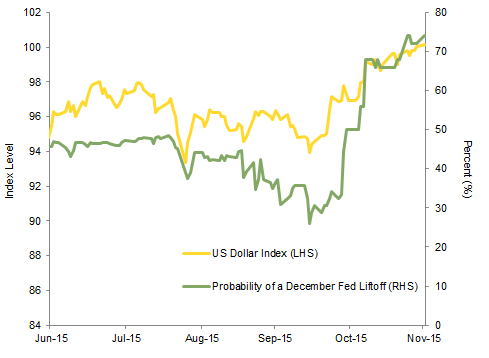
Probability of a December Fed Liftoff vs US Dollar Index
June 30, 2015 – November 30, 2015
Sources: Bloomberg L.P. and Thomson Reuters Datastream.
Note: Probability represents probability that Fed Funds will end December at 0.375% (implying one 25 bp rate hike this year).
The US Treasury yield curve continued to flatten as short rates rose in anticipation of a December rate hike by the Fed. Long rates remain well anchored along with inflation expectations, and US Treasuries overall only suffered minor losses in November
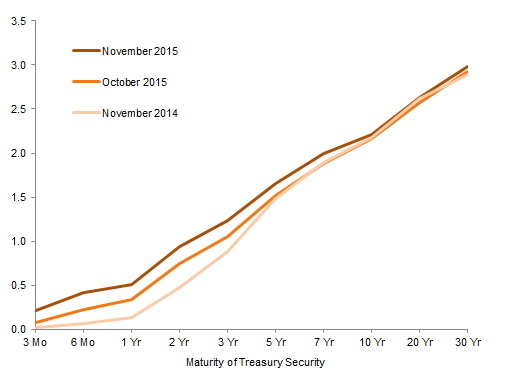
US Treasury Yield Curve
As of November 30, 2015 • Yield (%)
Sources: Thomson Reuters Datastream and US Treasury.
Commodity prices suffered steep declines across most categories in November, with energy and industrial metals prices among the worst performers. Oversupply and falling demand from China continue to be major drivers, as is bearish investor positioning
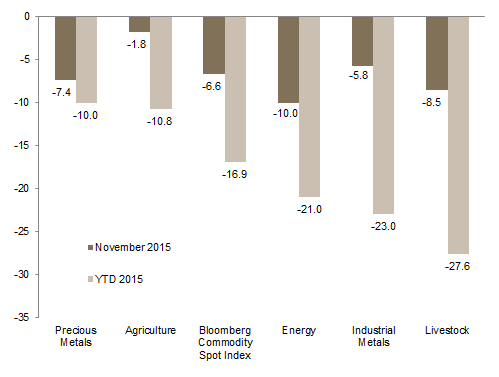
Commodity Price Performance
As of November 30, 2015 • Percent Change (%)
Sources: Bloomberg L.P. and Thomson Reuters Datastream.
Though still negative, third quarter earnings growth (year-over-year) results for the S&P 500 were better than feared, as three out of four companies beat subdued expectations. In contrast, fourth quarter and calendar year 2016 earnings estimates were downgraded further
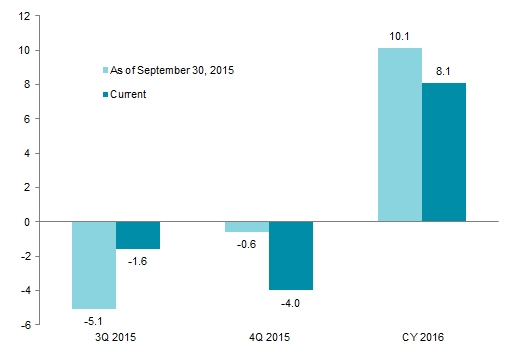
S&P 500 Earnings Growth Estimates
Percent (%)
Sources: FactSet Research Systems and Standard & Poor’s.
Notes: Current estimates are as of November 27, 2015. Q3 data are a blend of actual results (98% of constituents reporting) and estimates.
US tax-exempt bonds and US equities outperformed other domestic asset classes. The strong dollar weighed on the performance of international assets, meaning US equities outperformed Europe ex UK and Japan for dollar investors with unhedged exposure
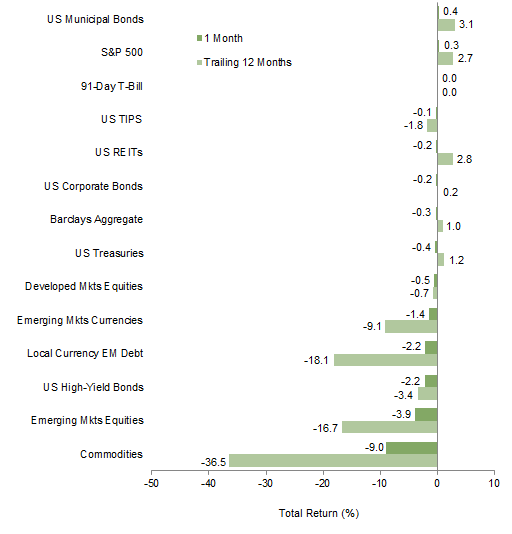
Index Performance (US$)
As of November 30, 2015
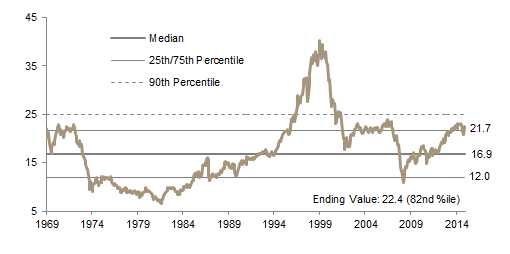
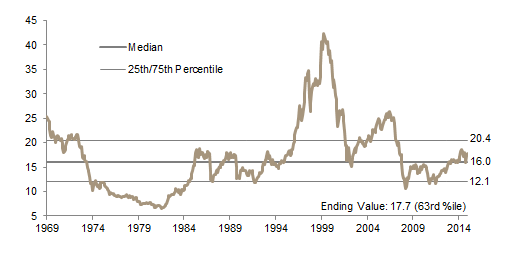
MSCI US Composite Normalized P/E
December 31, 1969 – November 30, 2015
Sources: Barclays, BofA Merill Lynch, FTSE International Limited, J.P. Morgan Securities, Inc., MSCI Inc., National Association of Real Estate Investment Trusts, Standard & Poor’s, and Thomson Reuters Datastream. MSCI data provided “as is” without any express or implied warranties.
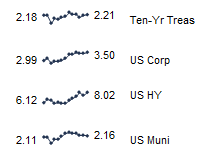
Fixed Income Yields
November 2014 – November 2015
Developed markets equities outperformed all other asset classes in euro terms. The weak euro meant even declining international assets like emerging markets equities and US high-yield bonds generated positive returns for euro investors. Commodities and Europe ex UK REITs suffered the only losses
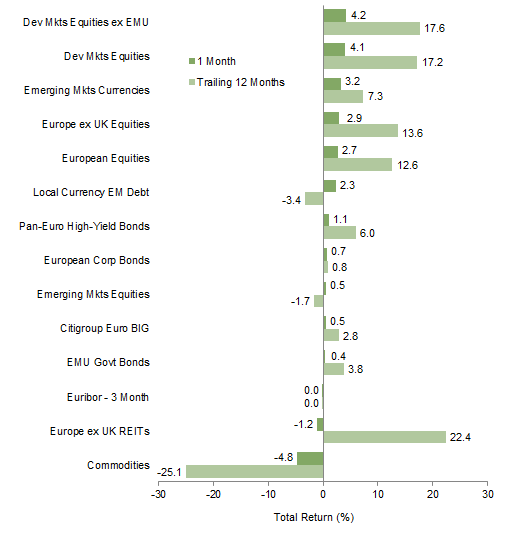
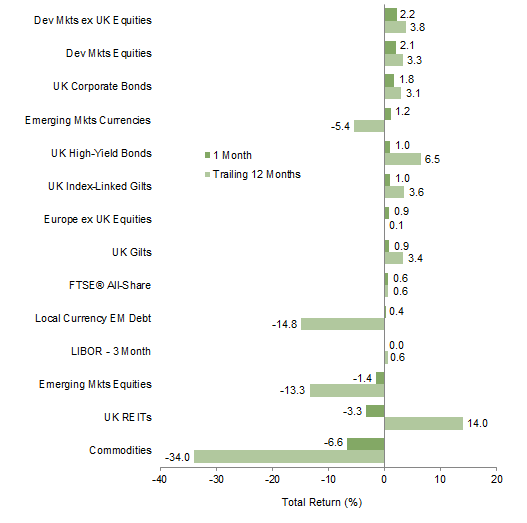
Index Performance (€)
As of November 30, 2015
MSCI Europe ex UK Composite Normalized P/E
December 31, 1969 – November 30, 2015
Sources: Barclays, Bloomberg L.P., BofA Merill Lynch, Citigroup Global Markets, EPRA, FTSE International Limited, MSCI Inc., J.P. Morgan Securities, Inc., National Association of Real Estate Investment Trusts, Standard & Poor’s, and Thomson Reuters Datastream. MSCI data provided “as is” without any express or implied warranties.
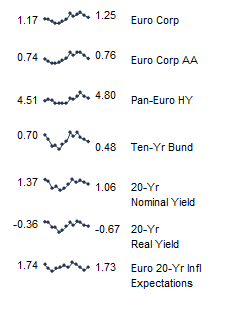
Fixed Income Yields
November 2014 – November 2015
Despite a slight gain, UK equities continued to underperform developed markets peers as well as both domestic investment-grade and high-yield bonds. Emerging markets equities and commodities suffered losses and underperformed UK equities, as they have for the year. UK REITs also declined but have meaningfully outperformed all asset classes on a year-to-date basis
Index Performance (₤)
As of November 30, 2015
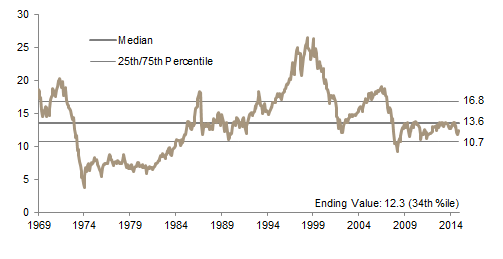
MSCI UK Composite Normalized P/E
December 31, 1969 – November 30, 2015
Sources: Bank of England, Barclays, BofA Merrill Lynch, EPRA, FTSE International Limited, J.P. Morgan Securities, Inc., MSCI Inc., National Association of Real Estate Investment Trusts, Standard & Poor’s, and Thomson Reuters Datastream. MSCI data provided “as is” without any express or implied warranties.

Fixed Income Yields
November 2014 – November 2015
Amid a looming Fed rate hike, the dollar strongly appreciated against most major currencies, save the Australian dollar, with the euro the worst performer against the dollar among the majors. The euro weakened against all major currencies as well as emerging markets currencies in aggregate, as the market appeared to price in further quantitative easing by the ECB. The pound sterling strengthened against the euro and Swiss franc but weakened against the other major currencies, led by the US dollar and Australian dollar. Year-to-date, only the US dollar is meaningfully stronger against the pound
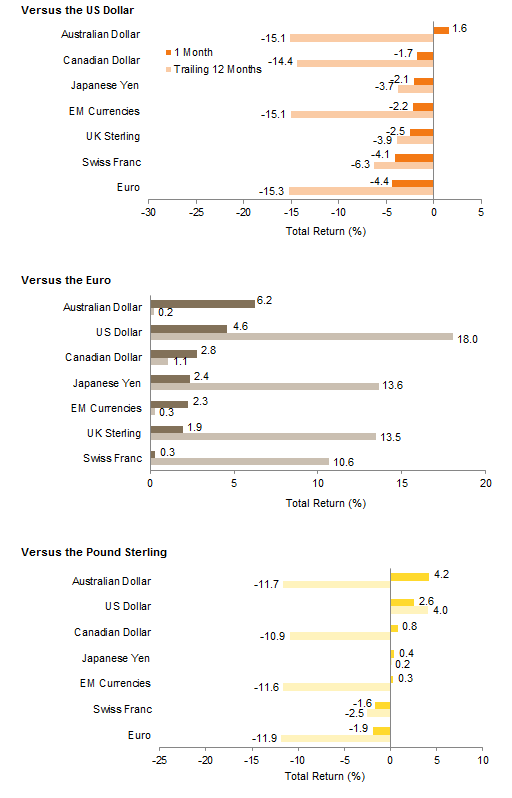
Currency Performance
As of November 30, 2015
Sources: MSCI Inc. and Thomson Reuters Datastream. MSCI data provided “as is” without any express or implied warranties.
Note: EM currencies is an equal-weighted basket of 20 currencies.
Exhibit Notes
Performance Exhibits
Total returns for MSCI developed markets indexes are net of dividend taxes. Total returns for MSCI emerging markets indexes are gross of dividend taxes.
US dollar index performance chart includes performance for the Barclays Aggregate Bond, Barclays Corporate Investment Grade, Barclays High Yield Bond, Barclays Municipal Bond, Barclays US TIPS, Barclays US Treasuries, BofA Merrill Lynch 91-Day Treasury Bills, FTSE® NAREIT All Equity REITs, J.P. Morgan ELMI+, J.P. Morgan GBI-EM Global Diversified, MSCI Emerging Markets, MSCI World, S&P 500, and S&P GSCI™ indexes.
Euro index performance chart includes performance for the Barclays Euro-Aggregate: Corporate, Barclays Pan-Euro High Yield, Citigroup EMU Govt Bonds, EURIBOR 3M, FTSE® EPRA/NAREIT Europe ex UK RE, J.P. Morgan ELMI+, J.P. Morgan GBI-EM Global Diversified, MSCI Emerging Markets, MSCI Europe, MSCI Europe ex UK, MSCI World, MSCI World ex EMU, and S&P GSCI™ indexes.
UK sterling index performance chart includes performance for the Barclays Sterling Aggregate: Corporate Bond, BofA Merrill Lynch Sterling High Yield, FTSE® All-Share, FTSE® British Government All Stocks, FTSE® British Government Index-Linked All Stocks, FTSE® EPRA/NAREIT UK RE, J.P. Morgan ELMI+, J.P. Morgan GBI-EM Global Diversified, LIBOR 3M GBP, MSCI Emerging Markets, MSCI Europe ex UK, MSCI World, MSCI World ex UK, and S&P GSCI™ indexes.
Valuation Exhibits
The composite normalized P/E ratio is calculated by dividing the inflation-adjusted index price by the simple average of three normalized earnings metrics: ten-year average real earnings (i.e., Shiller earnings), trend-line earnings, and return on equity–adjusted earnings. We have removed the bubble years 1998–2000 from our mean and standard deviation calculations. All data are monthly.
Fixed Income Yields
US fixed income yields reflect Barclays Municipal Bond Index, Barclays US Corporate High Yield Bond Index, Barclays US Corporate Investment-Grade Bond Index, and the ten-year Treasury.
European fixed income yields reflect the BofA Merrill Lynch Euro Corporate AA Bond Index, BofA Merrill Lynch Euro Corporate Bond Index, Barclays Pan-European Aggregate High Yield Bond Index, Bloomberg Twenty-Year European Government Bond Index (nominal), ten-year German bund, 20-year European Inflation Swaps (inflation expectations), and the real yield calculated as the difference between the inflation expectation and nominal yield.
UK sterling fixed income yields reflect the BofA Merrill Lynch Sterling Corporate AA Bond Index, BofA Merrill Lynch Sterling Corporate Bond Index, UK ten-year gilts, and Bank of England 20-year nominal, real, and zero coupon (inflation expectations) yields.