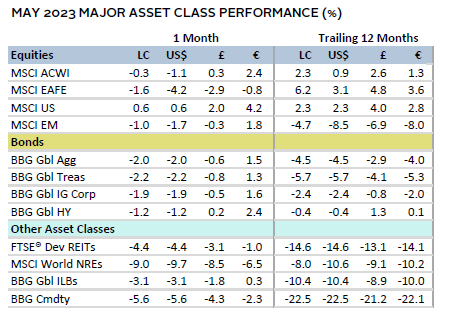
Risk assets generally declined in May, with real assets posting the lowest returns across broad categories. Overall global equities outperformed bonds, with developed markets (DM) equities besting emerging markets (EM) counterparts in local currency (LC) terms, led by Japan and the United States. Growth notably outperformed value as optimism around artificial intelligence (AI) technologies boosted tech shares. Global Treasury bonds performed almost at par with broader investment-grade bonds, while high yields outperformed their investment-grade corporate peers. Commodity prices were dragged down on fears of slowing demand. The US dollar was up 2.6% versus a broad basket of global currencies, while the euro broadly declined and UK sterling mostly appreciated.
Sources: Bloomberg Index Services Limited, Bloomberg L.P., EPRA, FTSE International Limited, MSCI Inc., National Association of Real Estate Investment Trusts, and Thomson Reuters Datastream. MSCI data provided “as is” without any express or implied warranties.
Note: Local currency returns for the Bloomberg fixed income indexes, the Bloomberg Commodity Index, and the FTSE® Developed REITs are in USD terms.
The Macro Picture
Equity returns were modestly negative as select mega-cap US technology stocks buoyed performance. In fact, on an equal-weighted basis, global equities lost 2.2% in LC terms. Hawkish sentiment from central banks, signs of stickier-than-expected inflation, and fears that the United States could default on its debt sooner than anticipated all weighed on markets. Globally, manufacturing purchasing manager indexes (PMIs) across several economies suggested activity contracted more than expected (Japan being a noteworthy exception), while services remained robust.
Investors contended with several macro-related crosscurrents. Debt ceiling concerns put the US sovereign credit rating at risk and sent one-month Treasury yields soaring to all-time highs. By month end, however, a deal suspending the debt ceiling until 2025 was progressing through Congress, with passage expected in early June. Uncertainty also drove the US dollar higher, and mounting concerns of slowing demand—especially from China—were reflected in lower commodity prices. Japanese equities stole the limelight, outperforming DM by nearly 5 percentage points (ppts), on optimism from relatively healthier economic data, constructive equity market reforms, and continued dovishness by the Bank of Japan (BOJ).
Other major central banks raised rates in May. The European Central Bank (ECB) signaled that continued rate hikes were needed to tame inflation, even as Germany entered a technical recession. In the United Kingdom, inflation was ahead of expectations, although lower than the prior month. Investors increasingly priced in that there would be further rate hikes at some point during the summer in the United States, as economic data exceeded expectations. The tone from Federal Reserve insiders remained hawkish as well.
Equities
US equities bested DM and EM peers in May, closing higher despite concerns of the Treasury approaching a potential default sooner than expected. Signs of nearing a deal that suspends the debt ceiling until 2025 with moderate spending cuts helped calm investors. The positive returns were entirely explained by investor optimism for AI-led growth, particularly in the semiconductor space, where Nvidia’s market cap hit a record $1 trillion toward month end. Indeed, information technology (IT) was the best-performing sector in May, outperforming the broader US market by nearly 8 ppts, while energy lagged the most, underperforming by almost 11 ppts.
The Fed raised rates by 25 basis points (bps) in early May and suggested the possibility of a pause in rate hikes at the June meeting. However, stronger-than-expected economic data led investors to price in a higher rate path over the rest of 2023. Jobs numbers for April exceeded expectations, with the unemployment rate tying its lowest level since 1969 (3.4%). Additionally, the Fed’s preferred core inflation metric came in higher than anticipated at 4.7% YOY, accelerating from the prior month. Services PMI expanded for the fourth consecutive month, signaling that the overall economy is still expanding, although the manufacturing PMI remained weak amid poor demand. First quarter earnings also pointed to a slowdown. S&P 500 Index companies reported a 2.1% YOY decline in earnings—the second consecutive quarter of declines. While results were better than expected—with 79% of companies surprising to the upside—the surprise percentage was below the five-year average. Interestingly, a record number (more than 20%) of companies across sectors citied AI during earnings calls, feeding the frenzy.
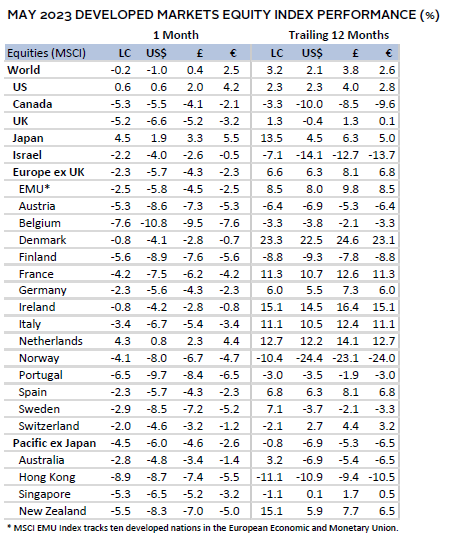
European equities lost momentum this month, posting negative returns. The UK lagged Europe ex UK, and larger economies, such as France and Germany, posted negative returns. Additionally, revised first quarter GDP data showed that Germany’s economy contracted for a second consecutive quarter, and the International Monetary Fund (IMF) now expects it to have the worst GDP growth outlook of G7 economies (-0.1%) in 2023. The Netherlands was the only developed European country that posted a positive return in LC terms.
While eurozone headline inflation was slightly higher than expected at 7.0% YOY in April, core inflation slowed slightly to 5.6% from 5.7% in the prior month. Accordingly, the ECB raised rates by 25 bps, a lower increase than the 50-bp hikes from prior meetings. Data released shortly after month end showed that consumer prices cooled further to 6.1% YOY in May. Inflation rates have cooled and come in lower than anticipated for Spain, France, and Germany. The latter is still challenged with relatively higher inflation. Nevertheless, the ECB signaled additional hikes remain on the table to dampen inflation, and while rates will likely remain high, they are presumably nearing the end of the hiking cycle, given waning economic momentum.
The Bank of England (BOE) also raised rates by 25 bps; inflation exceeded expectations and remained high at 8.7% YOY, which drove consensus terminal rate forecasts higher. UK Chancellor Jeremy Hunt affirmed the need for higher rates to bring inflation to target, even if these hikes lead to a recession. Equities reflected the challenge ahead and lagged major DM peers. Meanwhile, the IMF raised its 2023 GDP growth expectations for the United Kingdom from -0.3% to 0.4% in May, on resilient demand and lower energy costs.
Japanese equities enjoyed a stellar month of returns and were the best performing of major DM regions. While the yen continued to weaken, optimism grew as investors became assured that BOJ policy should remain dovish for the foreseeable future, even as policy tweaks are considered. Governor Kazuo Ueda reiterated the 2% inflation target, noting that current inflationary pressures were driven by temporary cost-push factors and that inflation would likely fall below 2% by late 2023. Investors also flocked to the region on news that Warren Buffet was bullish on Japan. This was further supported by shareholder-friendly reforms that encourage a renewed focus on shareholder returns and profitability, adding to investor confidence. However, economic data released near month end showed retail sales and industrial production disappointed, while consumer confidence held steady.
Pacific ex Japan equities lagged global equities by around 4 ppts. Australia led performance, whereas Hong Kong lagged materially. CPI data in Australia came in hotter than expected at 6.8% YOY versus 6.3% in the prior month. After a brief pause in April, the Reserve Bank of Australia (RBA) returned to increasing its cash rate in May by 25 bps to an 11-year high of 3.85%. RBA Governor Philip Lowe said that the bank was in “data-dependent mode” when assessing monetary policy, which remained restrictive, and that labor productivity growth was needed to combat inflation. Housing and food were the largest contributors to inflation. Meanwhile, the tone from the Reserve Bank of New Zealand was more dovish, signaling the end of its hiking cycle, after a 25-bp hike in May achieved its expected peak rate of 5.50%. Recent retail sales also softened, in line with the bank’s desire to slow demand.
Sources: MSCI Inc. and Thomson Reuters Datastream. MSCI data provided “as is” without any express or implied warranties.
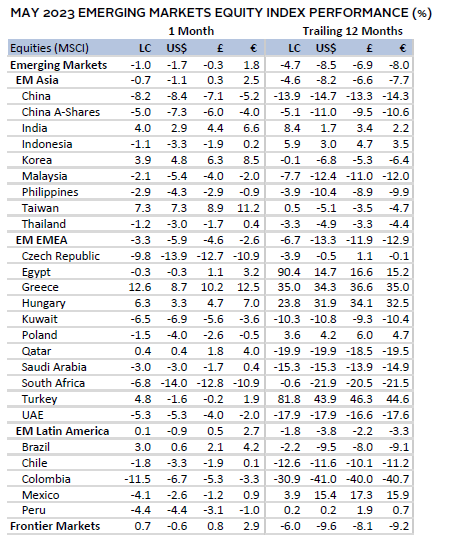
Emerging markets equities lagged DM peers in May, with weakness from China heavily weighing on the group. Returns varied widely—Latin America and emerging Asia led, while Europe, Middle East & Africa (EMEA) lagged. Brazil and India advanced, and although performance for Brazil remains negative year-to-date, it has turned positive for India. The only sector that contributed positively to the broad index return was IT, whereas real estate and materials lagged the most. In general, Asian EM pivoted between positive news in the IT sector and the negative impact from a more muted contribution from China’s reopening and slowing external demand. South Korea saw lower industrial production and exports, while Indian markets were aided by robust economic activity. As expected, Indonesia, South Korea, and Turkey kept policy rates unchanged, but South Africa surprised markets by raising rates 50 bps to a 14-year high of 8.25%, with its central bank warning of further currency weakening.
Chinese equities declined and lagged broader markets, as investors tempered expectations for the pace of recovery as the economy reopens. Investors began to focus on deteriorating economic trends, including a less robust property sector and increasing debt loads for local government and households, leading the latter to hoard cash. Official manufacturing PMI disappointed investors, as it fell to its lowest level since December 2022, when China began lifting its zero-COVID policy restrictions. Economic data vis-à-vis youth employment, factory output, retail sales, and fixed-asset investment also disappointed investors. Headlines highlighting geopolitical friction with the United States on the trade front weighed on sentiment as well.
Sources: MSCI Inc. and Thomson Reuters Datastream. MSCI data provided “as is” without any express or implied warranties.
Fixed Income
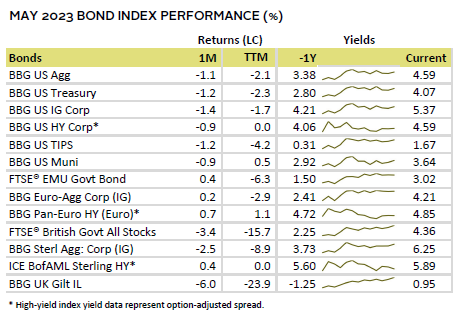
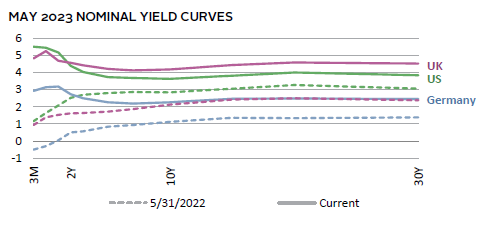
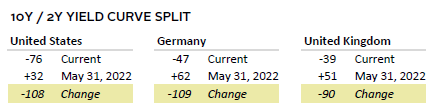
US fixed income assets declined, as debt ceiling fears sent Treasury yields and credit default swap spreads soaring to all-time highs. Yields at the front end of the curve expanded by twice as much as the ten-year and longer instruments, which were also impacted by sticky inflation prints. The two major yield curve spreads (the ten-year/two-year and ten-year/three-month) inverted further. High-yield corporates outperformed their more rate-sensitive investment-grade equivalents, and inflation-protected Treasuries performed at par with nominal peers. Five- and ten-year yields increased by 23 bps and 20 bps, respectively, to 3.74% and 3.64%.
Euro bonds advanced while UK sterling fixed income assets mostly declined. Euro high-yield corporates outperformed EMU government and investment-grade corporate counterparts. Five- and ten-year German bund yields both declined by 5 bps, finishing the month at 2.27%. But yields at the front end of the curve expanded, with the three-month up 28 bps to 2.94. Meanwhile in the United Kingdom, linkers delivered the worst performance, with only UK high-yield corporates posting a positive return. Five- and ten-year gilt yields increased by 50 bps and 44 bps, respectively, to 4.12% each. The ten-year/two-year curve became marginally more inverted, while the ten-year/three-month flattened slightly but remained deeply negative at -71 bps.
Real Assets
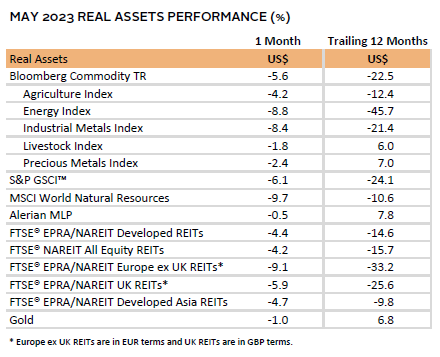
Real assets posted among the sharpest declines in May, contending with not only a stronger US dollar but also fears of slowing global demand. Investors recalibrated expectations for the rebound in Chinese demand, which weighed on the commodities outlook, particularly for energy and industrial metals.
Oil prices ($72.66 for Brent, $68.09 for WTI) fell roughly 10% on the month, reflecting the increased uncertainty in the market and fears of slowing growth. The commodity was unable to hold onto the optimism around demand growth stemming from the return of Chinese tourism. European natural gas prices were also weak, down more than 90% since their peak in August 2022, as inventories have built up to above-average levels for the season and renewable energy output has increased. Weaker Chinese data has also reduced demand for liquefied natural gas.
Global natural resources equities lagged underlying commodities—falling almost 10% — as earlier enthusiasm for a China-led recovery waned. News of China’s steel PMI contracting to July 2022 levels also weighed on broader industrial metals prices.
Global REITs were challenged across the board as bond yields pushed higher, with Europe ex UK posting the weakest returns. In the United States, headlines continued to highlight the mounting pressure on office REITs as lending conditions tightened and occupancy remained challenged.
Gold was unable to hold on to the highs of over $2,000/troy ounce that it reached mid-month, and ultimately settled down 1% for the month. The price was challenged by a rising US dollar and higher yields, despite increased uncertainty in markets. Broadly, however, prices remain near historical highs in nominal terms.
Sources: Alerian, Bloomberg L.P., EPRA, FTSE International Limited, Intercontinental Exchange, Inc., MSCI Inc., National Association of Real Estate Investment Trusts, Standard & Poor’s, and Thomson Reuters Datastream. MSCI data provided “as is” without any express or implied warranties.
Note: Gold performance based on spot price return.
USD-Based Investors
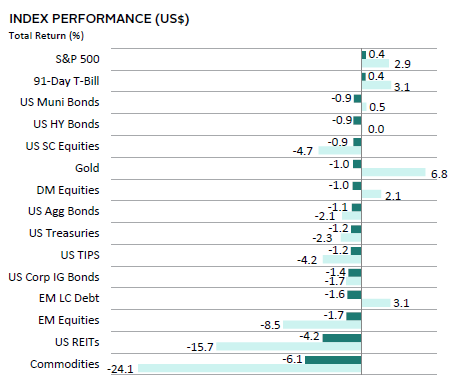
Risk assets were mostly negative in May, as US equities and cash were the only assets with positive returns. US stocks were driven higher by investor optimism for AI-led growth, although positive performance was not widespread, with IT accounting for most of the gains. Cash outperformed due to investor concerns on the debt ceiling and sticky inflation driving longer-dated yields higher. Commodities and US REITs posted weak returns yet again. Commodities were dragged down by concerns of a slowing in China’s economic rebound.
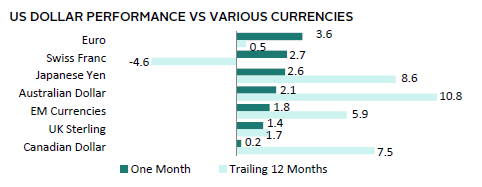
The US dollar was positive across the board, gaining the most versus the euro and Swiss franc. It gained the least versus the Canadian dollar. Over the last 12 months, the directional movement in the US dollar was mostly similar to the trends in May.
The Fed raised rates by 25 bps in early May and suggested the possibility of a pause in rate hikes in June. However, stronger-than-expected economic data led investors to price in a higher rate path over the rest of 2023. Jobs numbers for April exceeded expectations, with the unemployment rate tying its lowest level since 1969 (3.4%). Additionally, the Fed’s preferred core inflation metric came in higher than anticipated at 4.7% YOY, accelerating from the prior month. Services PMI expanded for the fourth consecutive month, signaling that the overall economy is still expanding, although manufacturing PMI remained weak amid poor demand. First quarter earnings, however, pointed to a slowdown. S&P 500 Index companies reported a 2.1% YOY decline in earnings—the second consecutive quarter of declines. While results were better than expected, the surprise percentage was below the five-year average. Interestingly, a record number (more than 20%) of companies across sectors citied AI during earnings calls, feeding the frenzy.
Sources: Bloomberg Index Services Limited, FTSE International Limited, Frank Russell Company, Intercontinental Exchange, Inc., J.P. Morgan Securities, Inc., MSCI Inc., National Association of Real Estate Investment Trusts, Standard & Poor’s, and Thomson Reuters Datastream. MSCI data provided “as is” without any express or implied warranties.
EUR-Based Investors
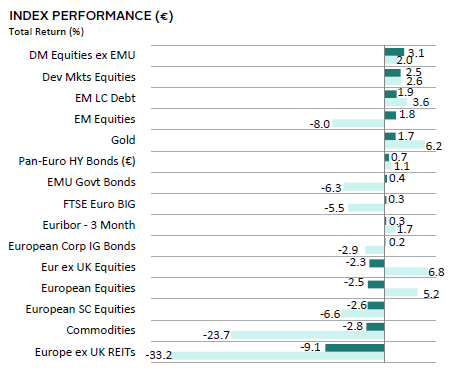
Risk assets were mixed in May, with European assets generally underperforming other broad asset classes. Europe ex UK REITs and commodities were the worst performers; the latter dragged down by concerns on China’s recovery stalling. Over the last 12 months, REITs and commodities were the worst performers, driven by tighter lending conditions and slowing demand. EM equities lagged DM counterparts and EM LC fixed income assets. Safe-haven gold was up, while cash and EMU government bonds performed on par, but lagged high-yield bonds. Investment-grade corporate bonds lagged high-yield corporates but outperformed European equities.
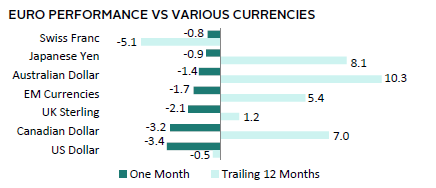
The euro was weak across the board in May, underperforming the most versus the US dollar and Canadian dollar. Over the trailing 12 months, the common currency has advanced across most major currencies, except for the Swiss franc and US dollar.
While eurozone headline inflation was slightly higher than expected at 7.0% YOY in April, core inflation slowed slightly to 5.6% from 5.7% in the prior month. Accordingly, the ECB raised rates by 25 bps, a lower increase than the 50-bp hikes from prior meetings. Data released shortly after month end showed that consumer prices cooled further to 6.1% YOY in May. Inflation rates have cooled and come in lower than anticipated for Spain, France, and Germany. The latter is still challenged with relatively higher inflation. Nevertheless, the ECB signaled additional hikes remain on the table to dampen inflation, and while rates will likely remain high, they are presumably nearing the end of the hiking cycle, given waning economic momentum.
Sources: Bloomberg Index Services Limited, EPRA, European Banking Federation, FTSE Fixed Income LLC, FTSE International Limited, Intercontinental Exchange, Inc., J.P. Morgan Securities, Inc., MSCI Inc., National Association of Real Estate Investment Trusts, Standard & Poor’s, and Thomson Reuters Datastream. MSCI data provided “as is” without any express or implied warranties.
GBP-Based Investors
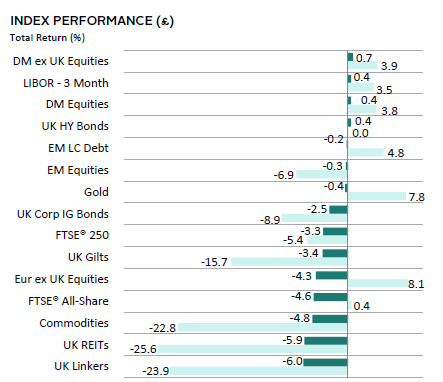
Risk assets were mostly negative in May, led by a modestly positive return from DM equities and cash. UK linkers, UK REITs, and commodities were the worst performers, on concerns of tightening lending conditions and a slower-than-anticipated rebound from China. UK high-yield corporates outperformed gilts and their investment-grade corporate counterparts. Over the last 12 months, REITs, linkers, commodities, and nominal gilts have been the worst performers, impacted by concerns from high inflation, tighter lending conditions, and slowing demand.
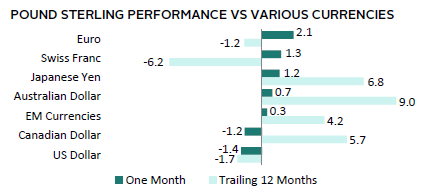
UK sterling mostly advanced in May, gaining the most versus the euro and Swiss franc. It declined only versus the US dollar and Canadian dollar. Over the trailing 12 months, the currency advanced the most versus the Australian dollar, Japanese yen, and Canadian dollar, but declined versus the safe-haven Swiss franc, euro, and USD.
The BOE raised rates by 25 bps, as inflation remained high at 8.7% YOY, which drove consensus terminal rate forecasts higher. UK Chancellor Hunt also affirmed the need for higher rates to bring inflation to target, even if these hikes lead to a recession. Equities reflected the challenge ahead and lagged major DM peers. Meanwhile, the IMF raised its 2023 GDP growth expectations for the United Kingdom from -0.3% to 0.4% in May on more resilient than expected demand and lower energy costs.
Sources: Bloomberg Index Services Limited, EPRA, FTSE International Limited, Intercontinental Exchange, Inc., J.P. Morgan Securities, Inc., MSCI Inc., National Association of Real Estate Investment Trusts, Standard & Poor’s, and Thomson Reuters Datastream. MSCI data provided “as is” without any express or implied warranties.
Performance Exhibits
All data are total returns unless otherwise noted. Total return data for all MSCI indexes are net of dividend taxes.
USD-Based Investors index performance chart includes performance for the Bloomberg US Aggregate Bond, Bloomberg US Corporate Investment Grade, Bloomberg US High Yield Bond, Bloomberg Municipal Bond, Bloomberg US TIPS, Bloomberg US Treasuries, ICE BofAML 91-Day Treasury Bills, FTSE® NAREIT All Equity REITs, J.P. Morgan GBI-EM Global Diversified, LBMA Gold Price, MSCI Emerging Markets, MSCI World, Russell 2000®, S&P 500, and S&P GSCI™ indexes.
EUR-Based Investors index performance chart includes performance for the Bloomberg Euro-Aggregate: Corporate, Bloomberg Pan-Euro High Yield (Euro), EURIBOR 3M, FTSE EMU Govt Bonds, FTSE Euro Broad Investment-Grade Bonds, FTSE® EPRA/NAREIT Europe ex UK RE, J.P. Morgan GBI-EM Global Diversified, LBMA Gold Price AM, MSCI Emerging Markets, MSCI Europe, MSCI Europe ex UK, MSCI Europe Small-Cap, MSCI World ex EMU, MSCI World, and S&P GSCI™ indexes.
GBP-Based Investors index performance chart includes performance for the Bloomberg Sterling Aggregate: Corporate Bond, Bloomberg Sterling Index-Linked Gilts, ICE BofAML Sterling High Yield, FTSE® 250, FTSE® All-Share, FTSE® British Government All Stocks, FTSE® EPRA/NAREIT UK RE, J.P. Morgan GBI-EM Global Diversified, LBMA Gold Price AM, LIBOR 3M GBP, MSCI Emerging Markets, MSCI Europe ex UK, MSCI World, MSCI World ex UK, and S&P GSCI™ indexes.
EM currencies is an equal-weighted basket of 20 emerging markets currencies.
Fixed Income Performance Table
Performance data for US TIPS reflect the Bloomberg US TIPS Index, with yields represented by the Bloomberg Global Inflation Linked Bond Index: US.