Risk assets continued their bumpy ride in May as investors attempted to discount a shifting economic narrative. Still, global equities posted only minor declines in local currency terms despite a meaningful increase in volatility. Value topped growth for the fourth time this year, while large caps outperformed small caps. Investment-grade bonds advanced as US Treasury yields mostly fell, whereas European government bond yields continued climbing across maturities. Commodities rose, driven by higher energy prices, while other real assets were mixed. The US dollar and UK sterling weakened, while the euro broadly gained on expectations of tighter monetary policy.

Sources: Bloomberg Index Services Limited, Bloomberg L.P., EPRA, FTSE International Limited, MSCI Inc., National Association of Real Estate Investment Trusts, and Thomson Reuters Datastream. MSCI data provided “as is” without any express or implied warranties.
Note: Local currency returns for the Bloomberg fixed income indexes, the Bloomberg Commodity Index, and the FTSE® Developed REITs are in USD terms.
The Macro Picture
Asset performance in May reflected increasing concerns about a global economic downturn. Realized volatility spiked to its highest level since 2020 and global equities tested bear market territory before rallying near the end of the month. Still, global equities remain 12% below their early January 2022 peak. Fixed income markets priced in heightened economic uncertainty as corporate credit spreads gyrated and US Treasury yields fell for the first time this year. Market-based measures of inflation expectations also declined.
The global growth outlook continues to be challenged by several key narratives. First, as central banks raise interest rates to combat rampant inflation, investors have become more wary that aggressive policy could induce a near-term recession. Second, China’s zero-COVID policies and stringent containment measures have eroded its growth prospects, threatening spillover effects to the global economy. Finally, the ongoing Russian invasion of Ukraine is adding further disruption to global supply chains—and commodity markets, in particular—that are still reeling from the global pandemic.
Economists are now estimating a 30% chance of a US recession over the next 12 months. Indeed, some signs of slowing economic data and corporate profitability concerns have added to the growth headwinds. Inflationary pressures have dampened consumer sentiment, which plunged to ten-year lows in May, and measures of business confidence have also recently stumbled. Still, US consumer spending jumped in April and continues to outpace month-on-month inflation, the unemployment rate remains historically low, and job growth remains strong.
Equities
US equities posted modest gains in a decidedly volatile market environment. US stocks rallied into month-end, recovering from earlier declines of nearly 6%. Six of 11 S&P 500 sectors advanced, led by energy, utilities, and financials. US energy stocks have gained nearly 60% year-to-date (YTD), trouncing the broader index by 71 percentage points (ppts). Consumer-oriented sectors faltered in May, with both discretionary and staples, along with real estate, declining the most. Indeed, major retailers—including Walmart and Target—delivered disappointing first quarter earnings results, suggesting that inflation has begun to dent profit margins. Value topped growth for the fourth time this year, extending YTD outperformance to 19 ppts. Small caps edged their large-cap peers on the month but have lagged by 14 ppts over the past year.
Signs of cooling economic data contributed to the volatility last month. Consumer sentiment soured, falling to its lowest level in more than ten years, driven largely by high inflation. Indeed, US consumer prices increased 8.3% year-over-year (YOY) in April, remaining near 40-year highs. Underlying inflationary pressures reflected shifting consumption patterns away from goods, as core services registered their largest monthly rise since 1990. Still, real consumer spending rose for a fourth straight month, and retail sales topped expectations. The Federal Reserve continued to target inflation by hiking policy rates 50 basis points (bps) and outlining plans to begin its balance sheet runoff starting in June. Fed Chairman Jerome Powell’s warning that the central bank’s focus on fighting inflation will cause “some [economic] pain” was later allayed by the May meeting minutes, which suggested that Fed rate setters are wary of downside risks to the economy if they tighten too quickly.
European equities declined and matched broader developed stocks, trailing by just 0.1 ppts on the month. UK equities gained and outperformed all other major developed markets, continuing this year’s positive momentum. In fact, UK shares advanced for a sixth consecutive month and have outperformed the broader developed index by nearly 19 ppts YTD. Europe ex UK stocks fell for a second straight month, with performance mildly better than broader developed peers this year.
Eurozone inflation accelerated faster than expected in May to 8.1% YOY, a new record high. While surging food and energy prices drove up the headline figure, core prices also surprised to the upside and hit a new high at 3.8% YOY. Against this back-drop, European Central Bank (ECB) President Christine Lagarde expressed support to begin hiking rates in July. If the bank follows up with another hike in September, it could exit negative policy rates for the first time since 2014. Economic growth concerns mounted, particularly for the euro area’s manufacturing sector. Input prices soared nearly 37% YOY in March, while German industrial production fell more than expected, highlighted by a 4.7% month-on-month decline in new orders.
UK consumer price inflation hit a more than 40-year high in April, accelerating to 9.0% YOY, and core inflation topped expectations at 6.2% YOY. The Bank of England (BOE) lifted policy rates by 25 bps to 1.0%, the highest level in more than 13 years. The BOE also warned that the UK economy is likely to fall into recession this year with inflation topping 10% by fourth quarter. Concerns about a potential forthcoming recession, coupled with the cost-of-living crisis, have driven UK consumer confidence to record lows. Quarterly UK GDP expanded 0.8% in first quarter; however, growth was concentrated in January, whereas GDP contracted slightly in March.
Japanese equities advanced, outperforming broader developed markets for the fourth consecutive month. Performance received a boost in major currency terms as the yen stabilized following a sharp depreciation in April. Still, the yen has weakened 10% versus the US dollar this year and remained near 20-year lows. Japanese GDP contracted 1.0% annualized in first quarter, albeit less than expected, as COVID-19 containment measures curtailed consumer spending. Despite the weak economic environment, Japanese corporate profits expanded 11% YOY in first quarter according to the two-thirds of TOPIX constituents that have reported, which would mark the sixth straight quarter of double-digit growth. Headline consumer price inflation accelerated to 2.5% YOY in April. Although the print matched expectations, it was the highest inflation rate in more than seven years. Surging input prices, which were up 10% YOY in April, suggest inflationary pressures could remain elevated, particularly considering the yen’s recent weakness.
Pacific ex Japan equities declined and trailed all other major developed markets. Australia, New Zealand, and Singapore all lagged the broader index, whereas Hong Kong gained. The Reserve Bank of Australia (RBA) raised its policy cash rate by a higher-than-expected 25 bps in response to high inflation and a strong economic backdrop. The RBA expects unemployment to fall to a nearly 50-year low by early 2023 and noted strength in household and business balance sheets. Australian retail sales expanded for a fourth straight month in April; however, consumer sentiment weakened as the housing market has shown signs of cooling.

Sources: MSCI Inc. and Thomson Reuters Datastream. MSCI data provided “as is” without any express or implied warranties.
Emerging markets equities posted modest declines in May, matching the return of their developed peers. Emerging stocks outperformed in major currency terms, boosted by appreciating currencies. Latin America outperformed among major emerging regions, and was the primary beneficiary of the currency strength, with currencies strengthening between 3% and 6% versus the US dollar. Emerging Asia outperformed the broader index, gaining for the first time this year, whereas emerging Europe, the Middle East & Africa lagged. Most major emerging markets countries advanced on the month, save for India, Saudi Arabia, and South Africa. India’s inflation climbed to 7.8% YOY in April, prompting the Reserve Bank of India to unexpectedly raise policy rates and increase reserve requirements.
Chinese equities gained for just the third time in the past 12 months and remain the laggard among emerging countries over that period. A rollback of COVID-19 containment measures in Shanghai late in the month and loosening monetary policy contributed to the equity market gains. The People’s Bank of China (PBOC) cut the five-year loan prime rate by 15 bps and reduced mortgage rates for first-time homebuyers by 20 bps. The moves came as economic data began to reflect the economic impact of China’s zero-COVID policy. Exports grew at the slowest rate in two years, while industrial output and retail sales declined on YOY basis, both widely missing expectations. PBOC easing was also partially in response to weak credit growth, as new loans fell to the lowest in nearly five years, while broader total social financing slowed to its weakest level since early 2020. Chinese Premier Li Keqiang warned local government officials about risks to economic growth in the current quarter; however, authorities have yet to relax their zero-COVID policy.

Sources: MSCI Inc. and Thomson Reuters Datastream. MSCI data provided “as is” without any express or implied warranties.
Fixed Income
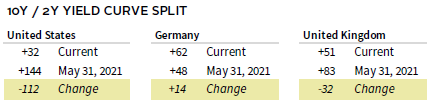
US aggregate bonds gained for the first time in six months as this year’s sharp increase in yields paused. Investment-grade corporate bonds topped Treasuries and high-yield peers but posted the deepest losses over the past year, given the index’s higher duration. The path for high-yield credit spreads reflected the shifting economic narrative, rising as much as 104 bps mid-month, but ultimately ending just 27 bps wider. Ten-year Treasury yields fell 4 bps to 2.85%. Two-year yields—which are sensitive to monetary policy expectations—declined the most across the US yield curve, falling 17 bps to 2.53%. US TIPS lagged among US fixed income categories as ten-year TIPS yields climbed 20 bps to 0.21%, their highest month-end level in nearly three years. This combination meant ten-year breakeven inflation expectations fell 24 bps to 2.64%.
Euro- and sterling-denominated fixed income returns contrasted their US peers as yields climbed. UK gilts declined for a sixth consecutive month and lagged their corporate counterparts. Ten-year gilt yields rose 21 bps to 2.13%, ending the month at their highest level since mid-2015. Inflation-linked gilts declined the most among major bond categories for the month and over the past year. Euro area government bonds similarly trailed corporate peers as ten-year German bund yields rose 19 bps to 1.13%, their highest level in nearly eight years.


Real Assets
Commodity futures climbed for a sixth straight month. Performance was driven entirely by energy prices as all other sub-categories—particularly industrial and precious metals—declined. Industrial metals have declined 22% since peaking in March. Notably, copper prices—widely viewed as a barometer of global economic health—fell to their lowest month-end level in ten months.
Oil prices ($122.84 for Brent and $114.67 for WTI) surged by double digits, closing at their highest month-end levels in more than ten years. EU members agreed to embargo most Russian oil imports as part of a sixth round of sanctions. The plan includes all seaborne oil shipments, which cover roughly two-thirds of European oil imports from Russia. Combined with proposals by Germany and Poland to cease imports through a major pipeline by year-end, the ban would cover 90% of Russian imports to Europe. The package also bans insurers from covering tankers carrying Russian oil to target non-Europe–bound Russian shipments.
Global natural resources equities and energy MLPs delivered strong gains amid the spike in underlying prices.
Global REITs declined for the fourth time this year, as UK, US, and Europe ex UK REITs all fell. Developed Asia REITs gained but remain one of the worst performers over the past year.
Gold prices fell to $1,845.14/troy ounce as a continued climb in real yields outweighed a declining US dollar. Despite continued high inflation rates, the yellow metal is down roughly 5% over the past two months as central banks continue removing monetary accommodation.

Sources: Alerian, Bloomberg L.P., EPRA, FTSE International Limited, Intercontinental Exchange, Inc., MSCI Inc., National Association of Real Estate Investment Trusts, Standard & Poor’s, and Thomson Reuters Datastream. MSCI data provided “as is” without any express or implied warranties.
Note: Gold performance based on spot price return.
USD-Based Investors
Most asset classes delivered muted returns in May as investors digested signs of a global economic slowdown. Equities saw increased volatility during the month as US stocks edged broader developed markets. Emerging markets shares delivered top equity returns but remained the laggard over the past year. Fixed income assets gained on declining US Treasury yields, save for TIPS, as tax-exempt municipal bonds and investment-grade corporates advanced the most. Real assets performance was mixed. Commodity futures outperformed, whereas gold and REITs declined the most.
The US dollar weakened broadly, depreciating the most versus the euro, emerging markets currencies, and the Swiss franc. The opposite was true over the past year, when the dollar gained against all currencies we track, appreciating by double digits vis-à-vis the Japanese yen, euro, and UK sterling.
Signs of cooling economic data contributed to the volatility last month. Consumer sentiment soured, falling to its lowest level in more than ten years, driven largely by high inflation. Indeed, US consumer prices increased 8.3% YOY in April, remaining near 40-year highs. Underlying inflationary pressures reflected shifting consumption patterns away from goods, as core services registered their largest monthly rise since 1990. Still, real consumer spending rose for a fourth straight month, and retail sales topped expectations. The Fed continued to target inflation by hiking policy rates 50 bps and outlining plans to begin its balance sheet runoff starting in June. Fed Chairman Powell’s warning that the central bank’s focus on fighting inflation will cause “some [economic] pain” was later allayed by the May meeting minutes, which suggested that Fed rate setters are wary of downside risks to the economy if they tighten too quickly.


Sources: Bloomberg Index Services Limited, FTSE International Limited, Frank Russell Company, Intercontinental Exchange, Inc., J.P. Morgan Securities, Inc., MSCI Inc., National Association of Real Estate Investment Trusts, Standard & Poor’s, and Thomson Reuters Datastream. MSCI data provided “as is” without any express or implied warranties.
EUR-Based Investors
Most asset classes declined in May as investors digested signs of a global economic slowdown. Equities saw increased volatility during the month, as European and emerging markets equities bested broader developed stocks. European small caps, however, lagged all other equity categories. Fixed income assets generally declined with euro area government bonds trailing corporate counterparts. German ten-year bund yields rose to their highest level in nearly eight years. Real assets performance was mixed. Commodity futures outperformed, whereas REITs and gold declined the most.
The euro broadly strengthened, appreciating the most versus the US dollar, UK sterling, and Japanese yen. The common currency was generally weaker over the past year, particularly versus the US and Canadian dollars. The euro appreciated versus only the yen over the same period.
Eurozone inflation accelerated faster than expected in May to 8.1% YOY, a new record high. While surging food and energy prices drove up the headline figure, core prices also surprised to the upside and hit a new high at 3.8% YOY. Against this backdrop, ECB President Lagarde expressed support for the central bank to begin hiking rates in July. If the bank follows up with another hike in September, as Lagarde expects, it could exit negative policy rates for the first time since 2014. Economic growth concerns mounted, particularly for the euro area’s manufacturing sector. Input prices soared nearly 37% YOY in March, while German industrial production fell more than expected, highlighted by a 4.7% month-on-month decline in new orders.


Bloomberg Index Services Limited, EPRA, European Banking Federation, FTSE Fixed Income LLC, FTSE International Limited, Intercontinental Exchange, Inc., J.P. Morgan Securities, Inc., MSCI Inc., National Association of Real Estate Investment Trusts, Standard & Poor’s, and Thomson Reuters Datastream. MSCI data provided “as is” without any express or implied warranties.
GBP-Based Investors
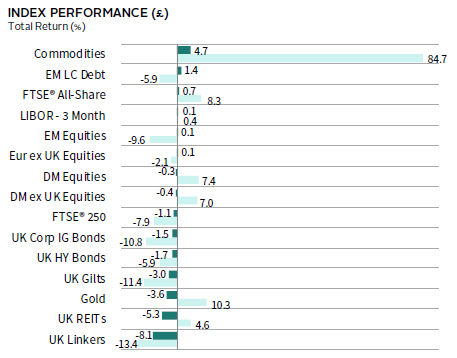
Most asset classes delivered muted returns in May as investors digested signs of a global economic slowdown. Equities saw increased volatility during the month as UK stocks and emerging markets topped broader developed shares. However, UK mid-caps declined the most among major equity categories. Sterling-denominated fixed income categories declined as yields pushed higher. Investment-grade and high-yield corporates bested gilts, whereas UK linkers fell the most. Linkers have also underperformed the most over the past year. Real assets performance was mixed. Commodity futures outperformed, whereas REITs and gold delivered among the steepest declines.
UK sterling generally depreciated in May, weakening the most versus the euro, emerging markets currencies, and the Swiss franc. The pound gained against the US dollar. Sterling was mostly weaker over the past year as well, declining the most relative to the US and Canadian dollars, but gaining vis-à-vis the Japanese yen and euro.
UK consumer price inflation hit a more than 40-year high in April, accelerating to 9.0% YOY, and core inflation topped expectations at 6.2% YOY. The BOE lifted policy rates by 25 bps to 1.0%, the highest level in more than 13 years. The BOE also warned that the UK economy is likely to fall into recession this year with inflation topping 10% by fourth quarter. Concerns about a potential forthcoming recession, coupled with the cost-of-living crisis, have driven UK consumer confidence to record lows. Quarterly UK GDP expanded 0.8% in first quarter; however, growth was concentrated in January, whereas GDP contracted slightly in March.

Sources: Bloomberg Index Services Limited, EPRA, FTSE International Limited, Intercontinental Exchange, Inc., J.P. Morgan Securities, Inc., MSCI Inc., National Association of Real Estate Investment Trusts, Standard & Poor’s, and Thomson Reuters Datastream. MSCI data provided “as is” without any express or implied warranties.
Performance Exhibits
All data are total returns unless otherwise noted. Total return data for all MSCI indexes are net of dividend taxes.
USD-Based Investors index performance chart includes performance for the Bloomberg US Aggregate Bond, Bloomberg US Corporate Investment Grade, Bloomberg US High Yield Bond, Bloomberg Municipal Bond, Bloomberg US TIPS, Bloomberg US Treasuries, ICE BofAML 91-Day Treasury Bills, FTSE® NAREIT All Equity REITs, J.P. Morgan GBI-EM Global Diversified, LBMA Gold Price, MSCI Emerging Markets, MSCI World, Russell 2000®, S&P 500, and S&P GSCI™ indexes.
EUR-Based Investors index performance chart includes performance for the Bloomberg Euro-Aggregate: Corporate, Bloomberg Pan-Euro High Yield (Euro), EURIBOR 3M, FTSE EMU Govt Bonds, FTSE Euro Broad Investment-Grade Bonds, FTSE® EPRA/NAREIT Europe ex UK RE, J.P. Morgan GBI-EM Global Diversified, LBMA Gold Price AM, MSCI Emerging Markets, MSCI Europe, MSCI Europe ex UK, MSCI Europe Small-Cap, MSCI World ex EMU, MSCI World, and S&P GSCI™ indexes.
GBP-Based Investors index performance chart includes performance for the Bloomberg Sterling Aggregate: Corporate Bond, Bloomberg Sterling Index-Linked Gilts, ICE BofAML Sterling High Yield, FTSE® 250, FTSE® All-Share, FTSE® British Government All Stocks, FTSE® EPRA/NAREIT UK RE, J.P. Morgan GBI-EM Global Diversified, LBMA Gold Price AM, LIBOR 3M GBP, MSCI Emerging Markets, MSCI Europe ex UK, MSCI World, MSCI World ex UK, and S&P GSCI™ indexes.
EM currencies is an equal-weighted basket of 20 emerging markets currencies.
Fixed Income Performance Table
Performance data for US TIPS reflect the Bloomberg US TIPS Index, with yields represented by the Bloomberg Global Inflation Linked Bond Index: US.