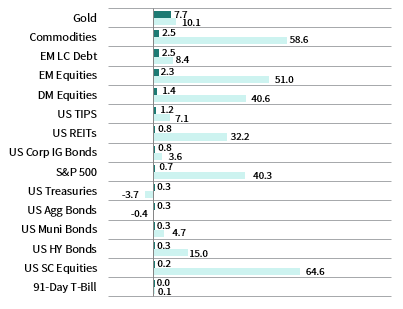
Most asset classes pushed higher in May. Global equities advanced for the fourth straight month, as emerging markets bested developed peers. Strong inflation readings impacted relative style and sector performance; value outperformed growth, with energy and financials gaining the most and technology-oriented sectors declining. Inflation-linked bonds bested other fixed income assets, but nominal sovereign yields declined. Real assets outperformed most asset classes, led by precious metals as gold—a common inflation hedge—surged. The US dollar weakened, UK sterling appreciated, and the euro was mixed.
MAY 2021 MAJOR ASSET CLASS PERFORMANCE (%)
Sources: Bloomberg Index Services Limited, Bloomberg L.P., FTSE International Limited, MSCI Inc., and Thomson Reuters Datastream. MSCI data provided “as is” without any express or implied warranties.
Note: Local currency returns for the Bloomberg Barclays indexes, the Bloomberg Commodity Index, and the FTSE® Developed REITs are in USD terms.
The Macro Picture
Signs of mounting inflationary pressures and their implications for future central bank policy captivated investors during the month. Several measures of US consumer prices trounced expectations, prompting concerns that central banks could raise rates earlier than expected. Moreover, Eurozone inflation exceeded European Central Bank (ECB) targets for the first time since 2018. Still, major central banks have remained largely steadfast in their support, and the Fed noted that inflation increases are likely transitory and reassured markets that it will not prematurely taper asset purchases and tighten rates. Much of the US inflationary surge was driven by what appear to be temporary factors—an increase in the prices of used automobiles due to the global microchip shortage and base effects from the depressed price levels in early 2020.
But not all central banks are following the same playbook, and supply shortages are challenging the notion that inflationary pressures are merely transient. In recent months, the Bank of Canada has tapered asset purchases and signaled they may hike rates next year, while the Reserve Bank of New Zealand (RBNZ) also forecasted rate hikes in 2022. Producer price inflation prints in the United States, the United Kingdom, and China surged in May, driven by significant supply disruptions and pent-up demand as COVID-19 restrictions continue to be lifted. Recent business activity surveys reflect this narrative; raw material shortages and record rates of inflation across both goods and services are passing higher costs on to consumers. Higher fiscal spending has also fueled inflation concerns, as the Biden administration has proposed a $6 trillion budget for fiscal year 2022. As the economic recovery continues to gain momentum, investors will watch for signs of overheating and whether the recent bout of inflation will become more persistent.
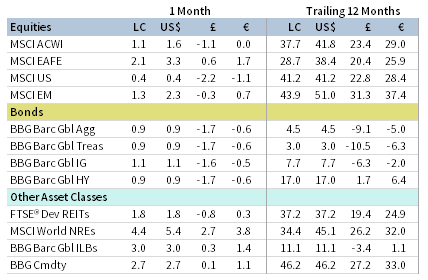
Equities
US equities gained for the fourth consecutive month in May, but trailed their developed ex US and emerging markets counterparts as technology and growth stocks weighed on performance. Seven of 11 S&P 500 Index sectors advanced, led by cyclical and value-oriented sectors such as energy, materials, financials, and industrials, whereas consumer discretionary and utilities declined the most. Over the past 12 months, value stocks have only trailed growth equivalents by roughly 3 percentage points (ppts), the narrowest margin since September 2019. Small caps trailed large caps for a third consecutive month but have outperformed by nearly 22 ppts over the past year. S&P 500 Index companies grew earnings at a 52% year-over-year clip in first quarter 2021, the highest rate since 2010 and more than double the growth rate expected as of first quarter-end.
Economic data releases in May pointed to a continuing, albeit bumpy, recovery. The US economy added 266,000 jobs in April, grossly underwhelming expectations for nearly one million additions; the unemployment rate ticked up 10 basis points (bps) to 6.1% despite record levels of job openings. Counterintuitively, the weak jobs reading was positive for stocks, as markets extrapolated continued easy Fed policy, given the central bank’s recent focus on regaining full employment. Preliminary readings of manufacturing and services activity notched record highs in May, despite ongoing supply constraints and rising prices. However, supply shortages dented industrial production and durable goods orders, with the latter unexpectedly declining as automakers struggle to meet demand amid a global semiconductor shortage. Inflation also appeared in surging US home prices, which posted the largest year-over-year gain since 2005.
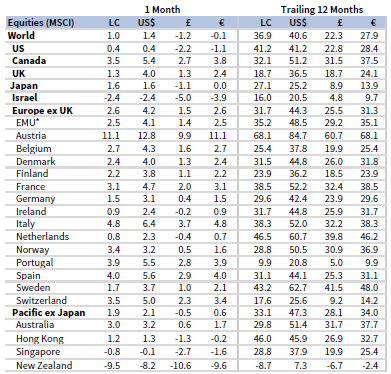
European equities delivered top performance among major developed markets regions. Europe ex UK shares outgained UK equivalents as both outperformed broader developed stocks. While UK equity performance has firmed, shares continue to lag over longer-term trailing periods.
Economic data pointed to an accelerating economic recovery on the Continent, aided by the continuing vaccine rollout and easing of containment measures. Various business survey indicators signaled a rebound in the service sector, with broad Eurozone services activity reaching a nearly three-year high. Manufacturing sector survey data remained firmly in expansionary territory despite supply disruptions and soaring input costs. In Germany, Europe’s largest economy and manufacturing powerhouse, industrial production and export growth accelerated and exceeded expectations. Consumer confidence also improved above pre-pandemic levels, translating to robust and better-than-expected retail sales growth. ECB officials pushed back against market speculation of asset purchase tapering, calling any phasing out of such support premature. However, the ECB also warned of financial stability risks amid current market exuberance.
The United Kingdom continued rolling back virus restrictions, leading to a rebound in economic activity. While GDP growth declined 1.5% quarter-over-quarter in first quarter, economic output accelerated from February to March. Business activity indicator data for May reached the highest levels on record since the late 1990s, retail sales in April surged, and industrial and manufacturing output in March exceeded expectations. The Bank of England (BOE) elected to hold its asset purchase target steady at £895 billion, implying a reduction from the previous pace of asset purchases going forward.
Japanese equities advanced but trailed developed ex US stocks; they outperformed the broader developed markets index as US shares underperformed. Still, Japanese shares have lagged the most among major developed regions year-to-date. Japan’s third COVID-19 state of emergency was expanded to cover a total of nine prefectures and is now set to expire in late June. The new containment measures pushed overall business activity back into contractionary territory, driven largely by a deterioration in the services sector. Japanese GDP declined at a 5.1% annualized rate in first quarter, missing consensus expectations. While more domestically focused data have underwhelmed, with consumer price growth remaining in deflationary territory for the seventh straight month, external demand has been strong, driving robust export growth above expectations.
Pacific ex Japan equities gained, besting broader developed markets stocks but trailing developed ex US counterparts. Australia was the only country to outperform the Pacific ex Japan index, Hong Kong advanced but lagged, while Singapore and New Zealand declined. Singapore, which had been largely successful combatting the spread of COVID-19, imposed containment measures as domestically sourced cases of a virus variant arose in the country. The RBNZ held benchmark interest rate and asset purchase policy steady in May, but surprised markets by forecasting rate hikes as early as September next year. The move sent the New Zealand dollar to a three-month high versus the US dollar. In contrast, the Reserve Bank of Australia signaled that it will likely hold rates steady until 2024. Australian fiscal policy also remains supportive, as the government unveiled a sizable budget and spending package for the fiscal 2021–22 period.
MAY 2021 DEVELOPED MARKETS EQUITY INDEX PERFORMANCE (%)
* MSCI EMU Index tracks ten developed nations in the European Economic and Monetary Union.
Sources: MSCI Inc. and Thomson Reuters Datastream. MSCI data provided “as is” without any express or implied warranties.
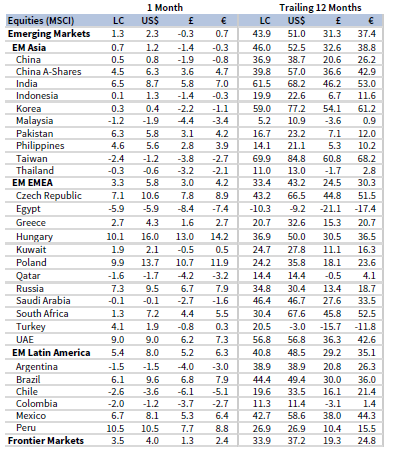
Emerging markets equities advanced, besting broader developed markets for the first time in four months. Still, outperformance was largely driven by weak US equity performance, as emerging shares trailed developed ex US counterparts. Emerging markets lag developed shares by nearly 5 ppts year-to-date, but have maintained their lead over the trailing 12-month period. Among regions, Latin America and emerging Europe, the Middle East & Africa outperformed, while heavily weighted emerging Asia also gained but trailed the broader index. India and Brazil posted top returns among major emerging countries, South Africa matched the broader index, China and Korea advanced but underperformed, while Taiwan declined. Taiwan tightened COVID-19 restrictions after locally borne cases increased during the month. India delivered top performance among major emerging markets despite the ongoing severity of the current COVID-19 crisis. The Reserve Bank of India took steps to boost liquidity and support the economy, while the crisis has disrupted the country’s international trade.
Surging commodity prices sent China’s producer price index up 6.8% year-over-year in April, as Chinese authorities took steps to rein in excessive speculation and hoarding, which they deemed a contributing factor to the recent commodity rally. The Chinese renminbi appreciated in May to a three-year high versus the US dollar, while authorities attempted to balance the stronger currency’s relief to importers amid high commodity prices and the headwind to exports. Notably, more domestically focused China A-shares bested the broader China index. Retail sales and industrial production expanded but missed expectations, while official business survey data showed increasing service sector activity and manufacturing activity expanding at a slower pace.
MAY 2021 EMERGING MARKETS EQUITY INDEX PERFORMANCE (%)
Sources: MSCI Inc. and Thomson Reuters Datastream. MSCI data provided “as is” without any express or implied warranties.
Fixed Income
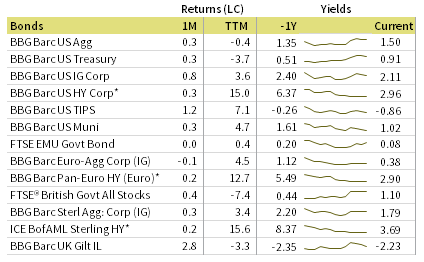
US fixed income advanced in May despite concerns over mounting inflationary pressures. Investment-grade corporate bonds bested their Treasury and high-yield corporate counterparts, with the latter two posting roughly equivalent returns. Investment-grade corporate credit spreads tightened further during the month, while yields on high-yield bonds touched all-time lows. Five- and ten-year Treasury yields declined 7 bps each to 0.79% and 1.58%, respectively, and the ten-year/two-year yield curve spread narrowed 5 bps to 144 bps. US TIPS delivered top performance among US fixed income. Ten-year TIPS yields declined 8 bps, and breakeven inflation inched up to 2.42%; however, market-implied inflation reached as high as 2.54% intra-month. Tax-exempt municipal bonds matched Treasuries.
UK gilts bested sterling investment-grade and high-yield corporate counterparts. Five- and ten-year gilt yields declined 4 bps each to 0.36% and 0.89%, respectively. UK linkers topped all major fixed income categories as various inflation prints showed price increases accelerating. Euro-denominated high-yield corporates outperformed sovereign and investment-grade corporate peers, as German bund yields rose 2 bps to -0.18%. Peripheral yield spreads over German bunds tightened further, with Greek debt ending at its lowest yield premium in more than ten years.
MAY 2021 BOND INDEX PERFORMANCE (%)
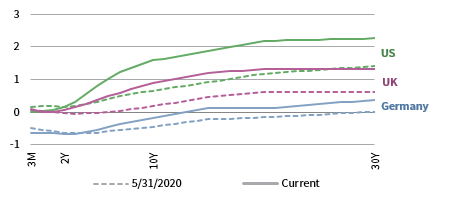
MAY 2021 NOMINAL YIELD CURVES
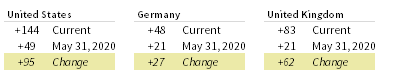
10Y/2Y YIELD CURVE SPLIT
* High-yield index yield data represent option-adjusted spread.
Sources: Bank of England, Bloomberg Index Services Limited, BofA Merrill Lynch, Federal Reserve, FTSE Fixed Income LLC, FTSE International Limited, Intercontinental Exchange, Inc., and Thomson Reuters Datastream.
Real Assets
Commodity futures climbed, led by precious and industrial metals. Aggregate commodity prices have been on a tear as the Bloomberg Commodity Spot Price Index hit its highest nominal month-end level in nearly ten years. While broad commodity prices have been strong, copper and iron ore reached new all-time highs during the month.
Brent and WTI crude oil prices rose to $69.32 and $66.32 per barrel, respectively, with each up more than 30% year-to-date. A ransomware attack shut down the Colonial Pipeline, responsible for nearly 50% of the US East Coast fuel supply, for five days, sending national average gasoline prices above $3 per gallon for the first time since 2014. The International Energy Agency noted that the pandemic-driven global crude oil supply glut had nearly cleared in May, while markets generally absorbed the prospect of Iranian oil returning to global markets amid sanctions negotiations with the United States.
Global natural resources equities and MLPs bested most other real assets and equity categories, gaining for the seventh and eight straight month, respectively.
Global developed REITs also advanced, driven by broad-based gains among regions. Europe ex UK REITs led performance, UK REITs matched the developed index, whereas Asia REITs and US REITs trailed.
Gold prices were the top-performing asset class in May, rising to $1,905.99 per troy ounce. Inflation fears, declining real rates, and a weakening US dollar all factored into the strong month for the yellow metal.
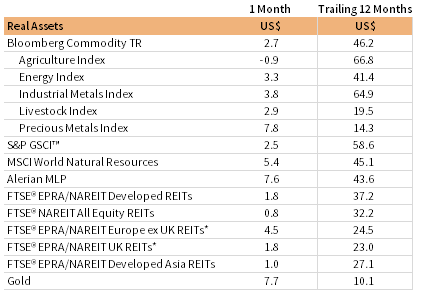
MAY 2021 REAL ASSETS PERFORMANCE (%)
* Europe ex UK REITs are in EUR terms and UK REITs are in GBP terms.
Sources: Alerian, Bloomberg L.P., EPRA, FTSE International Limited, Intercontinental Exchange, Inc., MSCI Inc., National Association of Real Estate Investment Trusts, Standard & Poor’s, and Thomson Reuters Datastream. MSCI data provided “as is” without any express or implied warranties.
Notes: Total return data for all MSCI indexes are net of dividend taxes. Gold performance based on spot price return.
USD-Based Investors
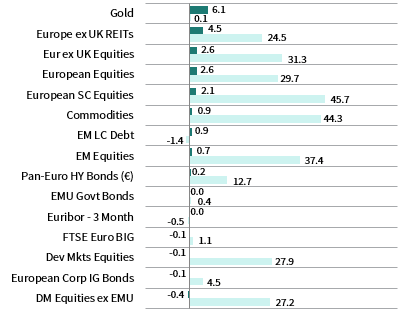
Inflation-sensitive gold and commodities led performance in May as investors digested accelerating price data, the ongoing economic recovery, and implications for central bank policy. Gold prices benefitted from declining real interest rates and received a boost from US dollar weakness. US TIPS outperformed all other domestic equity and bond categories.
US equities trailed broader developed and emerging markets peers. US small caps lagged large caps, but remain the top-performing asset over the past year. US bonds generally advanced and yields declined despite mounting inflationary pressures. Investment-grade corporates and Treasuries bested high-yield bonds, but high-yield corporates returned the most over the past year.
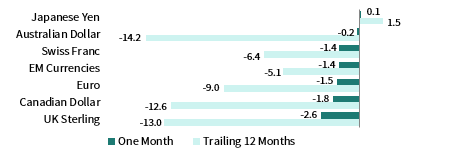
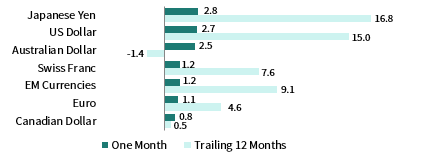
The US dollar generally declined, depreciating the most versus the UK sterling, Canadian dollar, and euro; the greenback traded relatively flat versus the Japanese yen. Trends are similar over the past year, with the US dollar falling the most vis-à-vis the Australian and Canadian dollars and UK sterling.
S&P 500 Index first quarter 2021 EPS growth reached a 52% year-over-year clip, the highest rate since 2010 and more than double the rate expected as of first quarter-end. The US economy added 266,000 jobs in April, grossly underwhelming expectations for nearly one million additions, and the unemployment rate ticked up 10 bps to 6.1% despite record levels of job openings. Preliminary readings of manufacturing and services activity notched record highs in May; however, supply shortages dented industrial production and durable goods orders, with the latter unexpectedly declining as automakers struggle to meet demand amid a global semiconductor shortage.
INDEX PERFORMANCE (US$)
US DOLLAR PERFORMANCE VS VARIOUS CURRENCIES
Sources: Bloomberg Index Services Limited, FTSE International Limited, Frank Russell Company, Intercontinental Exchange, Inc., J.P. Morgan Securities, Inc., MSCI Inc., National Association of Real Estate Investment Trusts, Standard & Poor’s, and Thomson Reuters Datastream. MSCI data provided “as is” without any express or implied warranties.
EUR-Based Investors
Inflation-sensitive gold led performance in May as investors digested accelerating price data, the ongoing economic recovery, and implications for central bank policy. Gold prices benefitted further from declining real interest rates and US dollar weakness. European equities also delivered solid gains as vaccine rollout continued and economic momentum accelerated, outperforming emerging and developed equivalents. Euro strength vis-à-vis major developed pairs translated to losses for developed stocks in euro terms. Within European equities, small caps trailed large caps, but have outperformed over the past year.
Euro-denominated high-yield bonds outperformed other European fixed income assets, as government bonds were flat and investment-grade corporates declined.
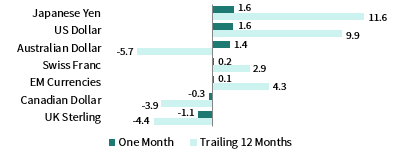
Euro performance was mixed. The common currency strengthened the most versus the Japanese yen, US and Australian dollars, but declined relative to the UK sterling and Canadian dollar. The euro was also mixed over the past year, gaining the most versus the Japanese yen and US dollar, but depreciating against the Australian and Canadian dollars and UK sterling.
Survey indicators showed Eurozone services activity reached a nearly three-year high in May. Manufacturing sector survey data remained firmly in expansionary territory despite supply disruptions and soaring input costs. In Germany, Europe’s largest economy and manufacturing powerhouse, industrial production and export growth accelerated and exceeded expectations. Consumer confidence also improved and retail sales growth was robust. ECB officials pushed back against market speculation of asset purchase tapering, calling any phasing out of such support premature.
INDEX PERFORMANCE (€)
EURO PERFROMANCE VS VARIOUS CURRENCIES
Sources: Bloomberg Index Services Limited, EPRA, European Banking Federation, FTSE Fixed Income LLC, FTSE International Limited, ICE Benchmark Administration Ltd., J.P. Morgan Securities, Inc., MSCI Inc., National Association of Real Estate Investment Trusts, Standard & Poor’s, and Thomson Reuters Datastream.
GBP-Based Investors
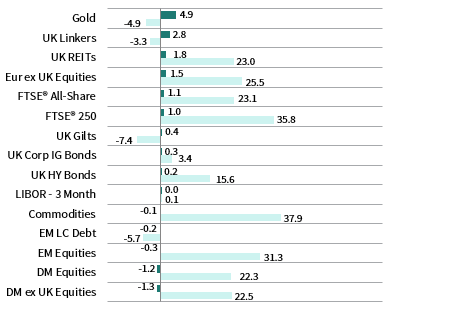
Inflation-sensitive gold led performance in May as investors digested accelerating price data, the ongoing economic recovery, and implications for central bank policy. Gold prices benefitted further from declining real interest rates and US dollar weakness. UK linkers outperformed all other domestic equity and bond categories.
UK equities topped broader developed and emerging markets shares, but were bested by Europe ex UK equivalents. Within UK markets, mid-caps trailed the broader equity universe. UK REITs were among the top-performing asset classes. UK gilts and investment-grade corporates outgained high yield, though the latter returned the most over the past year.
UK sterling broadly strengthened in May, gaining the most versus the Japanese yen and US and Australian dollars. UK sterling mostly appreciated over the past year as well, declining in value versus only the commodity-linked Australian dollar.
The United Kingdom continued rolling back virus restrictions, leading to a rebound in economic activity. While GDP growth declined 1.5% quarter-over-quarter in first quarter, economic output accelerated from February to March. Business activity indicator data for May reached the highest levels on record since the late 1990s, retail sales in April surged, and industrial and manufacturing output in March exceeded expectations. The BOE elected to hold its asset purchase target steady at £895 billion, implying a reduction from the previous pace of asset purchases going forward.
INDEX PERFORMANCE (£)
POUND STERLING PERFORMANCE VS VARIOUS CURRENCIES
Sources: Bloomberg Index Services Limited, EPRA, FTSE International Limited, Intercontinental Exchange, Inc., ICE Benchmark Administration Ltd., J.P. Morgan Securities, Inc., MSCI Inc., National Association of Real Estate Investment Trusts, Standard & Poor’s, and Thomson Reuters Datastream.
Performance Exhibits
All data are total returns unless otherwise noted. Total return data for all MSCI indexes are net of dividend taxes.
USD-Based Investors index performance chart includes performance for the Bloomberg Barclays US Aggregate Bond, Bloomberg Barclays US Corporate Investment Grade, Bloomberg Barclays US High Yield Bond, Bloomberg Barclays Municipal Bond, Bloomberg Barclays US TIPS, Bloomberg Barclays US Treasuries, ICE BofAML 91-Day Treasury Bills, FTSE® NAREIT All Equity REITs, J.P. Morgan GBI-EM Global Diversified, LBMA Gold Price, MSCI Emerging Markets, MSCI World, Russell 2000®, S&P 500, and S&P GSCI™ indexes.
EUR-Based Investors index performance chart includes performance for the Bloomberg Barclays Euro-Aggregate: Corporate, Bloomberg Barclays Pan-Euro High Yield (Euro), EURIBOR 3M, FTSE EMU Govt Bonds, FTSE Euro Broad Investment-Grade Bonds, FTSE® EPRA/NAREIT Europe ex UK RE, J.P. Morgan GBI-EM Global Diversified, LBMA Gold Price AM, MSCI Emerging Markets, MSCI Europe, MSCI Europe ex UK, MSCI Europe Small-Cap, MSCI World ex EMU, MSCI World, and S&P GSCI™ indexes.
GBP-Based Investors index performance chart includes performance for the Bloomberg Barclays Sterling Aggregate: Corporate Bond, Bloomberg Barclays Sterling Index-Linked Gilts, ICE BofAML Sterling High Yield, FTSE® 250, FTSE® All-Share, FTSE® British Government All Stocks, FTSE® EPRA/NAREIT UK RE, J.P. Morgan GBI-EM Global Diversified, LBMA Gold Price AM, LIBOR 3M GBP, MSCI Emerging Markets, MSCI Europe ex UK, MSCI World, MSCI World ex UK, and S&P GSCI™ indexes.
EM currencies is an equal-weighted basket of 20 emerging markets currencies.
Fixed Income Performance Table
Performance data for US TIPS reflect the Bloomberg Barclays US TIPS Index, with yields represented by the Bloomberg Barclays Global Inflation Linked Bond Index: US.