Risk assets advanced again in May, building on April’s strong price momentum. Developed markets equities outpaced more modest gains in emerging markets. Global growth stocks continued to outperform value, bringing trailing 12-month outperformance to the widest margin on record, while small caps topped large caps. High-yield and investment-grade corporate bonds bested sovereigns as credit spreads tightened. Real assets broadly gained, led by commodities, as oil prices staged a strong recovery. The US dollar mostly weakened, the euro appreciated, and UK sterling was buffeted by rising Brexit risks.
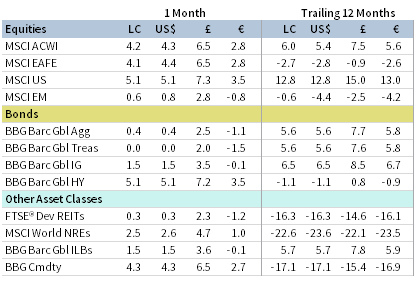
MAY 2020 MAJOR ASSET CLASS PERFORMANCE (%)
Sources: Bloomberg Index Services Limited, Bloomberg L.P., FTSE International Limited, MSCI Inc., and Thomson Reuters Datastream. MSCI data provided “as is” without any express or implied warranties.
Note: Local currency returns for the Bloomberg Barclays indexes, the Bloomberg Commodity Index, and the FTSE® Developed REITs are in US dollar terms.
The Macro Picture
Investors grew more sanguine about a near-term return to economic normalcy as many global economies partially reopened in May. Unprecedented stimulus efforts from central banks and governments also continued to provide a supportive backdrop for risk assets. China, the EU, Japan, and the United States all launched or proposed new measures of fiscal stimulus during the month. Many central banks remain committed to accommodative monetary policies; however, US Federal Reserve Chairman Jerome Powell indicated that the central bank does not see negative rates as an appropriate policy for the United States.
Weak economic data continues to underscore the mounting COVID-19 toll. Global consumer spending has declined at the highest rates on record, manufacturing activity has contracted sharply, and several major economies have fallen into technical recessions. While the economic outlook depends heavily on the uncertain future path of outbreak, some public health experts have warned that a second wave of coronavirus could be imminent in economies that prematurely lift lockdown restrictions. There have been positive developments in the race to develop an effective vaccine, which is seen as crucial for widespread immunity. US-based drug maker Moderna shared encouraging early results from its COVID-19 vaccine trial, and China announced that it could have a vaccine by 2020 year-end. US-China tensions resurfaced and intensified near the end of May, as China imposed a contentious national security law on Hong Kong, prompting President Trump to retaliate with plans to revoke special trade privileges from the territory.
Equities
US equities continued their rebound in May and outperformed global ex US counterparts, bringing trailing one-year outperformance to more than 15 percentage points. US stocks have now retraced 72% of their peak-to-trough drawdown (having gained 36.1% since the March 23 low) and sit just 10% below the February 19 all-time high. All 11 S&P 500 sectors gained as information technology, materials, and communication services outperformed the most, whereas consumer staples, energy, and real estate advanced the least. US small caps topped large caps for the second consecutive month, while growth stocks’ dominance over value continued. Over the past 12 months, US growth has outperformed US value by the widest margin since the 12-month period ended August 2000.
Economic data released in May were staggering, particularly for consumers. Still, US equities rallied on hopes for a swift return to growth as all 50 states eased containment measures to some extent. The US economy shed 20.5 million jobs in April, more than ten times the previous monthly record, lifting the unemployment rate to 14.7%—a level last seen during the Great Depression era. Weekly initial unemployment claims continued to be reported in the millions, reaching more than 40 million cumulative over the past ten weeks. Devastation in the labor market contributed to record declines in consumer spending and retail sales, while month-over-month core price inflation also fell the most on record. Economic pain was widespread as industrial production caved at its sharpest rate on record, while business activity data remained deeply in contractionary territory.
European equities trailed broader developed markets stocks; however, Europe ex UK bested the broader market in major currency terms and UK shares lagged due to significant currency movements for the month. Gloomy economic data abounded in May, but market performance may have more closely reflected political outcomes. The European Commission (EC) proposed a €750 billion joint recovery fund comprising grants and loans to support member countries. France and Germany initially proposed a €500 billion joint fund, paving the way for the broader EC proposal, but mutualized stimulus remains a contentious issue among member states. Stimulus policies thus far have allowed for relatively resilient labor markets, in contrast to the United States, largely a result of differences in policy transmission and local labor laws. In the United Kingdom, the most recent round of Brexit trade negotiations ended in deadlock, raising the risk of a no-deal, hard Brexit outcome as UK leadership recommitted to not extending the deadline past 2020 year-end.
Hard economic data deteriorated further in May. Germany’s economy—Europe’s largest—contracted 2.2% quarter-over-quarter in first quarter, entering a technical recession after downward revisions indicated that fourth quarter 2019 growth was also negative. Eurozone retail sales and industrial production both fell at a record-breaking double-digit clip. Data were similarly weak in the United Kingdom, with GDP contracting in March at the fastest rate on record. Despite the deluge of weak economic data, European sentiment indicators ticked slightly higher as lockdowns eased. Still, 2020 growth forecasts from the Bank of England (BOE) and EC pointed to historically sharp economic declines.
Japanese equities outperformed other major developed markets regions as authorities committed to restoring the economy and ended the coronavirus state of emergency. Japanese GDP beat expectations but contracted at a 3.4% annualized pace in calendar first quarter, entering a technical recession. Other data showed that consumer spending, industrial production, and foreign trade declined sharply; however, unemployment rose just 10 basis points (bps). Prime Minister Shinzo Abe’s cabinet approved yet another $1.1 trillion fiscal stimulus package, bringing total stimulus thus far to roughly 40% of GDP. Additionally, the Bank of Japan expanded its monetary stimulus measures by introducing a zero-interest loan program for small- and medium-sized businesses.
Emerging markets equities were muted, trailing developed peers despite a weakening US dollar. Emerging Asia weighed on performance, lagging Latin America and emerging Europe, the Middle East & Africa, which outperformed the broader index. South Africa, India, Taiwan, and China declined, dragging on overall emerging markets returns, whereas Brazil and Korea advanced. Escalating US-China tensions weighed on sentiment during the month as the Trump administration sought to act against China for perceived mishandling of the COVID-19 outbreak and approval of the contentious Hong Kong national security law. Further agitating relations, the US Senate took steps to limit Chinese companies’ ability to list on US exchanges, passing legislation that bars companies under foreign government control. These renewed tensions raised doubts regarding the recently passed Phase One trade deal.
Chinese data were mixed; industrial production increased, trade data exceeded expectations, but retail sales slumped. The People’s Bank of China cut reserve requirements for large banks, while Chinese officials abandoned full-year GDP growth targets. Elsewhere, COVID-19 cases spiked in Brazil and Russia, though associated equity markets gained for the month. Argentina defaulted on its debt for the ninth time after failing to reach a restructuring deal with bondholders.

MAY 2020 EQUITY INDEX PERFORMANCE (%)
Sources: MSCI Inc. and Thomson Reuters Datastream. MSCI data provided “as is” without any express or implied warranties.
Fixed Income
High-yield and investment grade corporate bonds advanced, outperforming sovereign counterparts as credit spreads narrowed. The Fed officially began corporate bond ETF purchases in efforts to offset mounting financial stress. US Treasuries moderately declined as ten-year yields nudged up 1 bp to 0.65%, whereas five-year yields fell 6 bps to 0.30%. Two- and five-year Treasury yields touched all-time lows during the month as the United States announced expected borrowing of $3 trillion in second quarter, more than five times the prior quarterly high. TIPS outperformed nominal Treasuries, pushing real yields further into negative territory and lifting ten-year breakeven inflation rates 65 bps above their March low. Tax-exempt municipal bonds rebounded but continue to lag other fixed income sectors year-to-date.
Relative performance for sterling-denominated bonds mirrored US counterparts. The BOE’s consideration of negative policy rates sent gilt yields to new all-time lows, with five-year maturities falling into negative territory for the first time. UK linkers outperformed nominal gilts. German ten-year bund yields rose 14 bps, while more peripheral Spanish and Italian government bond yields fell on news of the EC’s proposed stimulus package.

MAY 2020 BOND INDEX PERFORMANCE (%)
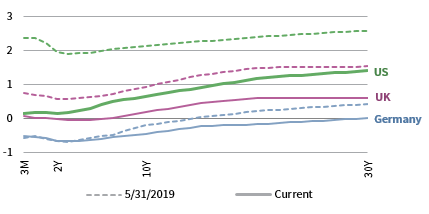
MAY 2020 NOMINAL YIELD CURVES
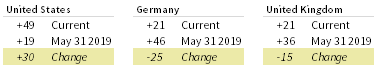
10Y/2Y YIELD CURVE SPLIT
Sources: Bank of England, Bloomberg Index Services Limited, BofA Merrill Lynch, Federal Reserve, FTSE Fixed Income LLC, FTSE International Limited, Intercontinental Exchange, Inc., and Thomson Reuters Datastream.
Real Assets
Commodities outperformed most asset classes, driven by the energy commodities, while most other sectors also gained.
Oil prices ($35.33 for Brent and $35.49 for WTI) surged, with the US benchmark gaining nearly 80% for the month. Oil prices were propelled by prospects for more balanced fundamentals. OPEC+ members began production cuts on May 1 (Saudi Arabia later pledged to increase its cuts) and US supply also declined, while demand improved as economies begin to reopen.
Global natural resources equities and MLPs gained, supported by stronger underlying commodity prices. Energy was among the worst-performing equity sectors, in part reflecting expectations for continued headwinds from the lower oil price environment. Oil prices are roughly half of their January highs.
Global developed REITs were flat; Europe ex UK and US REITs outperformed, UK REITs matched the broader index, and a sharp sell-off in Hong Kong REITs led to declines for broader Asia REITs.
Gold prices ($1,731.55 per troy ounce) advanced for the month amid continued macroeconomic uncertainty, a declining US dollar, and expanding fiscal policy measures. Gold performance over the past year was the strongest since the 12-month period ended August 2011.

MAY 2020 REAL ASSETS PERFORMANCE (%)
Sources: Alerian, Bloomberg L.P., EPRA, FTSE International Limited, Intercontinental Exchange, Inc., MSCI Inc., National Association of Real Estate Investment Trusts, Standard & Poor’s, and Thomson Reuters Datastream. MSCI data provided “as is” without any express or implied warranties.
Notes: Total return data for all MSCI indexes are net of dividend taxes. Gold performance based on spot price return.
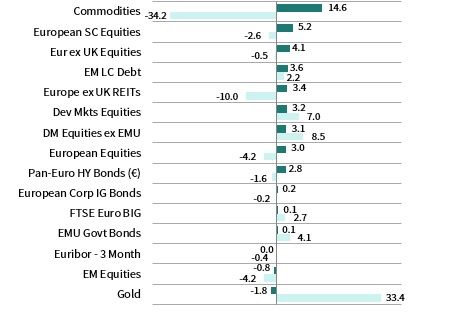
USD-Based Investors
Commodities led performance by a wide margin as crude oil prices rebounded, but they remain a significant laggard over the past year. Investors looked past the current dire economic situation and mounting geopolitical risks, instead pricing in the eventual return to growth post-COVID.
US small caps outperformed among equities for the second consecutive month, while emerging markets equities lagged despite a weakening US dollar. High-yield and investment grade corporate bonds advanced and credit spreads narrowed as the Fed initiated corporate bond ETF purchases. Gold prices continued climbing amid continued macro uncertainty and a declining US dollar, bringing trailing 12-month performance to multi-year highs.
The US dollar generally depreciated but gained versus UK sterling and the Japanese yen; the greenback fell the most versus the euro and commodity-sensitive currencies, including an equal-weighted basket of EM currencies and the Australian dollar. Despite recent weakness, the US dollar has mostly appreciated over the past year, declining only vis-à-vis the safe-haven Swiss franc and Japanese yen.
US stocks continued climbing, defying deteriorating economic and earnings data, which pushed absolute and relative valuations to multi-year highs. The US economy shed 20.5 million jobs in April, lifting the unemployment rate to 14.7%. Labor market pain contributed to record declines in consumer spending and retail sales, in addition to falling prices.
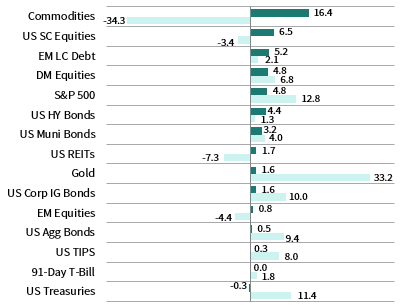
INDEX PERFORMANCE (US$)

US DOLLAR PERFORMANCE VS VARIOUS CURRENCIES
Sources: Bloomberg Index Services Limited, FTSE International Limited, Frank Russell Company, Intercontinental Exchange, Inc., J.P. Morgan Securities, Inc., MSCI Inc., National Association of Real Estate Investment Trusts, Standard & Poor’s, and Thomson Reuters Datastream. MSCI data provided “as is” without any express or implied warranties.
EUR-Based Investors
Risk assets generally advanced in April, as broad equities and real assets outperformed fixed income counterparts. Commodities led performance by a wide margin as crude oil prices rebounded, but they remain a significant laggard over the past year. Investors looked past the current dire economic situation and mounting geopolitical risks, instead pricing in the eventual return to growth post-COVID.
European small caps outperformed among equities, while Europe ex UK equities bested the broader developed index and emerging markets declined. High-yield and investment-grade corporate bonds outperformed EMU sovereigns as core government bond yields rose; however, more peripheral Spanish and Italian government bonds rallied, sending yields lower on the news of the EC’s proposed stimulus package.
The euro broadly advanced in May, appreciating the most versus UK sterling, the Japanese yen, and the US dollar; commodity-sensitive currencies held up better vis-à-vis the common currency. The euro was more mixed over the past year, gaining against commodity-sensitive currencies and the UK sterling, but declining versus the safe-haven Swiss franc, Japanese yen, and US dollar.
European assets received a sentiment boost from the EC’s proposed €750 recovery fund. Still, economic data were particularly weak. Germany entered a technical recession in first quarter, while Eurozone retail sales posted record declines. The euro area labor market held up relatively well in contrast to the United States, due largely to differences in policy transmission.
INDEX PERFORMANCE (€)

EURO PERFROMANCE VS VARIOUS CURRENCIES
Sources: Bloomberg Index Services Limited, EPRA, European Banking Federation, FTSE Fixed Income LLC, FTSE International Limited, ICE Benchmark Administration Ltd., J.P. Morgan Securities, Inc., MSCI Inc., National Association of Real Estate Investment Trusts, Standard & Poor’s, and Thomson Reuters Datastream.
GBP-Based Investors
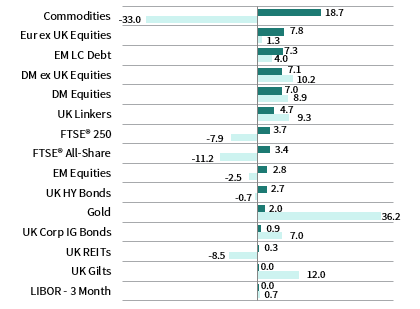
Risk assets gained across the board as equities and real assets generally outperformed fixed income categories. Commodities led performance by a wide margin as crude oil prices rebounded, but they remain a significant laggard over the past year. Investors looked past the current dire economic situation and mounting geopolitical risks, instead pricing in the eventual return to growth post-COVID.
UK and emerging markets stocks underperformed broader developed markets as Europe ex UK shares gained the most among equities. Aggregate UK equities have suffered steeper declines than most major asset classes over the past 12 months. Sterling high-yield and investment-grade corporate bonds outperformed UK gilts as sovereign yields touched new all-time lows. Gold prices continued climbing and have trounced other assets over the past year.
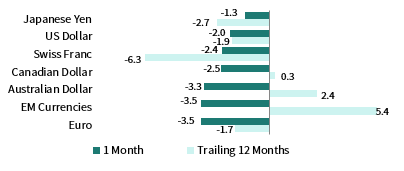
UK sterling declined in May as hard Brexit risks re-emerged and the BOE signaled the potential for negative policy rates. UK sterling fell the most versus the euro and commodity-sensitive currencies, faring better against safe-haven currencies (Japanese yen, US dollar, and Swiss franc). UK sterling is more mixed over the past year, weakening against the euro and safe havens but gaining against commodity-sensitive currencies.
Heightened Brexit risks posed a headwind for UK assets even as officials prepared to reopen the economy. UK and EU negotiators failed to make progress on the future trading relationship, raising the odds of a hard-Brexit outcome. GDP contracted at the fastest clip on record in March, reflecting COVID-19 containment measures.
INDEX PERFORMANCE (£)
POUND STERLING PERFORMANCE VS VARIOUS CURRENCIES
Sources: Bloomberg Index Services Limited, EPRA, FTSE International Limited, Intercontinental Exchange, Inc., ICE Benchmark Administration Ltd., J.P. Morgan Securities, Inc., MSCI Inc., National Association of Real Estate Investment Trusts, Standard & Poor’s, and Thomson Reuters Datastream.
Performance Exhibits
All data are total returns unless otherwise noted. Total return data for all MSCI indexes are net of dividend taxes.
USD-Based Investors index performance chart includes performance for the Bloomberg Barclays US Aggregate Bond, Bloomberg Barclays US Corporate Investment Grade, Bloomberg Barclays US High Yield Bond, Bloomberg Barclays Municipal Bond, Bloomberg Barclays US TIPS, Bloomberg Barclays US Treasuries, ICE BofAML 91-Day Treasury Bills, FTSE® NAREIT All Equity REITs, J.P. Morgan GBI-EM Global Diversified, LBMA Gold Price, MSCI Emerging Markets, MSCI World, Russell 2000®, S&P 500, and S&P GSCI™ indexes.
EUR-Based Investors index performance chart includes performance for the Bloomberg Barclays Euro-Aggregate: Corporate, Bloomberg Barclays Pan-Euro High Yield (Euro), EURIBOR 3M, FTSE EMU Govt Bonds, FTSE Euro Broad Investment-Grade Bonds, FTSE® EPRA/NAREIT Europe ex UK RE, J.P. Morgan GBI-EM Global Diversified, LBMA Gold Price AM, MSCI Emerging Markets, MSCI Europe, MSCI Europe ex UK, MSCI Europe Small-Cap, MSCI World ex EMU, MSCI World, and S&P GSCI™ indexes.
GBP-Based Investors index performance chart includes performance for the Bloomberg Barclays Sterling Aggregate: Corporate Bond, Bloomberg Barclays Sterling Index-Linked Gilts, ICE BofAML Sterling High Yield, FTSE® 250, FTSE® All-Share, FTSE® British Government All Stocks, FTSE® EPRA/NAREIT UK RE, J.P. Morgan GBI-EM Global Diversified, LBMA Gold Price AM, LIBOR 3M GBP, MSCI Emerging Markets, MSCI Europe ex UK, MSCI World, MSCI World ex UK, and S&P GSCI™ indexes.
EM currencies is an equal-weighted basket of 20 emerging markets currencies.
Fixed Income Performance Table
Performance data for US TIPS reflect the Bloomberg Barclays US TIPS Index, with yields represented by the Bloomberg Barclays Global Inflation Linked Bond Index: US.