Global risk assets sold off in May and bond yields sank to multi-year lows as escalating trade tensions heightened uncertainty regarding the global growth outlook. Equities ended the month squarely in the red as developed markets stocks outpaced emerging equivalents; however, major equity markets maintained positive gains year-to-date. Growth stocks led value counterparts, while large caps bested small caps. Global government bonds gained, outperforming investment-grade and high-yield corporates as credit spreads widened. Most real assets categories fell, whereas REITs performance was mixed among regions. The US dollar mostly appreciated, the euro was mixed, and UK sterling weakened; the safe-haven Japanese yen and Swiss franc were broadly stronger.
US-China relations deteriorated in May, jolting global equities as risk-off sentiment and tightening financial conditions permeated capital markets. Ongoing trade negotiations, which had shown signs of progress in recent months, soured in an intensifying series of tariff hikes and punitive measures. The United States raised tariffs on $200 billion of Chinese goods, to which China retaliated with plans to increase levies on $60 billion of US products. Tensions were aggravated further after the Trump administration blacklisted exports to Chinese telecommunications giant Huawei; in response, China prepared its own list of “unreliable” foreign entities identified as damaging local businesses and national interests. Further, China readied plans to restrict exports of rare earth minerals, critical inputs to a variety of electronics. Elsewhere, the United States reached deals with Canada and Mexico to remove steel and aluminum tariffs, clearing a key obstacle toward ratifying a new North American trade deal. However, optimism for an agreement was derailed in late May after the Trump administration threatened to introduce tariffs on all Mexican goods if Mexico fails to take steps to tighten migration controls at the US border. President Trump delayed a decision to impose tariffs on imported cars and auto parts, but proclaimed that some auto imports present a national security threat as the administration sought to maintain leverage in ongoing trade negotiations with the EU and Japan. Bond markets rallied and global yields fell to multi-year lows, coinciding with falling inflation expectations and real rates, leading to the deepest US Treasury yield curve (10-year/3-month) inversion since 2007. Federal Reserve minutes acknowledged increased downside risks to inflation; however, the policy-setting committee viewed recent headwinds to inflation as “transient” and recommitted to a “patient” policy approach. Still, bond market activity during the month stoked fresh fears regarding the economic growth outlook, while futures markets priced in expectations for multiple policy rate cuts this year.
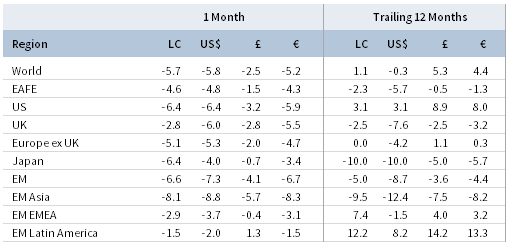
TOTAL RETURN FOR MSCI INDEXES (%)
US equities (-6.4% for the S&P 500 Index) declined and underperformed broader developed markets for the first time this year in USD terms as the US-led trade war intensified. Ten of 11 sectors ended the month in the red, dragged down by energy, information technology, and materials; by contrast, defensive and yield-sensitive sectors such as real estate, utilities, and healthcare fared relatively well. Industry groups vulnerable to trade war tensions, including semiconductors & semiconductor equipment and automobiles & components, significantly underperformed the broader index. Growth stocks outperformed value equivalents for the sixth consecutive month, while large caps bested small caps. First quarter 2019 earnings per share (EPS) growth exceeded analyst expectations, but contracted 0.4% year-over-year, marking the first earnings decline since mid-2016 as profit margins also fell. Currently, analysts are forecasting negative second quarter profit growth, implying US corporates may enter a technical earnings recession in first half 2019. Consumer data sent mixed signals; retail sales and other spending data cooled but showed healthy year-over-year growth, while consumer sentiment and confidence indicators diverged, but remained positive. Industrial production missed expectations in April and declined for the third time this year; year-over-year growth trends slowed to the lowest clip since early 2017. Additionally, manufacturing activity hit the lowest level since 2009 and overall business activity fell to a three-year low, dragged down by an unexpectedly weak read from the services sector.
European equities (-5.5% in USD, -4.9% in EUR, -2.2% in GBP) fell, but outpaced broader developed markets. Europe ex UK stocks outperformed UK equivalents in major currency terms on broad sterling weakness, but underperformed in local currency terms. Data released in May showed that German industrial output grew for the fourth month in a row, in contrast to weak sentiment indicators of late, while private sector activity in France rose to a six-month high. In addition, the German economy rebounded in first quarter, expanding 0.4% quarter-over-quarter on strong private consumption and a booming construction sector. Still, early in the month, the European Commission cut its 2019 German growth outlook for the second time this year to just 0.5%. On the political stage, centrist parties lost their majority in European Parliament elections, while populists gained fewer seats than expected and the Green party surged. Italy’s Northern League party, headed by Deputy Prime Minister Matteo Salvini, gained momentum in the elections, setting the stage for a continued clash over government spending and debt rules enforced by the EU. Bond markets seemed to price in greater risk for Italian government bonds following the election results as the spread between ten-year Italian and German government securities widened to levels last seen during February’s budget negotiations. In the United Kingdom, embattled Prime Minister Theresa May tendered her resignation after years of fractious battles regarding the United Kingdom’s exit from the EU, introducing more uncertainty over the future Brexit process.
Japanese equities (-4.0% in USD, -3.4% in EUR, -0.7% in GBP) outperformed broader developed stocks in major currency terms on yen strength, but underperformed in local terms. Japanese GDP growth in calendar first quarter surprised to the upside, growing at a 2.1% annualized clip; however, underlying growth drivers were less encouraging and pointed to weak overall demand. Exports, capital investment, and private consumption all fell, with exports declining the most since 2015. Imports fell faster than exports, which bolstered net export figures. Core inflation accelerated in April as retailers passed rising costs on to consumers, but the increase may have been overly influenced by temporary factors. Prompted by a fall in its index of economic conditions, Japan’s Cabinet Office cut its assessment of the economic situation from “weakening” to “worsening”—its lowest level on a scale of five different economic conditions—for the first time since January 2013.
Emerging markets equities (-7.3% in USD, -6.7% in EUR, -4.1% in GBP) declined and underperformed developed markets peers for the fourth consecutive month in major currency terms. Among regions, heavily weighted emerging Asia lagged the broader index, while Latin America and emerging Europe, the Middle East & Africa outperformed. Index heavyweight China was the worst-performing emerging country of any size, posting double-digit losses amid the intensifying trade spat with the United States. The Chinese manufacturing sector dipped back into contractionary territory in May as new export orders and employment faltered, the latter hitting the lowest levels since 2009. The Chinese government takeover of Baoshang Bank, the first such rescue in 18 years, also raised questions about the health of China’s financial system. Korea posted a steep decline as data showed that export growth in May fell deeper into negative territory, particularly for semiconductor exports, which make up one-fifth of total shipments. India, Brazil, and Russia posted gains despite broad market turbulence. Indian stocks were boosted as Prime Minister Narendra Modi was effectively re-elected to a second term, whereas Brazilian equity markets gained as investors shook off reports of a first quarter GDP contraction and turned more optimistic over prospects of pension reform. Frontier markets equities (2.2% in USD, 2.7% in EUR, 5.7% in GBP) defied global equity weakness. Argentina, which was promoted to the MSCI Emerging Markets Index after the market close on May 28 (along with Saudi Arabia), was the primary contributor to performance during the month. Kuwait, which also gained in May, now composes more than 30% of the Frontier Markets Index.
Real assets mostly declined amid renewed global economic growth fears. Commodity futures (-3.4% for the Bloomberg Commodity TR Index and -8.2% for the energy-heavy S&P GSCI® Index) declined in aggregate, dragged lower by energy and industrial metals, while agriculture and precious metals gained. Oil prices ($64.49 for Brent and $53.50 for WTI) posted double-digit declines as trade tensions buffeted the global demand outlook and record US production added to inventories, all of which outweighed negative supply dynamics, including attacks on energy infrastructure in the Middle East and continued export declines out of Iran and Venezuela. Global natural resources equities (-8.0% for the MSCI World Natural Resources Index in USD terms) underperformed broader equities, whereas losses for energy MLPs (-1.1% for the Alerian MLP Index) were relatively muted amid declining global yields. Global REITs were mixed; Europe ex UK REITs (2.0%) and US REITs (0.6%) gained, while UK REITs (-3.1%) and developed Asian REITs (-0.2% in USD terms) declined. Gold prices (1.3%) advanced as growth concerns and risk-off sentiment sparked safe-haven interest.
Sovereign bonds advanced in May, outperforming equities and riskier credits, as yields touched multi-year lows. US Treasuries (2.4%) notched their best monthly gain since January 2015, outperforming investment-grade (1.4%) and high-yield (-1.2%) corporate bonds as credit spreads expanded the most since fourth quarter 2018. Five- and ten-year Treasury yields fell 35 and 37 basis points (bps) to 1.93% and 2.14%, respectively, the lowest month-end levels since late 2017. Falling longer-term yields led the 10-year/3-month Treasury term spread to invert for the second time this year. UK gilts (2.7%) gained amid increased Brexit uncertainty following Prime Minister Theresa May’s announced resignation and European Parliament election results. Five- and ten-year gilt yields fell 25 and 28 bps to 0.62% and 0.93%, respectively. EMU government bonds (1.1%) also gained as German 10-year bund yields fell to the most negative levels on record, ending the month at -0.20%. US TIPS (1.7%) and tax-exempt municipal bonds (1.4%) also gained, but underperformed nominal Treasuries; declining inflation expectations pushed nominal Treasury performance above inflation-linked counterparts. UK linkers (4.1%) bested nominal gilts as one of the top-performing UK assets.
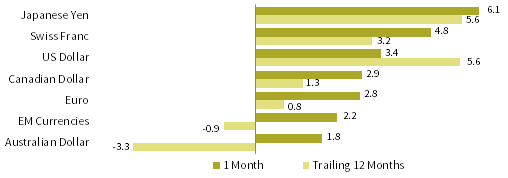
Among major currencies, the US dollar mostly appreciated, the euro was mixed, and UK sterling broadly depreciated, while the safe-haven Japanese yen and Swiss franc advanced. The US dollar gained against all major currencies, save for the Japanese yen and Swiss franc, advancing the most versus the UK sterling, Australian dollar, and our equal-weighted EM currency basket. The dollar strengthened against most currencies over the past year. Euro performance was mixed, gaining vis-à-vis the UK sterling, Australian dollar, and EM currencies, but declining relative to the Japanese yen, Swiss franc, and US dollar. The euro was similarly mixed over the past year. UK sterling depreciated in May against all major currencies, falling the most against the haven Japanese yen, Swiss franc, and US dollar. Sterling gained against only the Australian dollar and EM currencies over the past year. The Mexican peso and Chinese yuan were among the worst-performing EM currencies versus the US dollar, adversely impacted by escalating trade and geopolitical tensions.
Currency Performance as of May 31, 2019
The US dollar appreciated versus most major currencies, gaining the most relative to the UK sterling, Australian dollar, and EM currencies; the exceptions were the safe-haven Japanese yen and Swiss franc. The greenback was broadly stronger over the past year, weakening slightly only against the yen.

VERSUS THE US DOLLAR
Total Return (%)
Euro performance was mixed in May. The common currency gained vis-à-vis the UK sterling, Australian dollar, and EM currencies, but declined the most against the safe-haven Japanese yen, Swiss franc, and US dollar. The euro depreciated the most versus the Japanese yen and US dollar over the past year.

VERSUS THE EURO
Total Return (%)
UK sterling weakened broadly as Prime Minister Theresa May announced her resignation last month, declining the most relative to the Japanese yen, Swiss franc, and US dollar. Likewise, UK sterling was mostly weaker over the past year, appreciating against only the Australian dollar and EM currencies.
VERSUS THE POUND STERLING
Total Return (%)
Note: EM currencies is an equal-weighted basket of 20 currencies.
USD Market Performance as of May 31, 2019
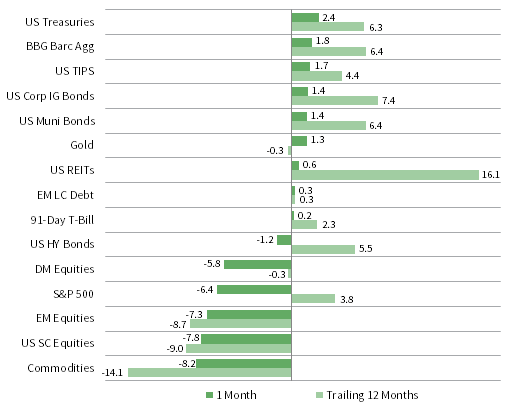
Treasuries and investment-grade corporates outperformed; by contrast, riskier high-yield bonds declined. US large caps underperformed developed counterparts, but outpaced domestic small caps and emerging markets. Commodities declined the most, whereas US REITs and gold finished in the black.
INDEX PERFORMANCE (US$)
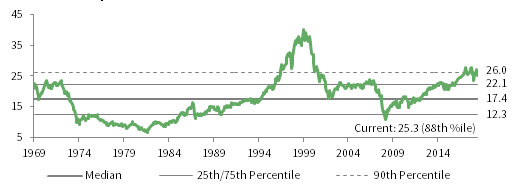
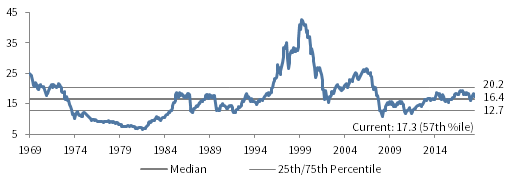
COMPOSITE NORMALIZED P/E: MSCI US
December 31, 1969 – May 31, 2019
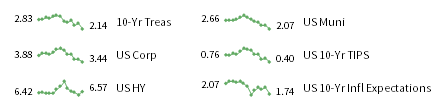
FIXED INCOME YIELDS
May 2018 – May 2019
Sources: Bloomberg Index Services Limited, Bloomberg L.P., BofA Merill Lynch, FTSE International Limited, Frank Russell Company, J.P. Morgan Securities, Inc., MSCI Inc., National Association of Real Estate Investment Trusts, Standard & Poor’s, and Thomson Reuters Datastream. MSCI data provided “as is” without any express or implied warranties.
Euro Market Performance as of May 31, 2019
Real assets diverged in May; Europe ex UK REITs posted the strongest gains for the month, and gold advanced while commodities lagged. EMU sovereigns and investment-grade bonds outperformed high-yield equivalents. European equities outpaced broader developed and emerging stocks, while European small caps lagged.

INDEX PERFORMANCE (€)
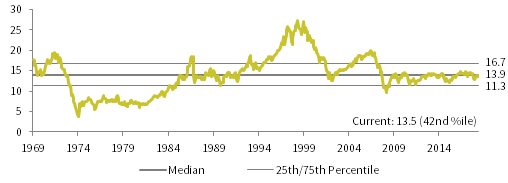
COMPOSITE NORMALIZED P/E: MSCI EUROPE EX UK
December 31, 1969 – May 31, 2019
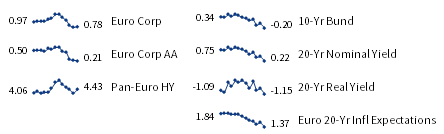
FIXED INCOME YIELDS
May 2018 – May 2019
Sources: Bloomberg Index Services Limited, Bloomberg L.P., EPRA, FTSE Fixed Income LLC, FTSE International Limited, J.P. Morgan Securities, Inc., MSCI Inc., National Association of Real Estate Investment Trusts, Standard & Poor’s, and Thomson Reuters Datastream. MSCI data provided “as is” without any express or implied warranties.
GBP Market Performance as of May 31, 2019
UK linkers gained the most, outperforming nominal gilts and investment-grade corporates; UK high-yield bonds declined. UK equities declined and underperformed developed counterparts. UK REITs performed roughly on par with domestic equities, while gold advanced and commodities declined the most.

INDEX PERFORMANCE (₤)
COMPOSITE NORMALIZED P/E: MSCI UK
December 31, 1969 – May 31, 2019
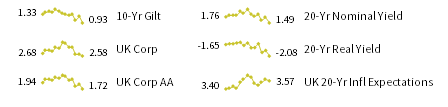
FIXED INCOME YIELDS
May 2018 – May 2019
Sources: Bloomberg Index Services Limited, Bloomberg L.P., BofA Merill Lynch, EPRA, FTSE International Limited, J.P. Morgan Securities, Inc., MSCI Inc., National Association of Real Estate Investment Trusts, Standard & Poor’s, and Thomson Reuters Datastream. MSCI data provided “as is” without any express or implied warranties.
Exhibit Notes
Performance Exhibits
Total return data for all MSCI indexes are net of dividend taxes.
US dollar index performance chart includes performance for the Bloomberg Barclays Aggregate Bond, Bloomberg Barclays Corporate Investment Grade, Bloomberg Barclays High-Yield Bond, Bloomberg Barclays Municipal Bond, Bloomberg Barclays US TIPS, Bloomberg Barclays US Treasuries, BofA Merrill Lynch 91-Day Treasury Bills, FTSE® NAREIT All Equity REITs, J.P. Morgan ELMI+, J.P. Morgan GBI-EM Global Diversified, MSCI Emerging Markets, MSCI World, Russell 2000®, S&P 500, and S&P GSCI™ indexes.
Euro index performance chart includes performance for the Bloomberg Barclays Euro-Aggregate: Corporate, Bloomberg Barclays Pan-Euro High Yield, Citigroup EMU Govt Bonds, Citigroup Euro Broad Investment-Grade Bonds, Euribor 3-month, FTSE® EPRA/NAREIT Europe ex UK, J.P. Morgan ELMI+, J.P. Morgan GBI-EM Global Diversified, MSCI Emerging Markets, MSCI Europe, MSCI Europe ex UK, MSCI Europe Small-Cap, MSCI World ex EMU, MSCI World, and S&P GSCI™ indexes.
UK sterling index performance chart includes performance for the Bloomberg Barclays Sterling Aggregate: Corporate Bond, BofA Merrill Lynch Sterling High Yield, FTSE® 250, FTSE® All-Share, FTSE® British Government All Stocks, FTSE® British Government Index-Linked All Stocks, FTSE® EPRA/NAREIT UK RE, J.P. Morgan ELMI+, J.P. Morgan GBI-EM Global Diversified, LIBOR 3M GBP, MSCI Emerging Markets, MSCI Europe ex UK, MSCI World, MSCI World ex UK, and S&P GSCI™ indexes.
Valuation Exhibits
The composite normalized P/E ratio is calculated by dividing the inflation-adjusted index price by the simple average of three normalized earnings metrics: ten-year average real earnings (i.e., Shiller earnings), trend-line earnings, and return on equity–adjusted earnings. We have removed the bubble years 1998–2000 from our mean and standard deviation calculations. All data are monthly.
Fixed Income Yields
US fixed income yields reflect Bloomberg Barclays Municipal Bond Index, Bloomberg Barclays US Corporate High Yield Bond Index, Bloomberg Barclays US Corporate Investment-Grade Bond Index, and the ten-year Treasury.
European fixed income yields reflect the BofA Merrill Lynch Euro Corporate AA Bond Index, BofA Merrill Lynch Euro Corporate Bond Index, Bloomberg Barclays Pan-European Aggregate High Yield Bond Index, Bloomberg Twenty-Year European Government Bond Index (nominal), ten-year German bund, 20-year European Inflation Swaps (inflation expectations), and the real yield calculated as the difference between the inflation expectation and nominal yield.
UK sterling fixed income yields reflect the ICE BofAML Sterling Corporate AA Bond Index, ICE BofAML Sterling Corporate Bond Index, UK ten-year gilts, Bank of England 20-year nominal yields, and Bloomberg Generic UK 20-year inflation-linked (real) yields.