Capital markets performance during May was mixed, impacted by a number of important geopolitical developments. Global equities advanced—driven mostly by gains in the United States, as developed ex US equities and emerging markets stocks declined. Global small caps bested large caps, growth equities outperformed value counterparts, and information technology was by far the best-performing sector. Major developed markets government bond yields declined, reversing course from multi-year highs reached mid-month, and credit spreads widened as investors sought safe havens and reduced risk exposures. Rising commodity prices contributed to strong real assets performance, and returns for developed REITs continued to rebound from losses suffered earlier in the year. Among currencies, the US dollar enjoyed broad strength on a flight to safety, while the euro and UK sterling declined against all major currencies we track, except each was flat relative to the other.
The reappearance earlier in 2018 of a more typical market volatility regime persisted in May, as geopolitical risks to the bull market cycle returned to the fore, somewhat overshadowing signs confirming ongoing above-trend economic growth after a soft patch in first quarter and continued robust corporate results across the major regions. Several market-moving decisions were made by the Trump administration, including pulling the United States out of the Joint Comprehensive Plan of Action (JCPOA) and re-imposing economic sanctions against Iran; reinstating previously announced trade tariffs on Chinese imports; ending temporary exemptions for major US allies from steel and aluminum tariffs; and investigating whether certain automobile imports present risks to national security. Aside from US policy developments, Italy nearly descended into a constitutional crisis as repeated unsuccessful efforts by two anti-establishment parties to form a government threatened new elections that would risk consolidating their power and potentially harm Eurozone cohesion. An apparent breakthrough allowing a new government to be formed and avoiding another election was only announced on the last day of the month after European markets had closed. Elsewhere, Turkey and Argentina are facing currency crises as rising US interest rates and the related USD rally, which have recently pressured emerging and frontier markets assets more broadly, have put both countries’ outsized external funding needs under the microscope. Finally, soaring oil prices as a result of the deteriorating economic crisis in Venezuela disrupting oil production, combined with heightened Middle East tensions created by the US withdrawal from the Iran nuclear deal and subsequent military action between bitter rivals Israel and Iran (and its regional proxies), prompted OPEC and Russia to publicly contemplate raising oil production in an attempt to stabilize prices.
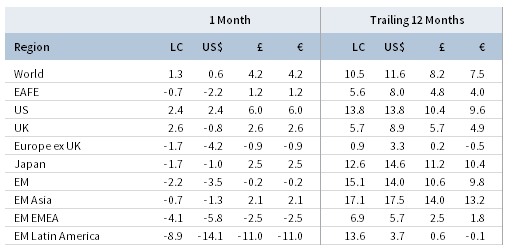
TOTAL RETURN FOR MSCI INDEXES (%)
US equities (2.4% for the S&P 500 Index) advanced, despite increased geopolitical uncertainty and fluid foreign policy posturing by the Trump administration, and are now up year-to-date. Small caps outperformed large caps—a reversal from 2017 and early 2018—due in part to strong first quarter results and higher full-year 2018 earnings growth estimates, as well as their more domestic focus in light of the dollar rally and recent tax cuts, and growth stocks outpaced value counterparts after trailing the previous two months. Seven of 11 S&P 500 sectors gained, led by information technology, energy, and industrials; in contrast telecommunication services, consumer staples, utilities, and financials all declined amid rising interest rates. First quarter earnings exceeded earlier estimates and are now projected to grow 25% year-over-year—the highest since 2010—led by energy, materials, information technology, and financials. All 11 sectors reported higher-than-expected earnings growth rates for first quarter, fewer companies downgraded results guidance for second quarter (relative to the five-year average), and sell-side analysts have actually slightly upgraded second quarter estimates, something that has rarely occurred this cycle. Underlying economic fundamentals also remained strong in May as the unemployment rate ticked down to an 18-year low, sturdy manufacturing data improved more than expected, and job creation beat expectations. Headline inflation increased to 2.5%, but Federal Reserve policymakers appeared more dovish in their deliberations last month, keeping interest rates steady and signaling a willingness to tolerate temporary inflation above its 2% target.
European equities (-3.3% in USD, 0.1% in EUR, and 0.1% in GBP) underperformed developed markets peers despite healthy first quarter earnings growth estimated at 10% year-over-year. Equity performance within the region was notably mixed as pound sterling weakness and higher commodity prices boosted UK equities, while Europe ex UK and EMU stocks were knocked lower by political turmoil in Italy, where President Sergio Mattarella initially blocked the formation of a government between anti-establishment Five Star Movement and far-right League over their selection of a controversial anti-euro finance minister. Markets were further roiled late in the month by President Mattarella’s decision to temporarily assign a technocrat and former IMF official as prime minister to lead the country until a government could be formed or new elections could take place, a move seen as potentially strengthening anti-EU sentiment in the Eurozone’s third largest economy and threatening a constitutional crisis. An agreement to form a government was ultimately reached between Five Star and the League at the end of the month and approved by Mattarella, but the deal came too late to affect May performance. Underlying fundamentals in the Eurozone were mixed as retail sales and consumer confidence weakened and a revised first quarter GDP growth estimate matched expectations, confirming a cold weather–related slowdown; however, flash estimates indicated May inflation was closer to the European Central Bank’s long-term 2% target than the market expected. Also, though Eurozone purchasing manager indexes (PMIs) of business activity and sentiment continued to fall from records set last year, they remain well in expansion territory and suggest the region’s economic growth remains above potential. UK inflation ticked down, and estimated first quarter GDP growth was revised lower but matched expectations, affirming the Bank of England’s decision earlier in the month to refrain from raising interest rates after Governor Mark Carney in April suggested future rate hikes are not a foregone conclusion.
Japanese equities (-1.0% in USD, 2.5% in EUR, and 2.5% in GBP) underperformed developed markets peers despite broad yen strength boosting returns in foreign currencies. Corporate earnings in calendar first quarter 2018 are now estimated to have grown at 11% year-over-year, which would be the sixth consecutive quarter of double-digit earnings growth; however, macro fundamentals deteriorated, as estimated first calendar quarter GDP growth was negative after eight consecutive quarters of positive growth, manufacturing PMI was weaker than expected, and inflation declined further below the Bank of Japan’s 2% target. Domestic political risk declined late in the month as prosecutors declined to indict officials in a public land sale scandal that had threatened Prime Minister Shinzo Abe’s administration; however, the finance ministry is set to release its findings from a separate investigation in early June. Trade risks rose as the United States announced possible tariffs on imported automobiles, many of which come from Japan.
Emerging markets equities (-3.5% in USD, -0.2% in EUR, and -0.2% in GBP) underperformed developed markets equivalents for the second consecutive month after outperforming most of 2017 and early 2018 as rising US interest rates, US dollar strength, and heightened geopolitical and trade tensions weighed further on returns. Heavily weighted emerging Asia was the top-performing region and actually gained in EUR and GBP terms despite declining in USD. The other two regions—emerging Europe, the Middle East & Africa and Latin America—suffered losses in all major currency terms. Among large markets, Brazil declined the most as widespread strikes in the trucking and oil industries threatened to bring the economy to a halt. Other steep decliners in major currency terms included Greece and Hungary (two of the smallest markets, which both fell on rising European political instability), Mexico, and Turkey, where sticky inflation led to significant lira depreciation and a substantial emergency interest rate hike. China and Russia were the only markets to gain in all major currency terms. With regard to China, as announced last year, domestically listed Chinese A-shares were included in the major MSCI equity indexes for the first time on June 1—a major development. Upon this year’s initial inclusion, Chinese stocks—still predominantly offshore-listed companies—will compose roughly one-third of the MSCI EM Index, and its weight will be more than twice the next largest country, Korea. Accordingly, EM Asia will be more than 75% of the index. Frontier markets stocks (-9.2% in USD, -6.0% in EUR, and -6.0% in GBP) lagged developed and emerging markets counterparts for the second consecutive month after outperforming in first quarter, dragged down by a steep decline in Argentina (-21.9% in USD terms)—the largest component in the MSCI Frontier Markets Index—as the Argentine peso declined 17.8% against the USD in May, threatening a currency crisis.
Real assets broadly gained in May for the second month in a row, supported by rising commodity prices. Commodity futures advanced (1.4% for the Bloomberg Commodity TR Index and 1.4% for the energy-heavy S&P GSCI™ Index), notably in spite of broad USD strength, as gains in energy, industrial metals, and livestock buoyed returns. The spread in oil prices (ending at $77.59 for Brent and $67.04 for WTI) between the two most widely cited benchmarks widened the most since early 2015. Brent prices touched above $80 per barrel mid-month for the first time in nearly four years on threats to global supply from both Venezuela’s worsening economic crisis and the US unilaterally re-imposing economic sanctions on Iran, but finished below that mark as Saudi Arabia and Russia discussed a potential deal to boost production. Meanwhile, a surprise increase of US oil inventories amid surging shale production drove WTI prices down. Energy MLPs (5.0%) and global natural resources equities (2.0% for the MSCI World Natural Resources Index in USD terms) benefitted from the commodity rally and outperformed most asset classes for the month. Developed markets REITs (1.8% in USD terms) rebounded further, also beating global equities and bonds; US REITs (3.6%) and Europe ex UK REITs (1.3%) advanced on the decline in long-term bond yields, which were insufficient to prevent modest losses for UK REITs (-0.5%) as a result of weaker than expected domestic growth. Gold (-0.7%) declined in USD terms to $1,304.08/troy ounce in response to dollar strength and is now flat year-to-date.
US Treasuries (0.9%) strengthened despite better economic performance, pushed higher by a flight to safety resulting from political uncertainty in Italy, which drove a decline in EMU government bonds (-1.2%), and rising geopolitical risk in the Middle East and Asia. After initially steepening, yield curves reversed course mid-month, flattening across major developed economies as long-term rates declined amid safe haven demand and short-term rates rose. The ten-year US Treasury yield backed up as high as 3.11% mid-month—its highest level since July 2011—but fell 28 basis points (bps) in the final two weeks to end the month at 2.83%, down 12 bps in May; five-year yields fell 11 bps to end at 2.68%. Five- and ten-year UK gilt yields declined 17 bps and 18 bps to end the month at 0.88% and 1.33%, respectively. US credit spreads widened as Treasuries outperformed US investment-grade corporate bonds (0.5%) and US high-yield bonds (0.0%). US tax-exempt bonds (1.1%) outgained taxable equivalents. US TIPS (0.4%) underperformed nominal counterparts; in contrast, UK linkers (2.4%) outgained nominal gilts (1.8%).
Among major currencies, the US dollar rallied amid a flight to safety, while the euro and UK sterling depreciated. The greenback appreciated against the UK sterling, the euro, our equal-weighted EM currency basket, and the Canadian dollar, but declined against the Australian dollar and the other safe havens, the Japanese yen and the Swiss franc. The euro and UK sterling were flat against one another but declined against all other major currencies, particularly the yen and the Swiss franc. EM currencies were hit particularly hard last month with all but the Russian ruble and Indonesian rupiah falling versus USD; the Turkish lira fell over 10% in May alone and is down 22% in the past year. The Brazilian real and the Mexican peso were the worst-performing major EM currencies as both were hurt by negative political developments.
Market Exhibits
Currency Performance as of May 31, 2018
The US dollar rallied in May, particularly relative to the UK sterling, the euro, and EM currencies; the main exceptions were fellow safe havens Swiss franc and Japanese yen. Despite its recent rebound, the greenback remains lower over the trailing 12 months, except against the Swiss franc and our EM currency basket.
VERSUS THE US DOLLAR
Total Return (%)
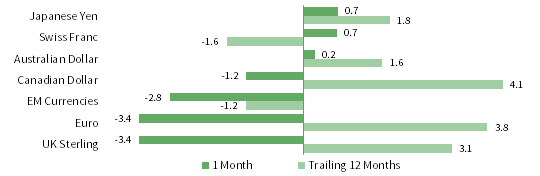
The euro was broadly weaker last month amid elevated geopolitical risk, including the political crisis in Italy, as investors sought safe havens and rising spot prices supported the major commodity currencies—Australian dollar and Canadian dollar. Still, the common currency enjoyed broad strength over the past year.

VERSUS THE EURO
Total Return (%)
The UK sterling weakened alongside the euro, against which the pound was roughly flat in May, and similarly fell versus the major developed markets currencies we track as well as our EM currency basket. The sterling rallied over the trailing 12 months with the exception of the euro and Canadian dollar
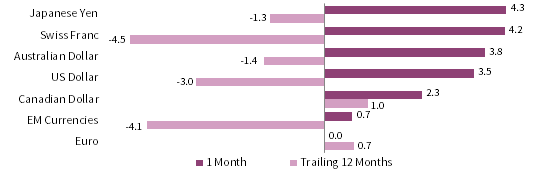
VERSUS THE POUND STERLING
Total Return (%)
Sources: MSCI Inc. and Thomson Reuters Datastream. MSCI data provided “as is” without any express or implied warranties.
Note: EM currencies is an equal-weighted basket of 20 currencies.
USD Market Performance as of May 31, 2018
US small caps and US REITs rallied, leading gains in May. As they have over the trailing 12 months, broad US equities outpaced DM and EM equivalents, which retreated last month. Bond returns were also mostly positive, led by US tax-exempt bonds. Commodities gained and topped performance over the past year.

INDEX PERFORMANCE (US$)
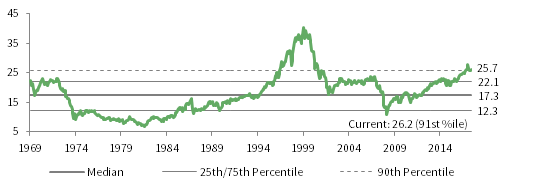
COMPOSITE NORMALIZED P/E: MSCI US
December 31, 1969 – May 31, 2018

FIXED INCOME YIELDS
May 2017 – May 2018
Sources: Barclays, Bloomberg L.P., BofA Merill Lynch, FTSE International Limited, Frank Russell Company, J.P. Morgan Securities, Inc., MSCI Inc., National Association of Real Estate Investment Trusts, Standard & Poor’s, and Thomson Reuters Datastream. MSCI data provided “as is” without any express or implied warranties.
Euro Market Performance as of May 31, 2018
Commodities and DM ex EMU equities led returns in May, outperforming broad European equities, which were barely positive. EM equities declined slightly but gained more than DM stocks over the past year. European bonds also fell last month as core EMU bond gains could not offset steep Italian debt losses.
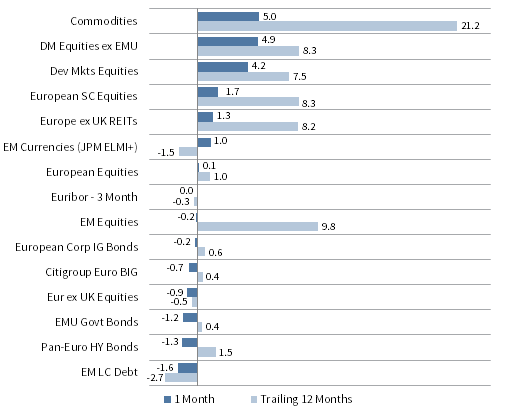
INDEX PERFORMANCE (€)
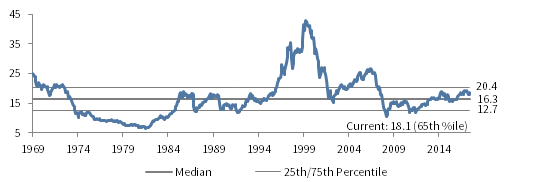
COMPOSITE NORMALIZED P/E: MSCI EUROPE EX UK
December 31, 1969 – May 31, 2018
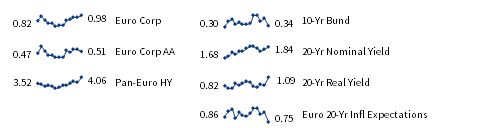
FIXED INCOME YIELDS
May 2017 – May 2018
Sources: Barclays, Bloomberg L.P., Citigroup Global Markets, EPRA, FTSE International Limited, J.P. Morgan Securities, Inc., MSCI Inc., National Association of Real Estate Investment Trusts, Standard & Poor’s, and Thomson Reuters Datastream. MSCI data provided “as is” without any express or implied warranties.
GBP Market Performance as of May 31, 2018
Commodities and DM ex UK equities rallied last month, outperforming UK assets, although UK equities, linkers, and investment-grade bonds advanced. EM local currency debt led declines and was also the worst performer over the trailing 12 months. EM equities were down slightly but outperformed in the last year.
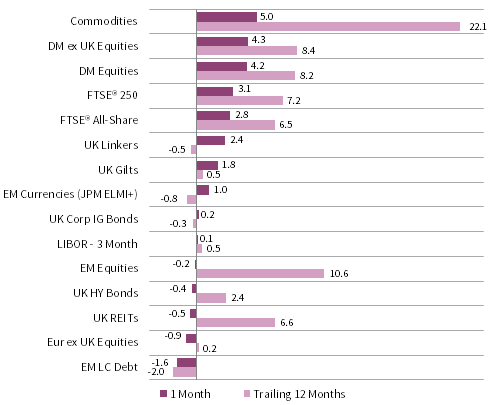
INDEX PERFORMANCE (₤)

COMPOSITE NORMALIZED P/E: MSCI UK
December 31, 1969 – May 31, 2018

FIXED INCOME YIELDS
May 2017 – May 2018
Sources: Barclays, Bloomberg L.P., BofA Merill Lynch, EPRA, FTSE International Limited, J.P. Morgan Securities, Inc., MSCI Inc., National Association of Real Estate Investment Trusts, Standard & Poor’s, and Thomson Reuters Datastream. MSCI data provided “as is” without any express or implied warranties.
Exhibit Notes
Performance Exhibits
Total return data for all MSCI indexes are net of dividend taxes.
US dollar index performance chart includes performance for the Bloomberg Barclays Aggregate Bond, Bloomberg Barclays Corporate Investment Grade, Bloomberg Barclays High-Yield Bond, Bloomberg Barclays Municipal Bond, Bloomberg Barclays US TIPS, Bloomberg Barclays US Treasuries, BofA Merrill Lynch 91-Day Treasury Bills, FTSE® NAREIT All Equity REITs, J.P. Morgan ELMI+, J.P. Morgan GBI-EM Global Diversified, MSCI Emerging Markets, MSCI World, Russell 2000®, S&P 500, and S&P GSCI™ indexes.
Euro index performance chart includes performance for the Bloomberg Barclays Euro-Aggregate: Corporate, Bloomberg Barclays Pan-Euro High Yield, Citigroup EMU Govt Bonds, Citigroup Euro Broad Investment-Grade Bonds, Euribor 3-month, FTSE® EPRA/NAREIT Europe ex UK, J.P. Morgan ELMI+, J.P. Morgan GBI-EM Global Diversified, MSCI Emerging Markets, MSCI Europe, MSCI Europe ex UK, MSCI Europe Small-Cap, MSCI World ex EMU, MSCI World, and S&P GSCI™ indexes.
UK sterling index performance chart includes performance for the Bloomberg Barclays Sterling Aggregate: Corporate Bond, BofA Merrill Lynch Sterling High Yield, FTSE® 250, FTSE® All-Share, FTSE® British Government All Stocks, FTSE® British Government Index-Linked All Stocks, FTSE® EPRA/NAREIT UK RE, J.P. Morgan ELMI+, J.P. Morgan GBI-EM Global Diversified, LIBOR 3M GBP, MSCI Emerging Markets, MSCI Europe ex UK, MSCI World, MSCI World ex UK, and S&P GSCI™ indexes.
Valuation Exhibits
The composite normalized P/E ratio is calculated by dividing the inflation-adjusted index price by the simple average of three normalized earnings metrics: ten-year average real earnings (i.e., Shiller earnings), trend-line earnings, and return on equity–adjusted earnings. We have removed the bubble years 1998–2000 from our mean and standard deviation calculations. All data are monthly.
Fixed Income Yields
US fixed income yields reflect Bloomberg Barclays Municipal Bond Index, Bloomberg Barclays US Corporate High Yield Bond Index, Bloomberg Barclays US Corporate Investment-Grade Bond Index, and the ten-year Treasury.
European fixed income yields reflect the BofA Merrill Lynch Euro Corporate AA Bond Index, BofA Merrill Lynch Euro Corporate Bond Index, Bloomberg Barclays Pan-European Aggregate High Yield Bond Index, Bloomberg Twenty-Year European Government Bond Index (nominal), ten-year German bund, 20-year European Inflation Swaps (inflation expectations), and the real yield calculated as the difference between the inflation expectation and nominal yield.
UK sterling fixed income yields reflect the BofA Merrill Lynch Sterling Corporate AA Bond Index, BofA Merrill Lynch Sterling Corporate Bond Index, UK ten-year gilts, Bank of England 20-year nominal yields, and Bloomberg Generic UK 20-year inflation-linked (real) yields. Current UK 20-yr nominal yield data are as of May 30, 2018.