Capital markets performance was generally positive in May, with France’s market-friendly presidential election outcome and the stronger-than-anticipated earnings results observed across regions serving as important drivers. Several recent trends continued as global equities advanced further, led by growth stocks and emerging markets, which outperformed developed markets equivalents despite US and UK equities closing near record highs set during the month. Returns for global investment-grade bonds were positive and corporate bonds continued to outperform sovereigns, but fixed incomes gains were more muted relative to equities in most markets. Real assets continued to underperform, as most categories declined with commodity prices despite a weaker US dollar, which reached a new seven-month low.
In recent months, markets have experienced a sizeable reversal in many of the so-called “Trump trades” that drove performance in the weeks following the election. It appears that investors either have dialed back their conviction in what policy initiatives the new US administration can practically accomplish or, at the very least, have realized it will take considerably longer to enact any meaningful policy reforms. The corollary is that fiscal policy appears to pose a lower risk of forcing the US Federal Reserve to tighten policy more aggressively than the gradual pace of normalization that the FOMC prefers. As a result, US Treasury yields have fallen to the low end of their post-election range, and equity market leadership has rotated back toward secular growth stocks and bond proxies, and away from the cyclical value plays that surged ahead in the immediate aftermath of the election. US small caps are now substantially trailing large caps; US equities have underperformed developed ex US and emerging markets equivalents; and the US dollar has weakened, particularly against emerging markets currencies like the Mexican peso, which found itself in the crosshairs of Trump’s protectionist leanings.
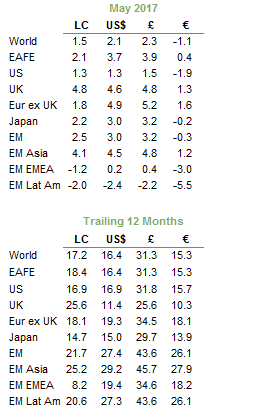
Total Return for MSCI Indexes (%)
US equities (1.4% for the S&P 500) benefitted from the strongest earnings growth since third quarter 2011. The S&P 500 recorded another all-time high but failed to outperform global counterparts for the third month in a row due to high US equity valuations (the Composite Normalized P/E for the MSCI US Index ended May in the 90th percentile) and even stronger earnings growth outside the United States. Still, US earnings grew 14% year-over-year in the first quarter, above market expectations, and representing the third consecutive quarter of positive earnings growth. One key driver of strong earnings was accelerating overseas growth. According to FactSet, companies with less than 50% revenue exposure to the United States (thus more globally exposed) grew earnings an estimated 21% versus only about 10% growth for those with greater than 50% of revenue derived in the United States. Focusing on sectors, energy was the strongest contributor to earnings growth in the first quarter, yet deteriorating sentiment resulting from the sharp drop in crude prices following the OPEC meeting meant energy (-3.4%) was the worst performing sector followed by financials (-1.2%). Information technology stocks continued to outperform, returning 4.4% in May and 20.5% year-to-date.
European equities advanced, reflecting accelerating earnings growth, decreased political risk following the French presidential run-off, and generally stronger than anticipated economic data. UK (4.4% for the FTSE® All-Share) stocks outperformed other developed regions in May in local currency terms as UK large caps benefitted from a weaker pound. Europe ex UK (1.8%) and Eurozone (1.6%) equities also advanced, with even better performance in other currencies given euro strength. This performance reflected the strongest earnings growth in nearly seven years in Europe. Most of Europe’s gains were accumulated earlier in the month as equities rallied following Emmanuel Macron’s win over anti-EU candidate Marine Le Pen in France’s presidential election. Strong economic data also contributed to market sentiment, as Eurozone unemployment fell to its lowest level since 2009 and GDP growth was in line with expectations. Yet, despite stronger economic data, the European Central Bank (ECB) President Mario Draghi emphasized the Eurozone’s continued need for monetary support during remarks made on May 29.
Japanese equities (2.2%) outperformed following the strong earnings growth in the first quarter. Breaking out earnings data by sector, stocks in the materials, information technology, and industrials sectors reported the fastest year-over-year earnings growth, while earnings declined in the utilities, financials, and telecom sectors. The earnings growth was supported by the fifth straight quarter of GDP growth in Japan, accelerated global growth, and yen weakness. Top line sales growth was also positive following several quarters of declines.
Emerging markets equities outperformed developed markets counterparts, returning 3.0% and 3.2% in USD and GBP terms, respectively, though euro investors experienced losses of 0.3%. By region, emerging Asia outperformed, while emerging Europe, the Middle East & Africa and Latin America lagged the broader index. Chinese equities returned 5.4% following Moody’s decision to downgrade the country’s credit rating, the first since 1989. Moody’s attributed this downgrade to fears that growth will slow in the coming years. Latin America took a hit from Brazil, as equities sold off following the news of President Michel Temer allegedly bribing former house speaker Eduardo Cunha, triggering talk of impeachment. In emerging Europe, negotiations between Germany, Greece, and the IMF over the $7 billion of Greek debt due in July broke up without resolution.
Real assets underperformed in May with most categories suffering losses. Commodity futures declined (-1.3% for the Bloomberg Commodity TR Index and -1.5% for the energy-heavy S&P GSCI™) as losses in the energy, agriculture, and industrial metals sectors weighed on returns. Crude prices rose in the days leading up to the May 25 OPEC announcement to extend their current oil production limit for nine months. However, following the announcement, Brent crude oil prices fell 4.6%, the third largest one-day drop of the year, and Brent and WTI concluded the month down 2.7% and 2.0% at $50.31 and $48.32, respectively. Commodity price declines also drove losses in global natural resources equities (-1.4% for the MSCI World Natural Resources Index in USD terms) and energy MLPs (-4.5%). Gold was flat, ending the month at $1,267.97/troy ounce, but has returned 9.5% year-to-date. Global developed REITs (0.9%) were the exception to the declines, mostly due to strong gains in Europe ex UK REITs (5.0%); US REITs (-0.1%) and UK REITs (-0.4%) experienced slight declines.
Global developed markets government bonds advanced again in May as yields fell in several major markets. US Treasuries (0.7%) outperformed EMU government bonds (0.6%) and UK gilts (0.5%). US Treasury yields are now near their post-election lows, and year-to-date returns have surpassed gilts. Yields for five- and ten-year Treasuries fell 6 basis points (bps) and 8 bps to 1.75% and 2.21%, respectively. Similarly, five- and ten-year gilt yields each fell 5 bps to 0.36% and 0.97%, respectively. US tax-exempt bonds (1.6%) outperformed Treasuries. Corporate credit spreads continued to tighten as US investment-grade corporate bonds (1.1%) and US high-yield bonds (0.9%) also outperformed. Inflation-linked bonds underperformed nominal equivalents; US TIPS were flat and UK index-linked gilts (-1.7%) declined.
The trade-weighted US dollar index reached a seven-month low in May as the greenback retreated against the euro, Swiss franc, Canadian dollar, our basket of EM currencies, and the Japanese yen. The dollar strengthened vis-à-vis the Australian dollar and the British pound, which weakened against nearly all major currencies, reflecting greater uncertainty around upcoming general elections as recent polls showed the Conservatives’ lead shrinking. The euro strengthened across the board as political risk waned following Emmanuel Macron’s win in the French presidential election. However, recent euro strength could be short lived given dovish remarks by ECB President Mario Draghi and renewed concern over Greece’s debt burden.
Market Exhibits
Currency Performance
The dollar remained soft in May, with the DXY Index reaching a new seven-month low. The greenback weakened vis-à-vis the euro, Swiss franc, Canadian dollar, our EM currency basket, and Japanese yen but slightly strengthened against UK sterling and the Australian dollar
The euro strengthened against all major currencies as political risk abated following Macron’s win in the French election. Over the last 12 months, the common currency is more mixed, having weakened against the Australian dollar, Swiss franc, and our EM currency basket
UK sterling weakness resumed, after briefly strengthening in April, as the pound fell against all major developed markets currencies, with the exception of the Australian dollar. The pound’s drop last month reflected tighter-than-expected margins for the ruling Conservatives in recent polls for the upcoming general elections

Currency Performance
As of May 31, 2017
Note: EM currencies is an equal-weighted basket of 20 currencies.
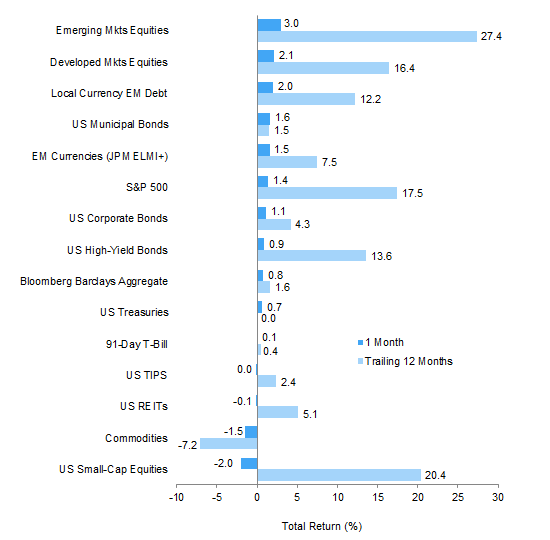
Index Performance (US$)
Emerging markets equities and debt continued their outperformance, supported by a softer US dollar. US municipal bonds beat out US equities and outperformed other fixed income categories. US large-cap stocks outperformed small caps, which declined, but small caps have outperformed all asset classes with the exception of emerging markets equities over the past 12 months
Index Performance (US$)
As of May 31, 2017
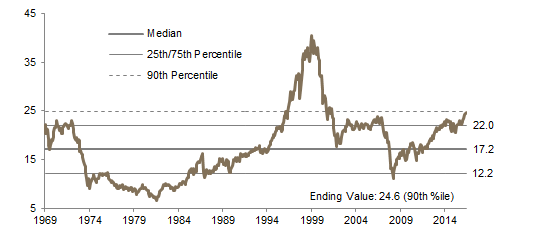
MSCI US Composite Normalized P/E
December 31, 1969 – May 31, 2017

Fixed Income Yields
May 2016 – May 2017
Index Performance (€)
Europe ex UK REITs outperformed European equities, and European large-cap stocks gained more than small caps. European bonds also advanced, but returns were more muted. Continued euro strength was a headwind to returns from outside of the region, with developed markets equities ex EMU and emerging markets equities declining

Index Performance (€)
As of May 31, 2017
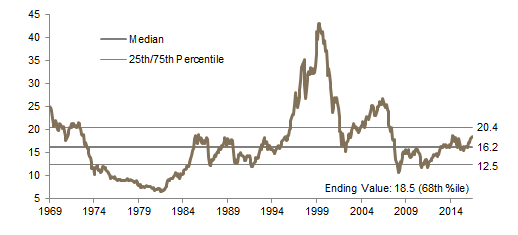
MSCI Europe ex UK Composite Normalized P/E
December 31, 1969 – May 31, 2017

Fixed Income Yields
May 2016 – May 2017
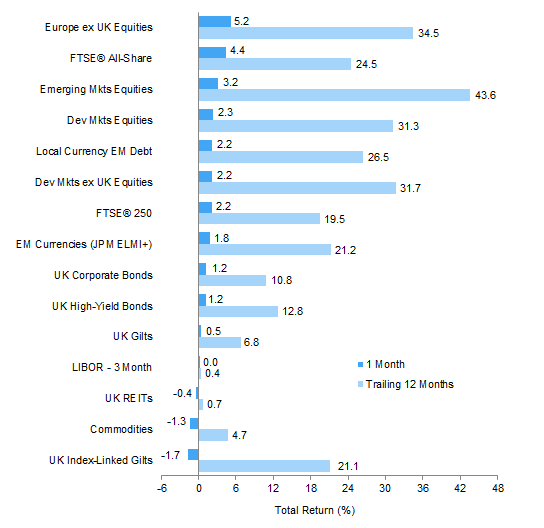
Index Performance (£)
Sterling investors experienced gains in most asset classes as pound weakness was a tailwind to returns. Equities outperformed, led by Europe ex UK. For fixed income, local currency EM debt outperformed UK corporate bonds and gilts. UK REITS, commodities, and inflation-linked gilts all declined
Index Performance (£)
As of May 31, 2017

MSCI UK Composite Normalized P/E
December 31, 1969 – May 31, 2017

Fixed Income Yields
May 2016 – May 2017
Exhibit Notes
Performance Exhibits
Total return data for all MSCI indexes are net of dividend taxes.
US dollar index performance chart includes performance for the Bloomberg Barclays Aggregate Bond, Bloomberg Barclays Corporate Investment Grade, Bloomberg Barclays High-Yield Bond, Bloomberg Barclays Municipal Bond, Bloomberg Barclays US TIPS, Bloomberg Barclays US Treasuries, BofA Merrill Lynch 91-Day Treasury Bills, FTSE® NAREIT All Equity REITs, J.P. Morgan ELMI+, J.P. Morgan GBI-EM Global Diversified, MSCI Emerging Markets, MSCI World, Russell 2000®, S&P 500, and S&P GSCI™ indexes.
Euro index performance chart includes performance for the Bloomberg Barclays Euro-Aggregate: Corporate, Bloomberg Barclays Pan-Euro High Yield, Citigroup EMU Govt Bonds, Citigroup Euro Broad Investment-Grade Bonds, EURIBOR 3M, FTSE® EPRA/NAREIT Europe ex UK, J.P. Morgan ELMI+, J.P. Morgan GBI-EM Global Diversified, MSCI Emerging Markets, MSCI Europe, MSCI Europe ex UK, MSCI Europe Small-Cap, MSCI World ex EMU, MSCI World, and S&P GSCI™ indexes.
UK sterling index performance chart includes performance for the Bloomberg Barclays Sterling Aggregate: Corporate Bond, BofA Merrill Lynch Sterling High Yield, FTSE® 250, FTSE® All-Share, FTSE® British Government All Stocks, FTSE® British Government Index-Linked All Stocks, FTSE® EPRA/NAREIT UK RE, J.P. Morgan ELMI+, J.P. Morgan GBI-EM Global Diversified, LIBOR 3M GBP, MSCI Emerging Markets, MSCI Europe ex UK, MSCI World, MSCI World ex UK, and S&P GSCI™ indexes.
Valuation Exhibits
The composite normalized P/E ratio is calculated by dividing the inflation-adjusted index price by the simple average of three normalized earnings metrics: ten-year average real earnings (i.e., Shiller earnings), trend-line earnings, and return on equity–adjusted earnings. We have removed the bubble years 1998–2000 from our mean and standard deviation calculations. All data are monthly.
Fixed Income Yields
US fixed income yields reflect Bloomberg Barclays Municipal Bond Index, Bloomberg Barclays US Corporate High-Yield Bond Index, Bloomberg Barclays US Corporate Investment-Grade Bond Index, and the ten-year Treasury.
European fixed income yields reflect the BofA Merrill Lynch Euro Corporate AA Bond Index, BofA Merrill Lynch Euro Corporate Bond Index, Barclays Pan-European Aggregate High Yield Bond Index, Bloomberg Twenty-Year European Government Bond Index (nominal), ten-year German bund, 20-year European Inflation Swaps (inflation expectations), and the real yield calculated as the difference between the inflation expectation and nominal yield.
UK sterling fixed income yields reflect the BofA Merrill Lynch Sterling Corporate AA Bond Index, BofA Merrill Lynch Sterling Corporate Bond Index, UK ten-year gilts, Bank of England 20-year nominal yields, and Bloomberg Generic UK 20-year inflation-linked (real) yields. Current UK 20-yr nominal yield data are as of May 30, 2017.