Developed equities’ renewed outperformance of emerging markets stocks continued in May, as nearly all developed markets finished in the black for the month, while many emerging markets posted losses. Global developed markets government bond returns were generally positive but muted, and, among them, US Treasuries were flat. The trade-weighted US dollar, which had been retreating since hitting a 13-year peak in late January, moderately strengthened over the month as the US Federal Reserve took pains to convince markets that a potential rate hike is still in play for its June meeting. Despite the stronger dollar, oil prices continued their recovery from February lows, touching $50/barrel for the first time this year; precious and industrial metals prices largely declined in contrast. The prospect of higher US rates and renewed dollar strength, combined with ongoing local political turmoil in several markets, weighed on emerging markets equities and currencies despite the boost to sentiment from higher energy prices.
Global equities traded down for most of the month while digesting a weak first quarter earnings season and as individual Fed commentators began to dial up expectations of a summer rate hike. The April meeting minutes released mid-May effectively confirmed the committee’s desire to resume its tightening course soon, data permitting, a stance apparently shared by Fed Chairwoman Janet Yellen. Equity markets regained their footing toward month-end as incoming economic data for several major developed economies showed some improvement and as markets perhaps realized that the Fed’s tightening path will remain gradual even if it can pull off another rate hike in the next few months. Growth stocks and small caps generally outperformed value names and large caps on a global basis. Information technology and health-care stocks led sector returns, while the energy and materials sectors lagged the most.
US equities (1.8%) performed in line with developed ex US equivalents. First quarter results were the worst of this earnings recession, with just four of ten S&P 500 sectors experiencing year-over-year earnings per share growth. A variety of factors are contributing to the weak earnings picture, including the strong dollar, weak commodity prices, falling global trade, and a dearth of corporate investment. The manufacturing slump is ongoing, while the US consumer appears to be doing somewhat better despite disappointing results and guidance from traditional bricks and mortar retailers. US equity valuations continue to be stretched and are pricing in a strong second-half earnings recovery that will require oil prices and the US dollar to remain near current levels and some improvement in overseas demand.
Among European equity markets, euro weakness versus sterling meant Europe ex UK and EMU stocks slightly underperformed UK equivalents in euro and sterling terms. The top-performing markets were in Northern Europe—Ireland (5.4%), Belgium (5.0%), and Denmark (4.4%)—while Southern European markets were weighed down by Italy (-1.3%) and Portugal (-1.0%). The major markets of France (2.7%), Germany (1.9%), and Switzerland (3.6%) all notched solid gains. First quarter earnings results across Europe were weak, most notably in the United Kingdom where the equity market is more exposed to commodities and emerging markets economies. The UK economy has also been weighed down by the upcoming referendum on the country’s European Union (EU) membership, which has hurt business and consumer confidence and thus postponed spending plans.
Japanese equities (2.6%) outperformed as share prices rallied to close out the month, although the weaker yen turned this into underperformance for unhedged euro, sterling, and US dollar investors. First quarter GDP growth in Japan surprised positively, while first quarter earnings declined double digits versus the prior year, marking a substantial deterioration compared with estimates at the start of the year. Consensus expectations remain for a healthy earnings recovery in the new fiscal year, but the yen must avoid further appreciation for that scenario to play. The Japanese economy continues to struggle despite the first quarter growth surprise; this is evident in the just-announced decision by the Abe government to delay the second consumption tax increase scheduled for April 2017, as expected. Further government stimulus is possible in the coming months.
Emerging markets equities (-0.8%) underperformed developed equity markets (1.8%) in local currency terms and by a further amount for USD- and GBP-based investors. Emerging Asia (0.7%) outpaced emerging Europe, the Middle East & Africa (-2.5%) and Latin America (-6.0%). Of the two laggard regions only two markets—Greece (14.6%) and South Africa (0.5%)—avoided declines, with stocks of the former benefitting from an agreement with official creditors to unlock the latest round of emergency debt. Brazil (-9.9%) was the worst-performing country as the Brazilian congress voted to initiate impeachment proceedings against President Dilma Rousseff, who was immediately suspended along with her administration and replaced with a caretaker government led by former Vice President Michel Temer.
Inflation-sensitive asset performance was led by energy master limited partnerships (2.5%), where unit price gains were supported by stronger oil prices, and US REITs (2.3%), where the technical picture is supportive given their upcoming inclusion in major equity indexes. UK inflation-linked government bonds (1.9%) also remain well bid; US TIPS (-0.7%) retreated in contrast. Returns among commodity futures (-0.2% for the Bloomberg Commodity Index Total Return and 2.2% for the energy-heavy S&P GSCI™) categories were mixed, with healthy gains by energy and agricultural commodities due to supply constraints offset by sizeable declines across precious and industrial metals, driven in part by renewed US dollar strength. Oil prices touched $50/barrel as a result of recent supply outages and heightened political risk across several major producers. Gold (-6.0%) fell to $1,214.3/troy ounce in response to increased expectations that the Fed will announce another rate hike in the coming months. Iron ore prices collapsed from their April peak after China’s stockpiles ballooned and as authorities there sought to curb rampant speculation. Natural resources equities (-2.8%) were dragged lower by a sharp decline in metals and mining stocks as a result.
Global government bonds (0.6%) posted another month of gains but more modest ones that generally underperformed associated equity markets. The exception was UK gilts (1.7%), where investors appear to be favoring government bonds as a potential hedge against a surprise “Brexit” outcome and despite rising inflation. US Treasuries (0.0%) treaded water as the yield curve resumed its flattening trend of the last two years, with long rates standing still and short rates rising in conjunction with increased expectations for another rate hike—the two-year yield rose 10 bps to 0.87%, while the yield on the ten-year finished at 1.84%, an increase of just 1 bp. US tax-exempt bonds (0.3%) continued their steady gains, seemingly unfazed by another Puerto Rico default. Within credit markets, energy sector spreads benefitted from further oil price gains, leading US high-yield bonds (0.6%) to advance slightly.
The trade-weighted US dollar rallied 3%, strengthening against most global currencies at least partly as a result of the Fed’s more hawkish stance. The British pound also gained ground on a trade-weighted basis as expectations grew that voters will elect for the United Kingdom to retain its EU membership. Policymakers in both the Eurozone and Japan signaled that furthering quantitative easing will be pursued if conditions warrant, and the euro and Japanese yen both weakened versus the US dollar and British pound as a result. Emerging markets currencies retreated versus the dollar, euro, and pound sterling; among the currencies we track, the South African rand, Colombian peso, and Mexican peso were particularly weak.
Market Exhibits
Probability of a Fed Rate Hike in June
Recent hawkish commentary from the Fed appeared an attempt to prepare the market for a potential near-term rate hike if US economic data continue to improve. The shift in tone may have also been a reaction to what the Fed viewed as the market’s overly dovish expectations; the futures market was pricing in a less than 5% probability of a June rate hike as recently as mid-May

Probability of a Fed Rate Hike in June
December 31, 2015 – May 31, 2016 • Percent (%)
Source: Bloomberg L.P.
Note: Probability represents probability that Fed Funds will end June at 0.625% (implying one 25 bp rate hike this year).
Trade-Weighted USD Index
The trade-weighted US dollar strengthened in May after retreating from the 13-year peak reached in late January. The stronger dollar weighed on returns of overseas assets for USD-based investors, and was a particular headwind for emerging markets equities and currencies
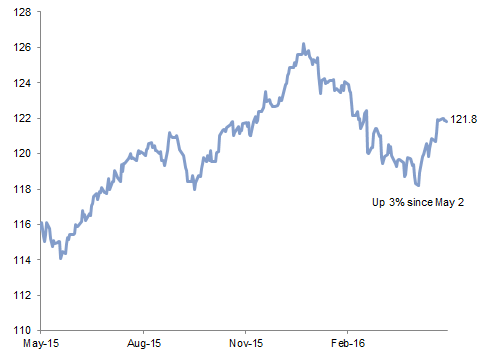
Trade-Weighted USD Index
May 31, 2015 – May 27, 2016 • Index Level
Sources: Federal Reserve and Thomson Reuters Datastream.
Note: Trade-weighted dollar index data are daily.
Two-Year and Ten-Year US Treasury Yields
The US Treasury yield curve has been flattening since late 2013, with long rates anchored by a combination of subdued inflation expectations, ongoing recession fears, and interest rate suppression across much of the developed world. Short rates have been steadily rising in step with the Fed trying to guide markets toward gradually higher rates

Two-Year and Ten-Year US Treasury Yields
May 31, 2014 – May 31, 2016 • Percent (%)
Sources: Federal Reserve and Thomson Reuters Datastream.
Note: Data are daily.
UK and EU Trade
The EU’s importance to the United Kingdom as the latter’s largest trading partner indicates what is at stake in the upcoming June 23 referendum. While the market consensus expects British voters to reaffirm the country’s EU membership, a surprise “Brexit” vote would likely drive the UK economy into recession
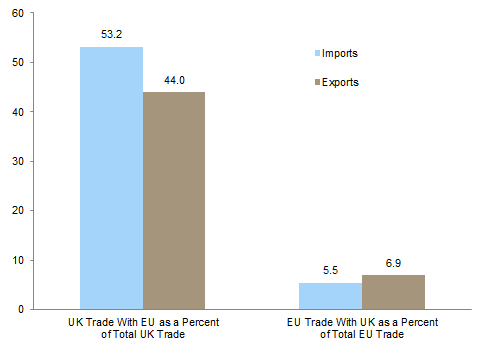
UK and EU Trade
As of Fourth Quarter 2015 • Percent (%) of Total Trade
Sources: Eurostat, Thomson Reuters Datastream, and UK Office for National Statistics.
Notes: Total trade data are quarterly. Total trade includes goods and services. Total EU trade excludes trade attributed to the United Kingdom.
Currency Performance
The US dollar strengthened against most global currencies in May but remains weaker versus the euro and the Japanese yen over the trailing 12 months
The euro weakened versus the US dollar and British pound but strengthened relative to the Japanese yen, Swiss franc, and emerging markets currencies. Only the Japanese yen remains stronger versus the euro over the trailing 12 months
The pound sterling modestly weakened versus the US dollar but rallied against many currencies, as a survey of recent polls and betting markets suggested that a “Brexit” outcome will be avoided

Currency Performance
As of May 31, 2016
Sources: MSCI Inc. and Thomson Reuters Datastream. MSCI data provided “as is” without any express or implied warranties.
Note: EM currencies is an equal-weighted basket of 20 currencies.
Index Performance (US$)
US REITs, US equities, and US high-yield bonds led gains for US dollar investors, while the energy-heavy S&P GSCI commodity index also posted strong returns. Developed equities appreciated less due to a stronger dollar, which particularly weighed on emerging markets assets, dragging them well into negative territory. US investment-grade bonds were mostly flat
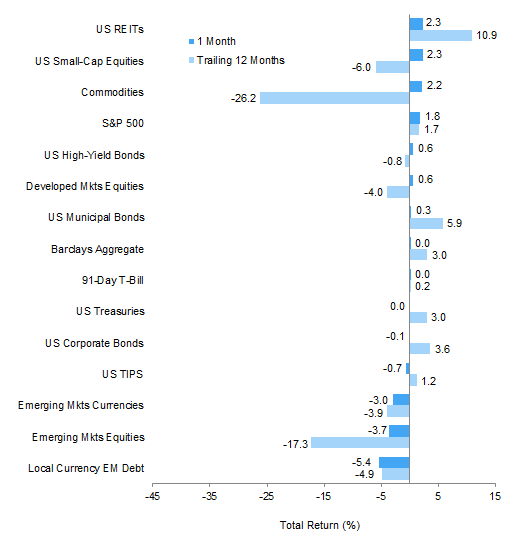
Index Performance (US$)
As of May 31, 2016

MSCI US Composite Normalized P/E
December 31, 1969 – May 31, 2016
Sources: Barclays, BofA Merill Lynch, FTSE International Limited, Frank Russell Company, J.P. Morgan Securities, Inc., MSCI Inc., National Association of Real Estate Investment Trusts, Standard & Poor’s, and Thomson Reuters Datastream. MSCI data provided “as is” without any express or implied warranties.
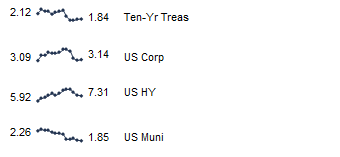
Fixed Income Yields
May 2015 – May 2016
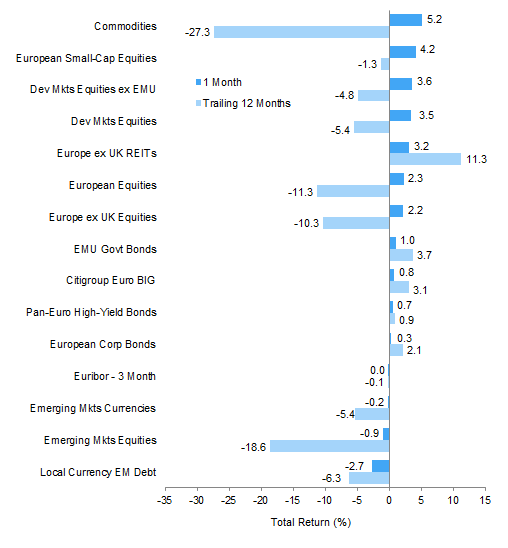
Index Performance (€)
The combination of a strong dollar, weak euro, and investors’ improved risk appetite drove gains across commodities, developed markets equities, and Europe ex UK REITs for euro-based investors. Government bonds saw more muted gains but outperformed corporate credits. Emerging markets assets declined as emerging markets currencies were broadly weak
Index Performance (€)
As of May 31, 2016

MSCI Europe ex UK Composite Normalized P/E
December 31, 1969 – May 31, 2016
Sources: Barclays, Citigroup Global Markets, EPRA, FTSE International Limited, J.P. Morgan Securities, Inc., MSCI Inc., National Association of Real Estate Investment Trusts, Standard & Poor’s, and Thomson Reuters Datastream. MSCI data provided “as is” without any express or implied warranties.
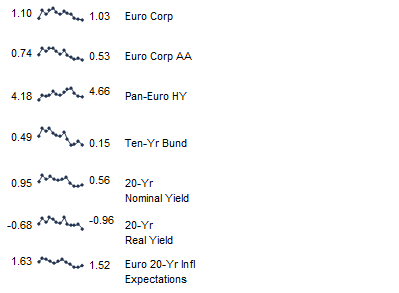
Fixed Income Yields
May 2015 – May 2016
Index Performance (₤)
UK investors saw gains in UK mid-cap equities, UK gilts, UK linkers, and UK REITs outpace those of UK large caps, developed ex UK equities, and UK corporate credits. Emerging markets assets suffered losses due to a combination of the strong British pound and weak emerging markets currencies

Index Performance (₤)
As of May 31, 2016

MSCI UK Composite Normalized P/E
December 31, 1969 – May 31, 2016
Sources: Barclays, BofA Merrill Lynch, EPRA, FTSE International Limited, J.P. Morgan Securities, Inc., MSCI Inc., National Association of Real Estate Investment Trusts, Standard & Poor’s, and Thomson Reuters Datastream. MSCI data provided “as is” without any express or implied warranties.
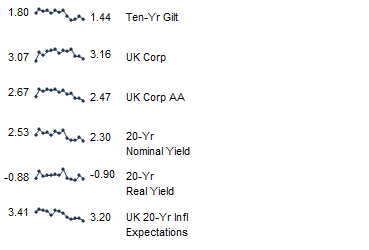
Fixed Income Yields
May 2015 – May 2016
Exhibit Notes
Performance Exhibits
Total returns for MSCI developed markets indexes are net of dividend taxes. Total returns for MSCI emerging markets indexes are gross of dividend taxes.
US dollar index performance chart includes performance for the Barclays Corporate Investment Grade, Barclays High Yield Bond, Barclays Municipal Bond, Barclays US TIPS, Barclays US Treasuries, BofA Merrill Lynch 91-Day Treasury Bills, FTSE® NAREIT All Equity REITs, J.P. Morgan ELMI+, J.P. Morgan GBI-EM Global Diversified, MSCI Emerging Markets, MSCI World, Russell 2000®, and S&P GSCI™ indexes.
Euro index performance chart includes performance for the Barclays Euro-Aggregate: Corporate, Barclays Pan-Euro High Yield, Citigroup EMU Govt Bonds, FTSE® EPRA/NAREIT Europe ex UK, J.P. Morgan ELMI+, J.P. Morgan GBI-EM Global Diversified, MSCI Emerging Markets, MSCI Europe, MSCI Europe ex UK, MSCI Europe Small Cap, MSCI World ex EMU, MSCI World, and S&P GSCI™ indexes.
UK sterling index performance chart includes performance for the Barclays Sterling Agg Corps, BofA Merrill Lynch Sterling High Yield, FTSE® British Government All Stocks, FTSE® British Government Index-Linked All Stocks, FTSE® EPRA/NAREIT UK RE, FTSE® 250, J.P. Morgan ELMI+, J.P. Morgan GBI-EM Global Diversified, MSCI Emerging Markets, MSCI Europe ex UK, MSCI World, MSCI World ex UK, and S&P GSCI™ indexes.
Valuation Exhibits
The composite normalized P/E ratio is calculated by dividing the inflation-adjusted index price by the simple average of three normalized earnings metrics: ten-year average real earnings (i.e., Shiller earnings), trend-line earnings, and return on equity–adjusted earnings. We have removed the bubble years 1998–2000 from our mean and standard deviation calculations. All data are monthly.
Fixed Income Yields
US fixed income yields reflect Barclays Municipal Bond Index, Barclays US Corporate High Yield Bond Index, Barclays US Corporate Investment-Grade Bond Index, and the ten-year Treasury.
European fixed income yields reflect the BofA Merrill Lynch Euro Corporate AA Bond Index, BofA Merrill Lynch Euro Corporate Bond Index, Barclays Pan-European Aggregate High Yield Bond Index, Bloomberg Twenty-Year European Government Bond Index (nominal), ten-year German bund, 20-year European Inflation Swaps (inflation expectations), and the real yield calculated as the difference between the inflation expectation and nominal yield.
UK sterling fixed income yields reflect the BofA Merrill Lynch Sterling Corporate AA Bond Index, BofA Merrill Lynch Sterling Corporate Bond Index, UK ten-year gilts, and Bank of England 20-year nominal, real, and zero coupon (inflation expectations) yields.