Many assets struggled to retain their upward momentum in May, as a battle between technicals and fundamentals played out across several markets. Prime examples included the US dollar eventually regaining its poise after some initial wobbles, oil futures moving lower after several weeks of gains, and Eurozone government bond yields rising from historically low levels. Developed equity returns were mildly positive despite growing concerns over valuations in certain markets, though significant losses during the last week of the month in some emerging markets meant the overall market tone was subdued.
At first blush, the renewed strength of the US dollar is somewhat puzzling given that recent economic data have underwhelmed. May’s revision to first quarter GDP showed that the US economy contracted by 0.7% on an annualized basis; if not for an increase in inventories, an even worse result would have ensued. Lower oil prices are yet to deliver the much-awaited fillip to the domestic economy. Various theories have been offered as to why this is the case: one suggests Americans are using the windfall to reduce debts; another posits that consumers don’t believe cheap gas is here to stay. Some US economic data have been more reassuring—jobless claims, housing starts, and service data suggest the underlying strength of the economy is healthier.
Part of the dollar’s resilience is also explained by large speculative long positions in dollar futures contracts, though these have declined slightly in recent months. Dollar bulls would have taken comfort from news that core consumer prices grew at a relatively resilient 1.8% annual rate in April, leading to hope that US rate hikes can’t be postponed indefinitely. Yields rose slightly across the curve for US Treasuries (the ten-year rose 7 bps to 2.12%), leading to small losses for most US fixed income indexes. US interest rates also were dragged higher by the ongoing sell-off in Eurozone government bonds, which reduced the relative attractiveness of US Treasuries. In a spillover of April’s trend, attempts by investors to lock in profits on German bunds met with limited interest/liquidity and triggered more losses. As ten-year bund yields rose 12 bps to 0.49%, German bunds overall returned -1.1%, and Eurozone bond indexes posted minor losses.
That currencies like the euro (-2.2%) and yen (-3.6%) resumed their decline against the dollar is somewhat surprising given fundamentals seem to have shifted in their favor. Aside from many valuation metrics showing these currencies as undervalued against the dollar, economic data and local rates also appeared to have been supportive. For example, while the US economy shrank in first quarter, the Eurozone economy grew at a 1.6% annualized rate; Japan’s 2.4% growth also exceeded expectations. In addition, both regions are seeing growing current account surpluses, in part because cheaper currencies boost exports but also due to lower oil prices. Still, speculators continue to bet against these currencies, and markets seem skeptical that economic strength in Europe and Japan will continue. Euro bears received some support in May when several ECB board members confirmed the ECB would fulfill its commitment to expanded quantitative easing, and in fact might actually accelerate bond purchases in the next few weeks to avoid their impact being exaggerated during summer’s limited bond market liquidity.
Compared to the action in the bond and currency markets, equity markets were relatively calm. US equities returned 1.3% despite a large drop for energy sector stocks (-4.8%) as crude prices struggled to hold on to some of their recent gains. The first quarter earnings season has wrapped up for the S&P 500 and has been one to forget. According to FactSet, blended earnings growth will be just 0.7%, while revenue will actually shrink 2.9%. US profits are now expected grow 1.7% for full-year 2015, which will weigh on return expectations given valuations already look stretched. Adding to concern is the growing chorus of analysts questioning the share buyback policies that have underpinned much of the US market’s rise over the last couple years, citing the tendency of managers to buy at the top and the lack of investment for future growth.
European equities (0.8%) trailed US peers for the month; year-to-date their outperformance remains significant (roughly 970 bps). Aside from superior economic growth and at least one central bank firmly in easing mode, European companies are also posting better earnings growth than their US peers. Stoxx 600 earnings grew nearly 11% in first quarter year-over-year and are expected to grow around 9% in 2015. Energy sector earnings are expected to be far less a drag in Europe than in the United States during 2015 (-33% versus -56%), while the delayed recapitalization of the financial sector (which expects 26% EPS growth) also explains the relative divergence.
After a strong start to 2015, emerging markets equities (-2.5%) also struggled to maintain their stride; losses were even greater for US investors (-4.0%) given currency depreciation. Weakness was seen across a variety of geographies, with heavily weighted Chinese equities (-3.7%) hurt by growing fears over the government and brokers both starting to discourage speculative retail purchases of stocks. Brazilian stocks (-6.0%) suffered given weak economic and earnings growth, though India (3.4%) remained in favor despite disappointment over both earnings and the pace of structural reforms.
One asset class that showed no sign of losing recent momentum was Japanese equities (5.0%), which are receiving support from a number of forces. Japanese companies reported record profits last year (nearly ¥30 trillion) and are also bending to shareholder pressure by increasing payouts to investors. Other technicals are also supportive; shares received a boost in May when several large institutional investors announced they would be increasing exposure to domestic equities. While some of this had been expected and is reflected by their 19.6% year-to-date return, the fact remains that Japanese equities continue to trade at attractive valuations relative to peers (Japan’s forward P/E of 16.1 is nearly 10% below that in the United States), and earnings growth for the next fiscal year (9%) compares favorably to other developed markets.
Inflation-sensitive assets struggled in May for a variety of reasons. Slowing global growth was viewed as negative for commodity prices (-2.0), as was the stronger US dollar, which is believed to hurt demand from international buyers. Energy prices fell slightly as investors wait for signs that declining capital expenditure and US rig counts will curb production. Given how much marginal costs have decreased for oil producers, prices seem likely to stabilize well below previous peaks. US REITs (-0.2%) posted minor losses as interest rates rose, but the drawdown was more severe in Eurozone property (-3.9%) given the sharp spike in rates.
Ten-year German bund yields moved higher but ended May significantly below earlier peaks as the ECB confirmed its commitment to expand QE and said it might actually accelerate bond purchases before liquidity thins during the summer
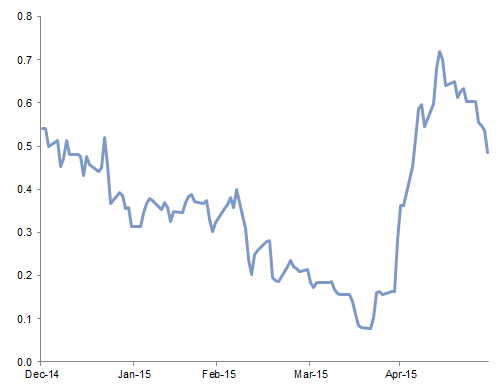
German Ten-Year Bund Yield
December 31, 2014 – May 31, 2015 • Percent (%)
Source: Thomson Reuters Datastream.
US equities reversed some of their year-to-date underperformance against emerging and other developed markets peers. Despite lackluster US earnings growth and high valuations, prices appeared to have moved faster than fundamentals in some key emerging markets
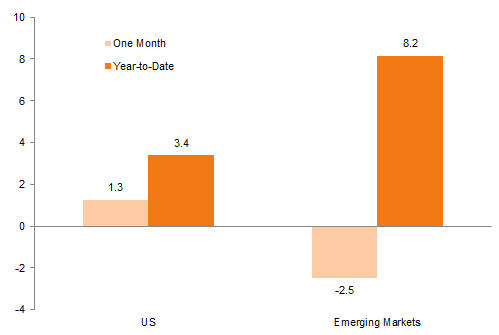
US and EM Equity Performance
As of May 31, 2015 • Percent (%)
Sources: MSCI Inc. and Thomson Reuters Datastream. MSCI data provided “as is” without any express or implied warranties.
Notes: Data are in local currency. Total returns for MSCI Emerging Markets indexes are gross of dividend taxes. Total returns for MSCI developed markets indexes are net of dividend taxes.
Spot crude oil prices were directionless in May as investors balanced news flow about record levels of supply in the United States with stories about declining rig counts and significant capex reductions at global energy producers

Crude Oil Prices
December 31, 2014 – May 31, 2015 • US$/bbl
Sources: Thomson Reuters Datastream and US Energy Information Association.
The US dollar halted its recent skid and rose during the month against key developed and emerging currencies. A strong dollar helps explain in part recent commodity softness as it makes commodities more expensive to foreign consumers
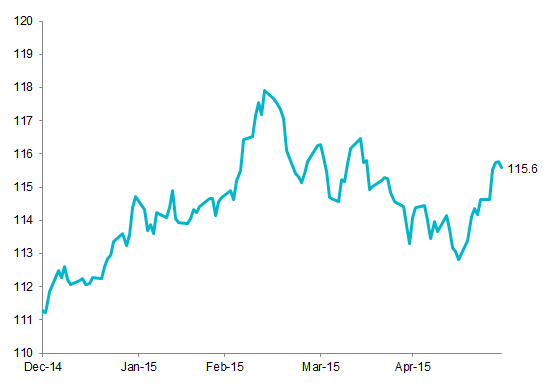
Trade-Weighted Value of the US Dollar
December 31, 2014 – May 31, 2015 • Index Level
Sources: Federal Reserve and Thomson Reuters Datastream.
Notes: The index is based on a basket of foreign currencies weighted by the dollar amount of trade with the United States. Data are in nominal terms.
The S&P 500 enjoyed a strong month despite growing concern over earnings and the record share buybacks that have boosted performance; dollar strength meant this was enough to outpace developed peers for local investors. US interest rates rose as core inflation proved stubbornly high; this weighed on a variety of assets including US fixed income but also REITs and MLPs
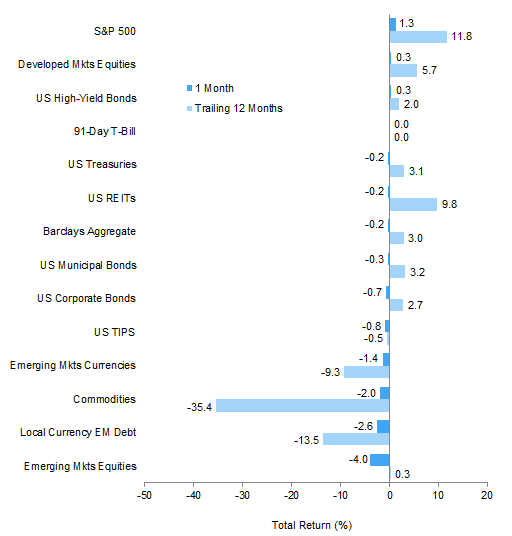
Index Performance (US$)
As of May 31, 2015
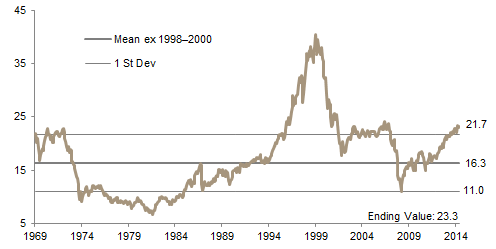
MSCI US Composite Normalized P/E
December 31, 1969 – May 31, 2015
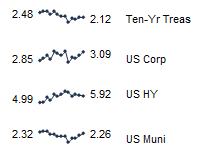
Fixed Income Yields
May 2014 – May 2015
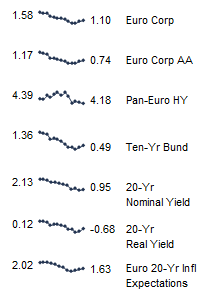
European equities enjoyed muted gains despite the Q1 earnings season concluding on a high note, perhaps as investors focused on building tensions with Greece. Euro weakness meant that local investors fared better in US and certain other developed equity markets. EMU government bond yields rose, but losses would have been worse had it not been for the ECB offering reassurance that it was committed to its QE targets; higher rates meant that local real estate surrendered some of its strong recent performance
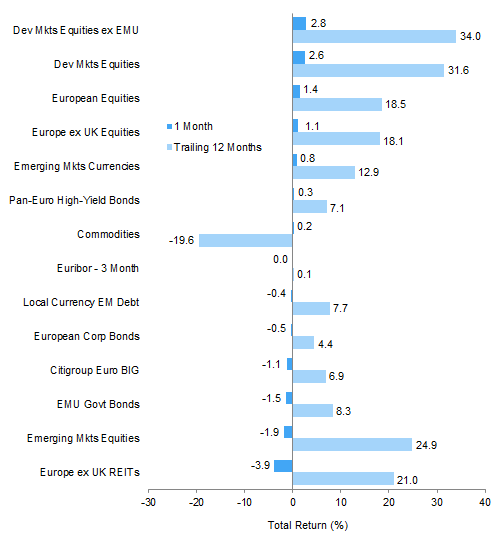
Index Performance (€)
As of May 31, 2015
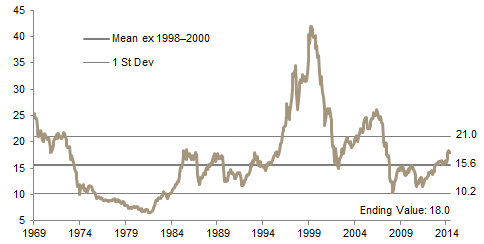
MSCI Europe ex UK Composite Normalized P/E
December 31, 1969 – May 31, 2015
Fixed Income Yields
May 2014 – May 2015
Bucking a global trend, gilt yields fell as consumer prices fell below zero and the BOE suggested price pressures would be contained for this year and next. Local fixed income and real estate securities gained, while the FTSE outperformed global peers in sterling terms as the currency rose
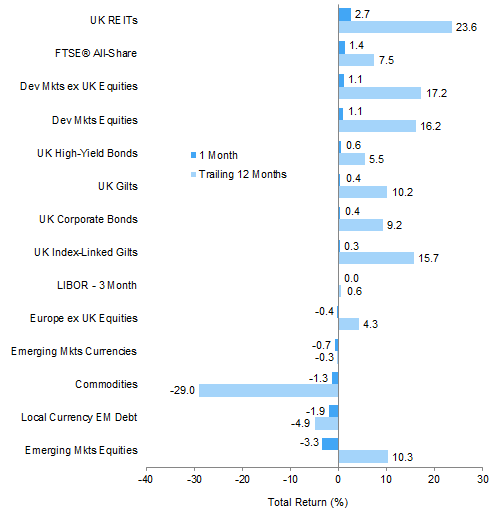
Index Performance (₤)
As of May 31, 2015

MSCI UK Composite Normalized P/E
December 31, 1969 – May 31, 2015
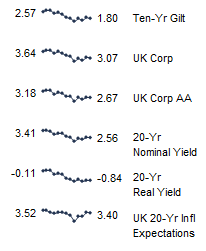
Fixed Income Yields
May 2014 – May 2015
Most developed and emerging currencies fell against the US dollar as core inflation rose and US data were viewed as just strong enough to justify a September rate hike. Emerging markets currencies fell as data showed emerging markets capital outflows accelerated, and declining local growth and inflation meant that traders pushed back expectations for rate hikes
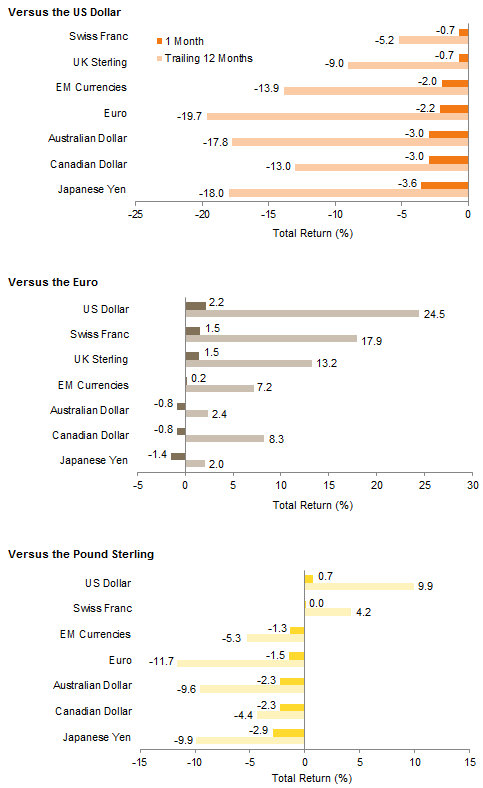
Currency Performance
As of May 31, 2015
Exhibit Notes
Performance Exhibits
Total returns for MSCI developed markets indexes are net of dividend taxes. Total returns for MSCI emerging
markets indexes are gross of dividend taxes.
US dollar index performance chart includes performance for the Barclays Corporate Investment Grade, Barclays High Yield Bond, Barclays Municipal Bond, Barclays US TIPS, Barclays US Treasuries, BofA Merrill Lynch 91-Day Treasury Bills, FTSE® NAREIT All Equity REITs, J.P. Morgan ELMI+, J.P. Morgan GBI-EM Global Diversified, MSCI Emerging Markets, MSCI World, and S&P GSCI™ indexes.
Euro index performance chart includes performance for the Barclays Euro-Aggregate: Corporate, Barclays Pan-Euro High Yield, Citigroup EMU Govt Bonds, FTSE® EPRA/NAREIT Europe ex UK RE, J.P. Morgan ELMI+, J.P. Morgan GBI-EM Global Diversified, MSCI Emerging Markets, MSCI Europe, MSCI Europe ex UK, MSCI World ex EMU, MSCI World, and S&P GSCI™ indexes.
UK sterling index performance chart includes performance for the Barclays Sterling Aggregate: Corporate Bond, BofA Merrill Lynch Sterling High Yield, FTSE® British Government All Stocks, FTSE® British Government Index-Linked All Stocks, FTSE® EPRA/NAREIT UK RE, J.P. Morgan ELMI+, J.P. Morgan GBI-EM Global Diversified, MSCI Emerging Markets, MSCI Europe ex UK, MSCI World, MSCI World ex UK, and S&P GSCI™ indexes.
Valuation Exhibits
The composite normalized P/E ratio is calculated by dividing the inflation-adjusted index price by the simple average of three normalized earnings metrics: ten-year average real earnings (i.e., Shiller earnings), trend-line earnings, and return on equity–adjusted earnings. We have removed the bubble years 1998–2000 from our mean and standard deviation calculations. All data are monthly.
Fixed Income Yields
US fixed income yields reflect Barclays Municipal Bond Index, Barclays US Corporate High Yield Bond Index, Barclays US Corporate Investment-Grade Bond Index, and the ten-year Treasury.
European fixed income yields reflect the BofA Merrill Lynch Euro Corporate AA Bond Index, BofA Merrill Lynch Euro Corporate Bond Index, Barclays Pan-European Aggregate High Yield Bond Index, Bloomberg Twenty-Year European Government Bond Index (nominal), ten-year German bund, 20-year European Inflation Swaps (inflation expectations), and the real yield calculated as the difference between the inflation expectation and nominal yield.
UK sterling fixed income yields reflect the BofA Merrill Lynch Sterling Corporate AA Bond Index, BofA Merrill Lynch Sterling Corporate Bond Index, UK ten-year gilts, and Bank of England 20-year nominal, real, and zero coupon (inflation expectations) yields.