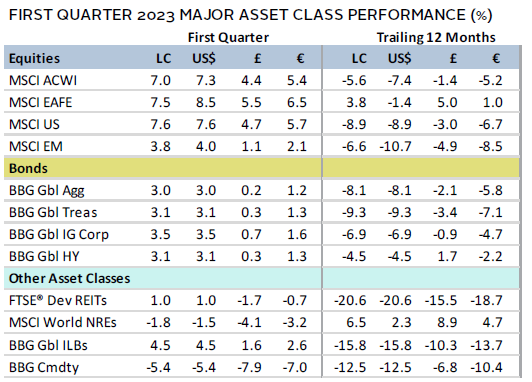
Risk assets continued to rebound in first quarter, led by global equities, which have gained 15% since their recent trough last October. Global growth topped value by the widest margin since 1999, and large caps topped small caps. Developed markets (DM) stocks outpaced emerging markets (EM) equivalents for a third consecutive quarter. Bonds advanced as yields declined across most maturities longer than one year. Real assets categories were mostly weak, as commodities and natural resources equities declined. Among major currencies, UK sterling and the euro strengthened, and the US dollar mostly depreciated.
Sources: Bloomberg Index Services Limited, Bloomberg L.P., EPRA, FTSE International Limited, MSCI Inc., National Association of Real Estate Investment Trusts, and Thomson Reuters Datastream. MSCI data provided “as is” without any express or implied warranties.
Note: Local currency returns for the Bloomberg fixed income indexes, the Bloomberg Commodity Index, and the FTSE® Developed REITs are in USD terms.
The Macro Picture
Markets were briefly thrown into turmoil late in first quarter, with bond volatility rising to its highest level since the Global Financial Crisis (GFC) as stress among US regional banks sparked fears of global contagion. It began when Silicon Valley Bank (SVB)—a US regional bank that played a pivotal role in supporting the venture capital ecosystem—announced it needed to raise capital to meet deposit outflows from mostly corporate customers. This triggered a bank run, leading to its swift failure. A coalition of US regulators quickly announced emergency measures to protect all SVB depositors and to ensure liquidity. Shortly after, regulators also shut down Signature Bank on concerns that the mid-sized bank would collapse, adding to investors’ concerns of contagion. Meanwhile in Europe, Credit Suisse faced idiosyncratic risks, prompting the Swiss government to broker its sale to UBS at a steep discount. The Swiss National Bank also offered $100 billion in liquidity to UBS to support the deal and worked with other central banks to ensure liquidity in the global banking system by increasing the frequency of US dollar swap trading.
Central banks attempted to quell fears, emphasizing that the banking sector was sound and resilient. Still, investors remained skeptical of global central banks’ ability to achieve both financial stability and price stability, and sharply repriced forward rates lower, expressing higher odds of a recession. The Federal Reserve, European Central Bank (ECB), and Bank of England (BOE), among others, hiked benchmark interest rates multiple times during the quarter—even after the aforementioned banks collapsed. However, many central banks did trim the size of their rate increases. Overall, central bank messaging was broadly consistent: higher rates are needed to fight inflation, and they have several tools to help keep the banking system safe.
Equities
US equities advanced in first quarter, edging DM ex US for the first time in more than a year. Equity gains were largely driven by falling interest rates from an increased belief that the Fed will cut its benchmark target rate much sooner than previously anticipated. This helped growth-oriented sectors—such as information technology, communication services, and consumer discretionary—lead the rally, and the broader growth index outperformed value by the widest margin since data began in the mid-1970s. Financials and energy companies declined the most amid increased scrutiny on the banking sector and declining energy prices, respectively. Large caps topped small caps, with the five largest companies accounting for roughly 60% of the quarter’s returns, and bank stocks weighing on small caps. Corporate earnings declined 6% year-over-year (YOY) in fourth quarter 2022, disappointing earlier estimates. Bottom-up analysts downgraded earnings per share growth forecasts for 2023 from 3% to 0%.
The Fed continued to tighten monetary policy in first quarter, raising its benchmark target rate by 25 basis points (bps) twice—a slower pace than its previous hikes. It appeared steadfast in its commitment to bring down inflation, particularly after its second rate hike, which was announced during the height of the SVB bank failure tumult. The Fed also established a new Bank Term Funding Program, which allows institutions to secure loans using qualifying securities at face value—rather than depressed market values—as collateral. Despite the Fed’s base case expectation that no rate cuts are on the horizon, market participants are now pricing in multiple rate cuts before year end. Economic data were broadly supportive of a soft landing, as inflation rates continued to decline off their recent peaks, confidence and purchasing managers’ index (PMI) data held up stronger than expected, and labor market data remained strong.
European equities gained, topping broader DM peers for a fourth consecutive quarter. Optimism was driven by evidence that the Continent has weathered the brunt of its energy crisis, as natural gas prices fell to 20-month lows. Europe ex UK outpaced UK equivalents by the widest margin since 2015. Corporate earnings for the STOXX 600 Index grew 8% YOY in fourth quarter 2022, outpacing US peers.
Eurozone headline inflation retreated faster than expected, helped by receding energy and food prices. However, core inflation unexpectedly continued to climb, ending the quarter at its highest reading on record since data began in 1997. The ECB continued tightening by raising its benchmark deposit rate 100 bps to 3.00% over two meetings. The central bank stuck with its previous plan for a 50-bp hike in March, despite the rate decision coming just days after the collapse of SVB and sudden sale of Credit Suisse. ECB President Christine Lagarde emphasized there was “no trade-off” between financial stability and price stability, and that they had “all the tools” needed to respond to any potential bank failures.
UK economic data releases were broadly weak. Exports and industrial production declined, manufacturing PMI data remained contractionary, and inflation unexpectedly accelerated. The BOE raised its benchmark bank rate 75 bps over two meetings to 4.25% but didn’t commit to any future increases, instead choosing a wait-and-see approach. The central bank also noted it now expects the United Kingdom to avoid falling into a recession later this year. The United Kingdom also clinched a breakthrough trade deal with the EU on protocol for the land border along Northern Ireland, which had been a sticking point since the early days of Brexit negotiations.
Japanese equities advanced in first quarter, narrowly trailing broad DM; however, the country lagged by more in major currency terms due to Japanese yen weakness. The Japanese government voted economist Kazuo Ueda as the next governor of the Bank of Japan (BOJ) to replace Governor Haruhiko Kuroda, whose term expires in early April. In its last policy meeting with Kuroda at the helm, the BOJ held its benchmark short-term interest rate at -0.1% and kept in place its 0.5% cap on ten-year government bond yields. It remains the only major central bank that has not tightened monetary policy in a meaningful way. However, Ueda is expected to gradually shift BOJ policy away from ultra-low policy rates and yield curve controls. Inflation—although low relative to other countries—reached a fresh 40-year high. Other major economic releases late in the quarter were mostly better than expected, as retail sales, industrial production, and manufacturing and services PMIs all topped expectations.
Pacific ex Japan equities gained but lagged other major DM counterparts, dragged down by Hong Kong. Hong Kong’s underperformance was largely driven by its heavy overweight to two sectors (financials and real estate) that lagged globally, which make up about 70% of the index. Top performer New Zealand was boosted by idiosyncratic events, as the index only holds six stocks. The Reserve Bank of New Zealand raised its benchmark Official Cash Rate by 50 bps to 4.75%—in line with expectations—and indicated it expects to continue raising rates to 5.50% this year, due to elevated inflation and a very tight labor market. The Reserve Bank of Australia (RBA) raised its benchmark cash rate target by 25 bps twice to 3.60%. In its official release, the RBA noted committee members would consider pausing rate hikes at the next meeting to “reassess the outlook for the economy.”

Sources: MSCI Inc. and Thomson Reuters Datastream. MSCI data provided “as is” without any express or implied warranties.
Emerging markets equities advanced in first quarter but lagged DM peers for the third consecutive quarter. Returns among major countries varied widely—Taiwan and Korea gained by double digits, buoyed by resilient trade data, while India and Brazil each declined by 7%. These dynamics supported emerging Asia’s outperformance, while emerging Europe, Middle East & Africa was roughly flat, and Latin America declined.
China topped the broader index as investors parsed the country’s economic data releases since it ended its zero-COVID policy in December. Initial exuberance gave way to cautious optimism by the end of the quarter. Authorities in Japan and the Netherlands announced new semiconductor export controls, restricting the technology that can be shared with Chinese companies. China held its annual “two sessions” meetings—the National People’s Congress and Chinese People’s Political Consultative Conference—in early March, which focused primarily on domestic stability, economic self-sufficiency, and national security.
Most EM central banks, which have been ahead of their major DM peers in raising rates this cycle, added additional benchmark rate hikes in first quarter. The Reserve Bank of India raised its benchmark policy rate by 25 bps and surprised economists by leaving the door open for further rate hikes. Banco de México stunned markets by raising its benchmark rate by 50 bps—a Bloomberg economists’ poll had unanimously estimated a quarter-point raise—after domestic inflation picked up. The South African Reserve Bank raised its benchmark repo rate 50 bps, also more than economists predicted, while simultaneously raising its projected national inflation for 2023.

Sources: MSCI Inc. and Thomson Reuters Datastream. MSCI data provided “as is” without any express or implied warranties.
Fixed Income
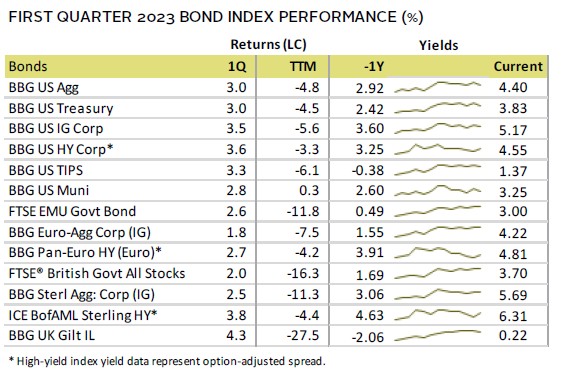
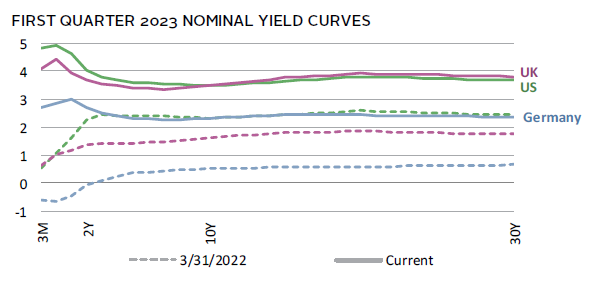
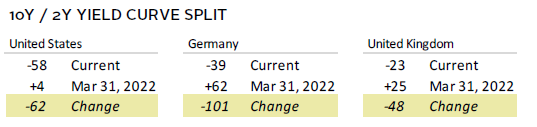
US fixed income assets advanced across the board in first quarter, as market participants adjusted their Fed rate hike expectations lower and yields on Treasuries with maturities greater than one year declined. The two major yield curve spread recession indicators (the ten-year/two-year and ten-year/three-month) expanded to their most inverted levels this cycle and their deepest negative readings since at least 1981. High-yield corporates edged investment grade, and inflation-protected Treasuries bested nominal peers. Five- and ten-year Treasury yields shrank 39 bps and 41 bps to 3.60% and 3.48%, respectively. Shorter tenors climbed to their highest levels since the GFC. Notably, all tenors two years and below reached above 5.00% prior to the collapse of SVB.
Euro-denominated bonds advanced, led by pan-euro high-yield corporates. EMU government bonds outpaced investment-grade corporate equivalents. German ten-year yields declined 25 bps to finish the quarter at 2.31%. However, yields on the short end rose significantly to their highest levels since the GFC. Sterling-denominated bonds also gained. High-yield corporates outperformed investment-grade equivalents, investment-grade corporates bested gilts, and linkers topped nominal gilts. Five- and ten-year gilt yields fell 18 bps and 24 bps to 3.41% and 3.48%, respectively. Similar to other regions, short-tenor rates rose to their highest levels in more than a decade.
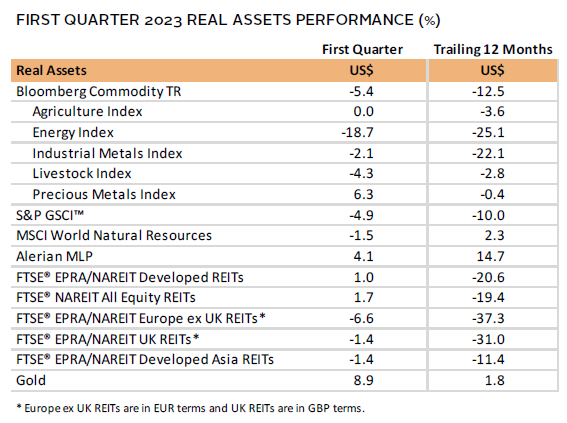
Real Assets
Commodity futures fell in first quarter as most major subcategories declined. Energy declined the most, dragged down by natural gas and oil prices. Precious metals advanced, boosted by the safe-haven nature of gold and silver.
Oil prices ($79.77 for Brent and $75.67 for WTI) declined mildly in first quarter, reflecting conflicting signals. Uncertainty over economic growth, consternation from the banking saga, and new expectations for record production outweighed excitement for China’s reopening and a weaker US dollar. The International Energy Agency upgraded their forecast for 2023 production to record levels, with many non-OPEC countries expected to increase production, in part to address the loss of barrels from Russia. Russia responded to the West’s price caps on its oil and oil products by announcing production cuts of 500,000 barrels per day beginning in March. The United States announced it would take years to replenish its relatively depleted oil reserves.
Global natural resources equities declined in first quarter, as energy prices fell and support for windfall taxes across some major economies gained steam.
Global REITs were mixed, as US REITs advanced, while Europe ex UK REITs declined the most. The office sector declined nearly 10%, while self-storage gained the most.
Gold prices rose to $1,976.50/troy ounce, to its highest ever nominal quarter-end level. The yellow metal advanced the most since the start of the COVID-19 pandemic, with price gains driven by dollar weakness and flight to safety amid fears over the stability of the banking system.
Sources: Alerian, Bloomberg L.P., EPRA, FTSE International Limited, Intercontinental Exchange, Inc., MSCI Inc., National Association of Real Estate Investment Trusts, Standard & Poor’s, and Thomson Reuters Datastream. MSCI data provided “as is” without any express or implied warranties.
Note: Gold performance based on spot price return.
USD-Based Investors
Risk assets continued to rebound in first quarter. Equities outperformed other broad asset classes, led by DM, which outpaced EM for a third consecutive quarter. Safe-haven gold was the top performer, advancing the most since the start of the COVID-19 pandemic, with price gains driven by dollar weakness and flight to safety amid fears over the stability of the banking system. Cash trailed Treasuries as yields on the short end of the yield curve rose to their highest levels since 2008, while yields on all tenors greater than one year fell. Commodities were the only asset class to decline, pulled down by energy as natural gas and oil prices retreated. Over the last 12 months, only cash, gold, and municipal bonds advanced.
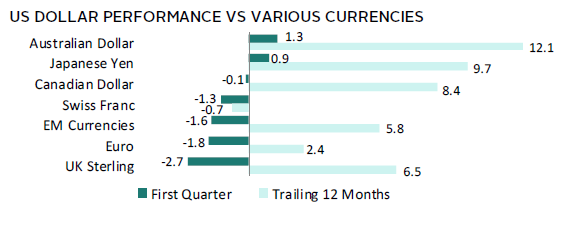
The US dollar weakened in first quarter, falling the most versus the UK sterling, euro, and our equal-weighted basket of EM currencies. The greenback gained only vis-à-vis the Australian dollar and Japanese yen. Over the last 12 months, the US dollar broadly appreciated, advancing the most versus the Australian dollar, Canadian dollar, and Japanese yen, and only declining vis-à-vis the safe-haven Swiss franc.
The Fed continued to tighten monetary policy in first quarter, raising its benchmark target rate twice by 25 bps—a slower pace than its previous hikes. It appeared steadfast in its commitment to bring down inflation, particularly after its second rate hike, which was announced during the height of the SVB bank failure tumult. Despite the Fed’s base case expectation that no rate cuts are on the horizon, market participants are now pricing in multiple rate cuts before year end. Economic data were broadly supportive of a soft landing, as inflation rates continued to decline off their recent peaks, confidence and PMI data held up stronger than expected, and labor market data remained strong.

Sources: Bloomberg Index Services Limited, FTSE International Limited, Frank Russell Company, Intercontinental Exchange, Inc., J.P. Morgan Securities, Inc., MSCI Inc., National Association of Real Estate Investment Trusts, Standard & Poor’s, and Thomson Reuters Datastream. MSCI data provided “as is” without any express or implied warranties.
EUR-Based Investors
Risk assets continued to rebound in first quarter. Equities outperformed other broad asset classes, led by Europe ex UK. DM stocks outpaced EM peers for a third consecutive quarter. Safe-haven gold was a top performer, advancing the most since the start of the COVID-19 pandemic, with price gains driven by dollar weakness and flight to safety amid fears over the stability of the banking system. Cash trailed UK gilts as yields on the short end of the yield curve rose to their highest levels since 2008, while yields on all tenors greater than one year fell. The only two asset classes to decline were commodities (dragged down by softening energy prices) and Europe ex UK REITs.
UK sterling advanced, gaining against all seven currency pairs we track, especially versus the Australian dollar and Japanese yen; UK sterling advanced the least versus the euro and our basket of EM currencies. Over the last 12 months, UK sterling was mixed, advancing the most versus the Australian dollar and Japanese yen, and declining the most vis-à-vis the safe-haven Swiss franc and US dollar.
UK economic data releases were broadly weak. Exports and industrial production declined, manufacturing PMI data remained contractionary, and inflation unexpectedly accelerated. The BOE raised its benchmark bank rate 75 bps over two meetings to 4.25% but didn’t commit to any future increases, instead choosing a wait-and-see approach. The central bank also noted it now expects the United Kingdom to avoid falling into a recession later this year. The United Kingdom also clinched a breakthrough trade deal with the EU on protocol for the land border along Northern Ireland, which had been a sticking point since the early days of Brexit negotiations.


Sources: Bloomberg Index Services Limited, EPRA, European Banking Federation, FTSE Fixed Income LLC, FTSE International Limited, Intercontinental Exchange, Inc., J.P. Morgan Securities, Inc., MSCI Inc., National Association of Real Estate Investment Trusts, Standard & Poor’s, and Thomson Reuters Datastream. MSCI data provided “as is” without any express or implied warranties.
GBP-Based Investors
Risk assets mostly declined in February, reversing some of the rally from the last several months. Equities were mixed. European stocks outpaced broader developed markets, driven by optimism that the Continent has weathered the brunt of its energy crisis. UK stocks outpaced Europe ex UK peers. However, EM equities declined the most, trailing DM peers. Among fixed income asset classes, UK gilts and linkers declined the most, suffering from higher inflation and a weaker economic outlook in the United Kingdom. UK high-yield bonds outperformed investment-grade corporate peers and were the only fixed income category to advance. Real assets declined, as gold sank more than UK REITs and broad commodities. Over the last 12 months, returns were more mixed, with gains largely driven by GBP weakness.
UK sterling broadly advanced, gaining the most against the Japanese yen and commodity-linked Australian dollar, and only declining against the US dollar. Over the last 12 months, UK sterling declined against all major currencies, save for the broadly weaker Japanese yen, which faces headwinds as the only major economy to maintain loose monetary policy. UK sterling experienced particularly steep declines versus the safe-haven US dollar and Swiss franc.
UK economic data releases were broadly better than feared. YoY retail sales and industrial production declined less than expected, headline inflation tempered more than anticipated, and fourth quarter GDP was flat, meaning the country narrowly avoided a technical recession. Yet, inflation in the United Kingdom remains above 10%—the highest among major economies—and the country is still the only G7 economy yet to surpass its pre-COVID size, with GDP 0.8% lower than at year-end 2019. The BOE raised its benchmark policy rate 50 bps to 4%, in line with expectations, but softened its tone on the future path of rate rises in the official meeting minutes.


Sources: Bloomberg Index Services Limited, EPRA, FTSE International Limited, Intercontinental Exchange, Inc., J.P. Morgan Securities, Inc., MSCI Inc., National Association of Real Estate Investment Trusts, Standard & Poor’s, and Thomson Reuters Datastream. MSCI data provided “as is” without any express or implied warranties.
Performance Exhibits
All data are total returns unless otherwise noted. Total return data for all MSCI indexes are net of dividend taxes.
USD-Based Investors index performance chart includes performance for the Bloomberg US Aggregate Bond, Bloomberg US Corporate Investment Grade, Bloomberg US High Yield Bond, Bloomberg Municipal Bond, Bloomberg US TIPS, Bloomberg US Treasuries, ICE BofAML 91-Day Treasury Bills, FTSE® NAREIT All Equity REITs, J.P. Morgan GBI-EM Global Diversified, LBMA Gold Price, MSCI Emerging Markets, MSCI World, Russell 2000®, S&P 500, and S&P GSCI™ indexes.
EUR-Based Investors index performance chart includes performance for the Bloomberg Euro-Aggregate: Corporate, Bloomberg Pan-Euro High Yield (Euro), EURIBOR 3M, FTSE EMU Govt Bonds, FTSE Euro Broad Investment-Grade Bonds, FTSE® EPRA/NAREIT Europe ex UK RE, J.P. Morgan GBI-EM Global Diversified, LBMA Gold Price AM, MSCI Emerging Markets, MSCI Europe, MSCI Europe ex UK, MSCI Europe Small-Cap, MSCI World ex EMU, MSCI World, and S&P GSCI™ indexes.
GBP-Based Investors index performance chart includes performance for the Bloomberg Sterling Aggregate: Corporate Bond, Bloomberg Sterling Index-Linked Gilts, ICE BofAML Sterling High Yield, FTSE® 250, FTSE® All-Share, FTSE® British Government All Stocks, FTSE® EPRA/NAREIT UK RE, J.P. Morgan GBI-EM Global Diversified, LBMA Gold Price AM, LIBOR 3M GBP, MSCI Emerging Markets, MSCI Europe ex UK, MSCI World, MSCI World ex UK, and S&P GSCI™ indexes.
EM currencies is an equal-weighted basket of 20 emerging markets currencies.
Fixed Income Performance Table
Performance data for US TIPS reflect the Bloomberg US TIPS Index, with yields represented by the Bloomberg Global Inflation Linked Bond Index: US.