Most global assets declined in first quarter. Global equities fell for just the second time in the last eight quarters; developed markets fared better than emerging counterparts. Value and large caps bested growth and small-cap equivalents, respectively. Fixed income assets declined as nominal interest rates rose and inflation continued to spike. Global corporate and government bonds declined at a similar pace, but performance varied by region; high-yield held up better than investment-grade equivalents. Commodities, particularly energy-related assets, were top performers as oil & gas prices surged. Among currencies, the US dollar was mixed, while UK sterling and the euro broadly declined.

Sources: Bloomberg Index Services Limited, Bloomberg L.P., EPRA, FTSE International Limited, MSCI Inc., National Association of Real Estate Investment Trusts, and Thomson Reuters Datastream. MSCI data provided “as is” without any express or implied warranties.
Note: Local currency returns for the Bloomberg fixed income indexes, the Bloomberg Commodity Index, and the FTSE® Developed REITs are in USD terms.
The Macro Picture
Volatility returned to markets during the quarter, stoked in large part by Russia’s invasion of Ukraine. Investors grappled with the economic repercussions of the war, the sanctions levied on Russia, and how the conflict could impact already-surging inflation. Indeed, commodity prices soared as the crisis threatened major disruptions to global supply chains. Energy supply was of particular concern in Europe, given its heavy dependance on Russian gas. In addition, food shortages have exacerbated a humanitarian crisis in the Middle East & North Africa, which heavily rely on Russia and Ukraine for food and fertilizer supply.
Several central banks responded to unrelenting inflation during March. The Federal Reserve raised its benchmark interest rate by 25 basis points (bps) for the first time since 2018. It also took a more hawkish tone than previously expected, leading to a selloff in Treasuries and briefly inverting portions of the yield curve. The Bank of England continued its path of 25 bp rate hikes but, considering the increased hardships due to the war in Ukraine, softened its tone on the pace of future hikes. The European Central Bank (ECB) announced plans for a faster reduction in asset purchases this year, but kept interest rates unchanged. Japan was a notable outlier, where the Bank of Japan (BOJ) remained firmly committed to being accommodative and keeping rates low.
Two years since the onset of the COVID-19 pandemic, portions of Europe, Southeast Asia, and Oceania are still struggling to contain the virus, and China is grappling with its highest case counts to date despite its “Zero-COVID” policy. Investors were not only concerned about the economic impact from China’s zero-tolerance policy, but also about strained US-China relations. However, Chinese officials vowed to stabilize financial markets and support economic growth by introducing supportive policy changes.
Equities
US equities declined for the quarter for just the second time since 2018 and underperformed developed ex US peers, but outperformed emerging markets counterparts. Small caps and tech stocks briefly fell into bear market territory but finished well above intra-quarter lows. Meanwhile, large caps dipped into correction territory before regaining momentum in the second half of March to finish the quarter just 6.0% below the all-time highs. Nine of 11 S&P 500 Index sectors declined, led down by cyclicals and tech-heavy communication services, consumer discretionary, and information technology. Defensive sectors and those better positioned to pass higher prices on to consumers were top performers; consumer staples declined the least, and utilities and energy—which had its largest quarterly gain since at least 1945—advanced. Large caps and value stocks held up better than small-cap and growth equivalents, although all four style and size benchmarks declined.
S&P 500 earnings remained resilient in fourth quarter 2021, growing 31% year-over-year, albeit from depressed earnings levels due to the negative impact of COVID-19 restrictions in 2020. However, looking forward, 70% of S&P 500 companies with first quarter 2022 estimates have issued negative guidance, which is above the five-year average of 60%, and marks the third consecutive quarter of rising negative guidance. Consumer and producer inflation reached multi-decade highs of 7.9% and 10.0% year-over-year, respectively, in February. Despite the strong upward pressures on prices, economic data generally showed signs of strength throughout the quarter. Preliminary March purchasing managers’ indexes (PMIs) indicated business activity in the services and manufacturing sectors expanded at an accelerating rate, defying expectations for a decline. Fourth quarter real GDP grew at a 6.9% annualized rate, its second highest rate since 2000.
European equities fell and trailed broader developed markets in aggregate but returns diverged significantly between the United Kingdom and continental Europe. Europe ex UK stocks, which were the bottom-performing developed economy, trailed UK counterparts, which advanced, by the widest margin since 1987. European earnings per share (EPS) grew 47% year-over-year in fourth quarter, led by 354% growth rate in the energy sector, and 64% of European companies beat EPS estimates, markedly higher than the historical median of 55%.
Eurozone economic data released in March were mixed. Fourth quarter GDP growth was a tepid 0.3% quarter-on-quarter, January retail sales barely expanded, and economic confidence declined more than expected in March. Still, preliminary March PMIs indicated manufacturing and services expanded, albeit at a slower rate. Headline inflation rose faster than anticipated to reach a record 7.5% reading in March, but core measures of inflation remained relatively subdued compared to those in the United States and the United Kingdom. ECB President Christine Lagarde noted that Russia’s invasion of Ukraine created “a major shock” to the Eurozone economy, and reassured investors the central bank would remain flexible “to pursue price stability and to safeguard financial stability.” The ECB confirmed that its pandemic-era bond buying program would conclude at the end of March and announced an accelerated timeline for winding down its older bond-buying program later this year. The bank left interest rates unchanged and noted that any adjustments would take place “some time after” asset purchases end.
UK economic data were similarly mixed. Preliminary March PMIs indicated services expanded faster than expected and January industrial production increased more than forecast, but retail sales disappointed and manufacturing activity expanded slower than estimated. Fourth quarter real GDP grew 1.3% quarter-on-quarter, besting estimates.
Japanese equities declined again in first quarter but outperformed broader developed markets. However, in major currency terms, Japan equities lagged as the yen depreciated to a nearly seven-year low against the US dollar. The steep fall in yen came as the BOJ acted on its commitment to economic stimulus, in sharp contrast to the theme of policy tightening embraced by other major central banks. The ten-year Japanese Government Bond (JGB) neared the upper limit of the BOJ’s target interest rate band for the first time since it began its ongoing Yield Curve Control (YCC) policy in 2016. The central bank responded by aggressively buying an “unlimited” amount of ten-year JGBs to keep a lid on rates and support its YCC regime. Consequently, the relative value of Japanese yen tumbled. In economic news, fourth calendar-quarter GDP grew at an annualized rate of 4.6%, falling short of preliminary expectations, retail sales declined more than anticipated in February, and inflation remained well below the BOJ’s target. Japanese fourth calendar-quarter EPS grew 10% year-over-year, marking the fifth consecutive quarter of double-digit EPS growth.
Pacific ex Japan equities advanced and were a top-performing major developed market in first quarter. Relative to broad developed markets, New Zealand lagged, Hong Kong and Singapore declined but outperformed, and Australia advanced. Australian equities benefitted from a combined weight of nearly 60% in materials and financials, which both exhibited solid gains. New Zealand suffered due to its highly concentrated market, where healthcare companies—which make up about 40% of the index—experienced significant declines.

Sources: MSCI Inc. and Thomson Reuters Datastream. MSCI data provided “as is” without any express or implied warranties.
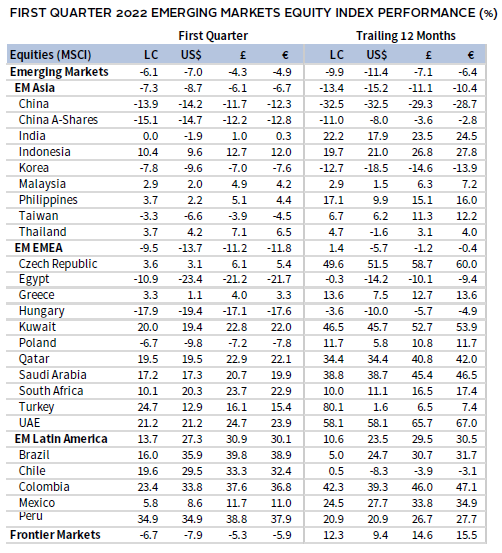
Emerging markets equities declined and trailed their developed markets peers for the fifth consecutive quarter. Emerging Europe, the Middle East & Africa and emerging Asia trailed the broad index, while Latin America, boosted by double-digit gains in four of its five country constituents, advanced. Among major emerging markets countries, China and Korea lagged, Taiwan topped the broader index but declined, India was flat, and South Africa, Brazil, and Saudi Arabia advanced. Russian equities were removed from all major benchmarks at a valuation of zero in March as sanctions resulting from the country’s invasion of Ukraine made them effectively uninvestable. Excluding Russian stocks for the entire quarter, emerging equities outperformed developed equivalents.
Chinese equities have declined 44% from their peak in mid-February 2021. Domestic China A-Shares held up better over that period, down only 23%, but are nonetheless in bear market territory. Three ongoing issues have pressured Chinese stocks—US delisting concerns, increasing COVID-19 cases and associated lockdowns, and risks surrounding potential sanctions stemming from China’s support for Russia. Equities were briefly down more than 50% in mid-March after the People’s Bank of China unexpectedly held its medium-term lending facility (MLF) rate unchanged and injected a net 100B yuan into the MLF to support banking system liquidity. However, markets quickly rebounded after Vice-Premier Liu He assured investors the central government would implement policies to boost the economy and stock market. Official March PMI data indicated manufacturing and services sectors both contracted in March for the first time in several months, resulting in part from lockdowns related to the worsening COVID-19 outbreak.
Sources: MSCI Inc. and Thomson Reuters Datastream. MSCI data provided “as is” without any express or implied warranties.
Fixed Income
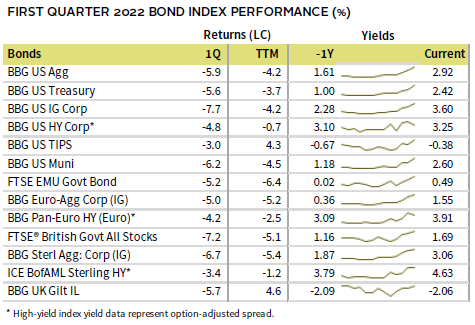
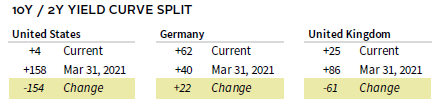
US fixed income assets sank in first quarter, experiencing their worst quarterly decline since 1980, as interest rates rose across maturities. US high-yield bonds held up better than investment-grade corporate equivalents, which lagged US Treasuries. Five- and ten-year Treasury yields rose 116 bps and 80 bps to 2.42% and 2.32%, respectively. The ten-year/two-year yield curve spread briefly inverted and finished the quarter at 4 bps. US Treasury liquidity deteriorated to its lowest level since the onset of the COVID-19 pandemic, driving concerns over the market’s ability to function normally, particularly as the Fed is poised to further tighten monetary policy. US TIPS declined the least among major bond categories as the ten-year breakeven inflation rate briefly topped 3.00% for the first time on record since 1997. Tax-exempt municipal bonds trailed nominal Treasuries.
All major European fixed income assets sold off. Among UK categories, corporate bonds declined less than gilts, high-yield corporates bested investment-grade peers, and linkers topped nominal gilts. Five- and ten-year gilt yields rose 67 bps and 65 bps to 1.43% and 1.63%, respectively. Euro-denominated corporate bonds held up better than EMU government bonds, while pan-euro high-yield bested investment-grade corporate equivalents. The German ten-year bund yield rose 73 bps to 0.55%, touching its highest reading in four years.

Sources: Bank of England, Bloomberg Index Services Limited, Federal Reserve, FTSE Fixed Income LLC, FTSE International Limited, Intercontinental Exchange, Inc., and Thomson Reuters Datastream.
Real Assets
Commodity futures advanced by the most in more than 30 years, boosted by double-digit gains in agriculture, industrial metals, and energy, which advanced nearly 50%.
Oil prices ($107.91 for Brent and $100.28 for WTI) spiked to their highest levels since 2008, with Brent briefly peaking around $140/bbl. Brent and WTI have advanced nearly 70% over the last year. Supply constraint risks from Russia’s invasion of Ukraine, resulting sanctions, and Russia’s recent insistence on being paid in rubles for gas deliveries to Europe have significantly worsened the potential energy crisis facing European nations and supported higher global energy prices. However, several actions helped alleviate price pressures from highs reached in March, including European nations striking deals with Qatar and the United States to import more of their liquified natural gas, Germany and Austria taking steps toward potential gas rationing to preserve its supplies, and the United States announcing plans to release 180 million barrels of oil from its strategic petroleum reserve.
Global natural resource equities and energy MLPs also delivered among the top returns of any major asset class, boosted by energy prices and strong earnings and revenue results.
Global developed REITs declined as interest rates rose and central banks continued their hawkish shift. US REITs and Europe ex UK REITs lagged, while UK REITs and developed Asia REITs declined but bested the broader index. The Federal Reserve Bank of Dallas warned the US housing market is showing signs of becoming “unhinged from fundamentals” for the first time since 2007.
Gold advanced to $1,941.15/troy ounce, its strongest gain in six quarters, boosted by safe-haven demand and inflationary fears.

Sources: Alerian, Bloomberg L.P., EPRA, FTSE International Limited, Intercontinental Exchange, Inc., MSCI Inc., National Association of Real Estate Investment Trusts, Standard & Poor’s, and Thomson Reuters Datastream. MSCI data provided “as is” without any express or implied warranties.
Note: Gold performance based on spot price return.
USD-Based Investors
Most global assets declined in first quarter as volatility returned to markets, stoked in large part by Russia’s invasion of Ukraine. Commodities, boosted by double-digit gains in agriculture, industrial metals, and energy, were the top performer; safe-haven gold also advanced. US equities declined, but topped developed ex US peers; domestic large caps bested small caps. Developed equities bested emerging equivalents for the quarter and outperformed by more than 20 percentage points (ppts) over the last 12 months. Among domestic fixed income categories, US high-yield bonds held up better than investment-grade corporate equivalents, which were the bottom- performing major asset class this quarter. US Treasuries experienced their worst ever single-quarter decline, trailing TIPS but besting tax-exempt municipal bonds.
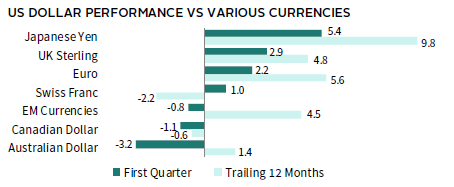
The US dollar was mixed in first quarter, declining versus the commodity-linked Australian and Canadian dollars and our basket of EM currencies, and gaining the most against the Japanese yen—which fell to a nearly seven-year low versus the dollar—UK sterling, and the euro. Over the last 12 months, the greenback broadly gained, declining only vis-à-vis the Swiss franc and Canadian dollar.
S&P 500 earnings remained resilient in fourth quarter 2021, growing 31% year-over-year, albeit from depressed earnings levels due to the negative impact of COVID-19 restrictions in 2020. Consumer and producer inflation reached multi-decade highs of 7.9% and 10.0% year-over-year, respectively, in February. Despite high inflation, economic data generally showed signs of strength throughout the quarter. Preliminary March PMIs indicated business activity in the services and manufacturing sectors expanded at an accelerating rate, defying expectations for a decline. Fourth quarter real GDP grew at a 6.9% annualized rate, its second highest rate since 2000.

Sources: Bloomberg Index Services Limited, FTSE International Limited, Frank Russell Company, Intercontinental Exchange, Inc., J.P. Morgan Securities, Inc., MSCI Inc., National Association of Real Estate Investment Trusts, Standard & Poor’s, and Thomson Reuters Datastream. MSCI data provided “as is” without any express or implied warranties.
EUR-Based Investors
Most global assets declined in first quarter as volatility returned to markets, stoked in large part by Russia’s invasion of Ukraine. Commodities, boosted by double-digit gains in agriculture, industrial metals, and energy, were the top performer; safe-haven gold also advanced. Europe ex UK equities declined and trailed DM ex EMU peers; continental European large/mid caps bested European small caps, which were the bottom-performing major asset class. Developed equities bested emerging equivalents for the quarter and outperformed by more than 20 ppts over the last 12 months. Among European fixed income categories, Euro-denominated corporate bonds held up better than EMU government bonds, while pan-euro high-yield bested investment-grade corporate equivalents.
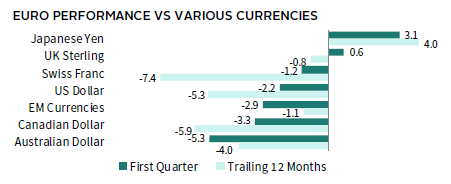
The euro mostly declined in first quarter, gaining only vis-à-vis the Japanese yen and UK sterling, and declining the most versus the commodity-linked Australian and Canadian dollars, and our basket of EM currencies. Over the trailing 12-month period, the euro appreciated only versus the Japanese yen, and declined the most vis-à-vis the Swiss franc, and Canadian and US dollars.
Eurozone economic data released in March were mixed. Fourth quarter GDP growth was a tepid 0.3% quarter-on-quarter, January retail sales barely expanded, and economic confidence declined more than expected in March. Still, preliminary March PMIs indicated manufacturing and services expanded and held up better than expected. Record headline inflation rose faster than expected to 7.5% in March, but core measures of inflation remained relatively subdued compared to the United States and the United Kingdom.

Bloomberg Index Services Limited, EPRA, European Banking Federation, FTSE Fixed Income LLC, FTSE International Limited, Intercontinental Exchange, Inc., J.P. Morgan Securities, Inc., MSCI Inc., National Association of Real Estate Investment Trusts, Standard & Poor’s, and Thomson Reuters Datastream. MSCI data provided “as is” without any express or implied warranties.
GBP-Based Investors
Most global assets declined in first quarter as volatility returned to markets, stoked in large part by Russia’s invasion of Ukraine. Commodities, boosted by double-digit gains in agriculture, industrial metals, and energy, were the top performer; safe-haven gold and UK equities also advanced. UK large caps bested UK mid caps, which were the bottom-performing asset class. Domestic equities outpaced developed markets ex UK and Europe ex UK peers. Emerging markets equities trailed developed equivalents, and lagged by more than 20 ppts over the trailing 12-month period. Among UK fixed income categories, corporate bonds declined less than gilts, high-yield corporates bested investment-grade peers, and linkers topped nominal gilts.
UK sterling mostly depreciated in first quarter, gaining only vis-à-vis the Japanese yen, and declining the most versus the commodity-linked Australian and Canadian dollars, and our basket of EM currencies. Over the last 12 months, UK sterling advanced only versus the Japanese yen and euro, and declined the most vis-à-vis the Swiss franc, and Canadian and US dollars.
UK economic data were mixed. Preliminary March PMIs indicated services expanded faster than expected and January industrial production increased more than forecast, but retail sales disappointed and manufacturing activity expanded slower than estimated. Fourth quarter real GDP grew 1.3% quarter-on-quarter, besting estimates.


Sources: Bloomberg Index Services Limited, EPRA, FTSE International Limited, Intercontinental Exchange, Inc., J.P. Morgan Securities, Inc., MSCI Inc., National Association of Real Estate Investment Trusts, Standard & Poor’s, and Thomson Reuters Datastream. MSCI data provided “as is” without any express or implied warranties.
Performance Exhibits
All data are total returns unless otherwise noted. Total return data for all MSCI indexes are net of dividend taxes.
USD-Based Investors index performance chart includes performance for the Bloomberg US Aggregate Bond, Bloomberg US Corporate Investment Grade, Bloomberg US High Yield Bond, Bloomberg Municipal Bond, Bloomberg US TIPS, Bloomberg US Treasuries, ICE BofAML 91-Day Treasury Bills, FTSE® NAREIT All Equity REITs, J.P. Morgan GBI-EM Global Diversified, LBMA Gold Price, MSCI Emerging Markets, MSCI World, Russell 2000®, S&P 500, and S&P GSCI™ indexes.
EUR-Based Investors index performance chart includes performance for the Bloomberg Euro-Aggregate: Corporate, Bloomberg Pan-Euro High Yield (Euro), EURIBOR 3M, FTSE EMU Govt Bonds, FTSE Euro Broad Investment-Grade Bonds, FTSE® EPRA/NAREIT Europe ex UK RE, J.P. Morgan GBI-EM Global Diversified, LBMA Gold Price AM, MSCI Emerging Markets, MSCI Europe, MSCI Europe ex UK, MSCI Europe Small-Cap, MSCI World ex EMU, MSCI World, and S&P GSCI™ indexes.
GBP-Based Investors index performance chart includes performance for the Bloomberg Sterling Aggregate: Corporate Bond, Bloomberg Sterling Index-Linked Gilts, ICE BofAML Sterling High Yield, FTSE® 250, FTSE® All-Share, FTSE® British Government All Stocks, FTSE® EPRA/NAREIT UK RE, J.P. Morgan GBI-EM Global Diversified, LBMA Gold Price AM, LIBOR 3M GBP, MSCI Emerging Markets, MSCI Europe ex UK, MSCI World, MSCI World ex UK, and S&P GSCI™ indexes.
EM currencies is an equal-weighted basket of 20 emerging markets currencies.
Fixed Income Performance Table
Performance data for US TIPS reflect the Bloomberg US TIPS Index, with yields represented by the Bloomberg Global Inflation Linked Bond Index: US.