Global equity markets advanced in first quarter, as developed markets equities topped emerging markets peers. Value stocks bested growth, while small caps outperformed large caps. Sovereign bond prices declined amid sharply rising yields, whereas high-yield bonds bested investment-grade equivalents. Real assets broadly gained; oil prices reached their highest levels in more than a year, boosting natural resources equities, and REITs advanced amid rising interest rates, but gold suffered its worst quarterly decline since 2016. Among major currencies, UK sterling and US dollar mostly advanced, while the euro generally declined.
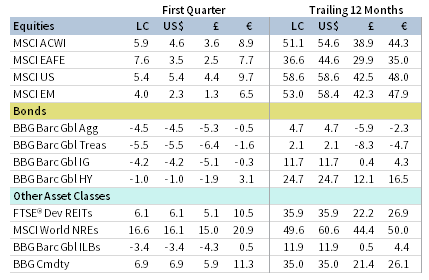
FIRST QUARTER 2021 MAJOR ASSET CLASS PERFORMANCE (%)
Sources: Bloomberg Index Services Limited, Bloomberg L.P., FTSE International Limited, MSCI Inc., and Thomson Reuters Datastream. MSCI data provided “as is” without any express or implied warranties.
Note: Local currency returns for the Bloomberg Barclays indexes, the Bloomberg Commodity Index, and the FTSE® Developed REITs are in USD terms.
The Macro Picture
Just one year ago, the emergence of the COVID-19 pandemic sent shockwaves through financial markets and led to a historic recession. By first quarter 2021, the narrative was entirely different. As the outlook for global growth continued to improve, risk assets climbed, fueled by the swift rollout of COVID-19 vaccines and a massive US fiscal spending package. Earnings momentum rebounded along with economic activity; a large proportion of companies beat earnings estimates. Cyclically sensitive equities benefitted from the improving outlook, giving way to a style rotation with value stocks outpacing growth by the widest quarterly margin in 20 years.
Rising economic optimism and the “risk-on” investment environment presented a challenging backdrop for bonds, which sold off in first quarter as yields jumped back to pre-pandemic levels. Investors grew nervous about the inflationary pressures that could stem from a rapid economic recovery and record money printing. Indeed, the US ten-year breakeven inflation rate reached its highest level since 2013. Despite these worries, US Federal Reserve officials didn’t appear overly concerned with inflation risks. The central bank signaled plans to remain accommodative until the economic recovery—and specifically, job market recovery—is complete.
Two extraordinary market speculation themes grabbed headlines in first quarter. First, multiple short squeezes catalyzed by retail investors led to extreme volatility in a few stocks, most notably Gamestop. Second, a massive margin call on the highly levered investment vehicle of a former hedge fund manager also created major volatility for several Chinese and US-based media companies. Still, the contagion from these events appeared limited at quarter end.
Equities
US equities advanced and outperformed developed ex US peers in major currency terms in first quarter. All 11 S&P 500 Index sectors gained, led by energy—which climbed more than 30% as oil prices advanced to their highest levels in more than a year—financials, and industrials. Consumer staples, information technology, and utilities lagged the most. Information technology was a notable laggard as investors priced in growing risks from faster inflation and rising long-term interest rates. Value stocks bested growth counterparts by the widest margin since 2001, while small caps topped large caps for the third time in the last four quarters; small caps have outpaced large caps by 34.3 percentage points (ppts) during that time span. S&P 500 Index quarterly earnings advanced 4% year-over-year in fourth quarter 2020, marking the first positive quarterly earnings result since fourth quarter 2019. Looking ahead, analysts expect first quarter 2021 earnings to grow by 23%, and calendar year 2021 earnings to increase by 25%, rebounding from the 11% decline in full year 2020.
The US economy grew at a 4.3% annualized rate in fourth quarter, topping earlier projections. Manufacturing and services PMIs reached well into expansionary territory as locales eased lockdown restrictions and domestic vaccine rollouts accelerated. Congress passed a $1.9 trillion relief bill in March. Later, President Joe Biden announced an additional $2 trillion infrastructure and jobs package that includes steep tax increases on corporations. Fed Chairman Powell told Congress there is “hope for a return to more normal conditions” in 2021, but re-affirmed the central bank intends to continue its steadfast support for the US economy.
European equities trailed broader developed markets stocks in major currency terms in first quarter. Europe ex UK stocks lagged UK, which was the top performer among major developed markets economies in major currency terms.
Continental Europe continued to experience a two-speed economic recovery. Manufacturing has driven the recovery while services remain burdened by ongoing COVID-19–related regulations, slow vaccine rollouts, and various lockdown measures amid a third wave of infections. Eurozone manufacturing PMI rose strongly further into expansionary territory throughout the quarter, where it has resided for the past nine months. The growth was broad-based, led by Germany and the Netherlands, which reached their highest manufacturing PMI levels on record. However, difficulty sourcing raw materials and surging lead times led to major supply constraints, sending producer price inflation to its highest level in ten years. Eurozone services PMI data remained in contractionary territory, but improved in March. Eurozone GDP declined 0.7% quarter-over-quarter in fourth quarter, marking a return to negative growth. Similarly, fourth quarter European earnings fell 18% year-on-year, the fourth consecutive quarter of negative earnings growth.
The United Kingdom continued to lead all major economies with its vaccination efforts, having provided nearly half of the country’s population with at least one dose. Prime Minister Boris Johnson revealed a timetable for lifting domestic lockdowns, and consumer confidence rose to its highest level since February of last year. Services PMI improved to expansionary territory in March, and manufacturing PMI remained firmly in expansionary territory. UK GDP grew 1.3% quarter-over-quarter in fourth quarter, beating expectations.
Japanese equities advanced but lagged all other major developed markets stocks in major currency terms in first quarter. Prime Minister Yoshihide Suga announced an early easing of the state of emergency restrictions that were put in place to quell surging COVID-19 cases in January. Manufacturing PMI moved into expansionary territory, but remains low relative to other major developed economies, while services PMI fell further into contractionary territory amid the strict lockdowns. Japanese GDP grew 11.7% annualized in fourth calendar-quarter, although full calendar-year 2020 GDP declined 1.4% compared to 2019. Japanese equities EPS grew 12% year-on-year in fourth calendar quarter, its first positive earnings growth since calendar third quarter 2018.
Pacific ex Japan equities advanced but trailed broader developed markets. Singapore and Hong Kong outgained the broader index, while Australia and New Zealand lagged. Standard & Poor’s raised New Zealand’s sovereign credit rating in February, making it the first developed nation with an investment-grade rating to receive an upgrade since the beginning of the COVID-19 outbreak, and the Reserve Bank of New Zealand announced it was easing restrictions on dividend payments by retail banks due to better-than-expected recovery. The Reserve Bank of Australia (RBA) boosted its bond buying program by an unscheduled AU$3 billion purchase, followed by an unusually large AU$4 billion of scheduled purchases, helping to taper rising interest rates in Australia back down toward the RBA’s target. RBA Governor Philip Lowe reaffirmed that the central bank remains committed to “stimulatory monetary conditions,” noting he does not expect the economy to reach full employment until at least 2024.
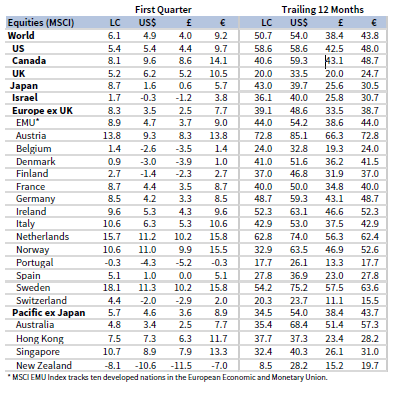
FIRST QUARTER 2021 DEVELOPED MARKETS EQUITY INDEX PERFORMANCE (%)
Sources: MSCI Inc. and Thomson Reuters Datastream. MSCI data provided “as is” without any express or implied warranties.
Emerging markets equities advanced in first quarter, trailing developed markets counterparts and bringing trailing 12-month outperformance down to 2.3 ppts. Among regions, emerging Europe, the Middle East & Africa outperformed, and heavily weighted emerging Asia and Latin America trailed. South Africa and Taiwan were the top-performing major countries; Korea and India also outpaced the broader index, while China and Brazil declined.
Brazil declined in part due to a sustained increase in COVID-19 cases throughout first quarter, overtaking the United States for the highest average daily new cases worldwide. The Banco Central do Brasil announced a higher-than-expected 75 basis point (bp) rate hike in late March amid fears of rising inflation—its first rate hike in nearly six years. Central banks in other emerging markets, such as Russia and Turkey, also raised interest rates on inflation fears.
Chinese equities declined slightly in first quarter as the country’s robust recovery showed signs of cooling. Manufacturing and non-manufacturing PMIs declined to near contractionary territory on softer domestic demand. China’s central bank drained money from the financial system ahead of the Lunar New Year—an unusual move ahead of a holiday that usually sees the central bank inject liquidity—as fears of rising asset bubbles led the People’s Bank of China to strike a balance between supporting the recovery and reducing risk. Still, the country posted a 6.5% fourth quarter year-on-year GDP growth rate, well above growth rates in other major economies, and other underlying economic indicators such as foreign direct investment and exports remain supportive of growth. The Chinese Communist Party met in early March for the “two sessions” where the political elite shape the details of economic policy for the near future, targeting more than 6% GDP growth for 2021.
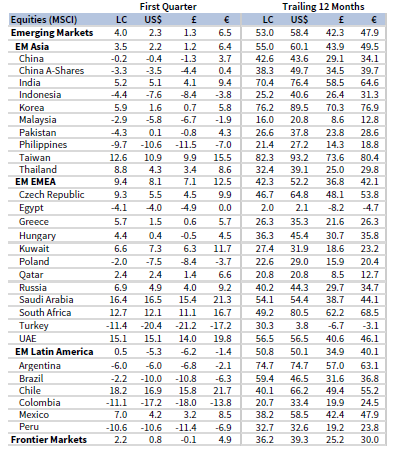
FIRST QUARTER 2021 EMERGING MARKETS EQUITY INDEX PERFORMANCE (%)
Sources: MSCI Inc. and Thomson Reuters Datastream. MSCI data provided “as is” without any express or implied warranties.
Fixed Income
US investment-grade bonds declined in first quarter by the most since 1981 as long-term government bond yields rose to their highest levels in more than a year. US investment-grade corporates trailed Treasuries, although both declined in value; US high-yield bonds advanced and credit spreads declined. Five- and ten-year Treasury yields increased 56 and 81 bps to 0.92% and 1.74%, respectively. The widely followed ten-year/two-year yield spread rose to its highest level since July 2015, and real interest rates touched their highest levels since the initial COVID-19 restrictions were eased last June. US tax-exempt municipal bonds and TIPS declined but topped nominal Treasuries.
Sterling-denominated high-yield bonds advanced and investment-grade equivalents declined; gilts trailed investment-grade corporates. Five- and ten-year UK gilt yields gained 45 and 70 bps to 0.39% and 0.93%, respectively. UK linkers declined but bested nominal gilts.
Euro-denominated fixed income performance mirrored that of the United Kingdom. German ten-year Bund yields rose 28 bps to
-0.30%, touching their highest levels during the quarter since the onset of the pandemic.
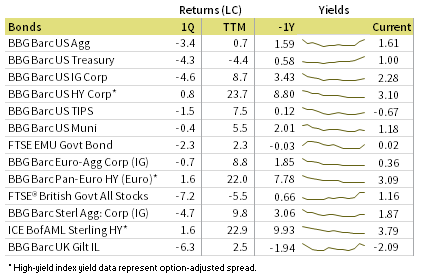
FIRST QUARTER 2021 BOND INDEX PERFORMANCE (%)
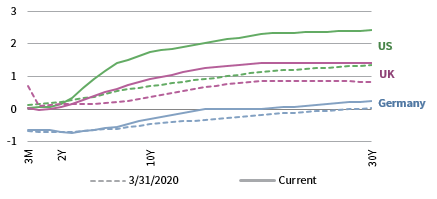
FIRST QUARTER 2021 NOMINAL YIELD CURVES
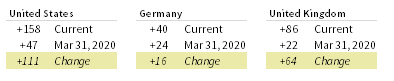
10Y/2Y YIELD CURVE SPLIT
Sources: Bank of England, Bloomberg Index Services Limited, BofA Merrill Lynch, Federal Reserve, FTSE Fixed Income LLC, FTSE International Limited, Intercontinental Exchange, Inc., and Thomson Reuters Datastream.
Real Assets
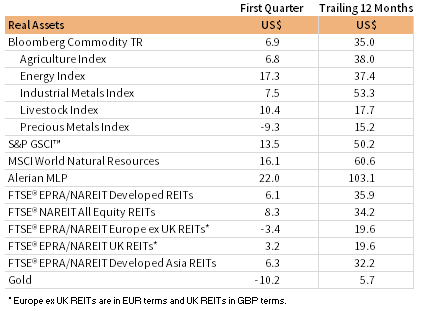
Commodity futures advanced in first quarter, led by gains in energy; precious metals was the only sub-category to decline. Copper prices touched a ten-year high on rising demand as global manufacturing continues to rebound.
Brent crude and WTI oil prices gained 23% and 22% to $63.54 and $59.16, respectively, their highest levels in more than a year, boosted by expectations of a vaccine-supported economic recovery and tighter oil supply from OPEC+ production cuts.
Rising oil prices buoyed global natural resources equities and MLPs, which also advanced by double digits. The strong gain, coupled with a low starting point near market lows after COVID-19 lockdowns began, pushed energy MLPs to a 103% gain on a trailing 12-month basis—its largest 12-month return ever.
Global developed REITs broadly advanced amid rising interest rates, but performance varied by region. US REITs, Developed Asia REITs, and UK REITs gained, and Europe ex UK REITs sold off.
Gold prices fell to $1,704.74 per troy ounce, its steepest decline since 2016. Gold is down 17% since its peak last August, but it remains up over the past 12 months.
FIRST QUARTER 2021 REAL ASSETS PERFORMANCE (%)
Sources: Alerian, Bloomberg L.P., EPRA, FTSE International Limited, Intercontinental Exchange, Inc., MSCI Inc., National Association of Real Estate Investment Trusts, Standard & Poor’s, and Thomson Reuters Datastream. MSCI data provided “as is” without any express or implied warranties.
Notes: Total return data for all MSCI indexes are net of dividend taxes. Gold performance based on spot price return.
USD-Based Investors
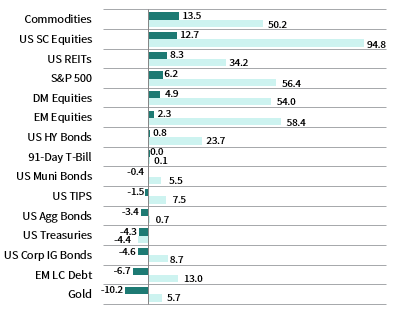
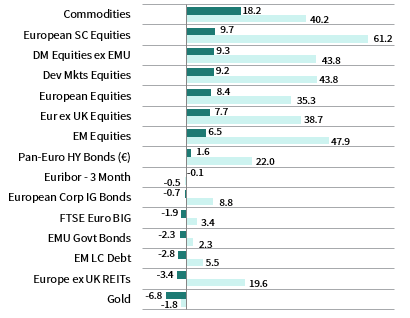
Pro-cyclical assets broadly outperformed in first quarter, led by commodities and equities. US small caps outgained large caps, although both were top performers. US equities topped developed markets equivalents, which in turn bested emerging markets equities peers. All four equity classes—US large cap, US small cap, developed markets, and emerging markets—experienced substantial returns over the last 12 months.
Commodities were the top-performing asset class, boosted by strong gains in energy. US investment-grade corporates underperformed Treasuries, although both declined in value amid rising interest rates; US high-yield bonds advanced and credit spreads declined. Gold was the bottom-performing asset class in first quarter, experiencing its steepest decline since 2016.
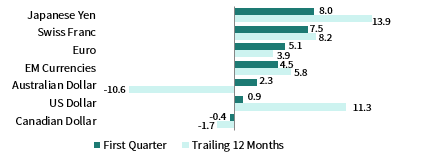
The US dollar mostly advanced, declining only vis-à-vis UK sterling and the Canadian dollar, and advancing the most versus the safe-haven Japanese yen and Swiss franc. The greenback has weakened significantly over the past 12 months, particularly versus the Australian and Canadian dollars, and UK sterling.
Congress passed a $1.9 trillion relief bill in March, and later in the month President Joe Biden announced an additional $2 trillion infrastructure and jobs package that includes steep tax increases on corporations, aimed at supporting both short- and long-term economic growth. Fed Chairman Jerome Powell told Congress there is “hope for a return to more normal conditions” in 2021, but re-affirmed the central bank intends to continue its steadfast support for the US economy.
INDEX PERFORMANCE (US$)
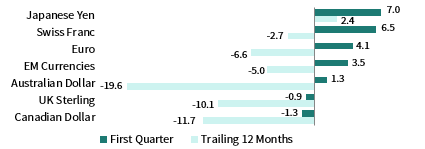
US DOLLAR PERFORMANCE VS VARIOUS CURRENCIES
Sources: Bloomberg Index Services Limited, FTSE International Limited, Frank Russell Company, Intercontinental Exchange, Inc., J.P. Morgan Securities, Inc., MSCI Inc., National Association of Real Estate Investment Trusts, Standard & Poor’s, and Thomson Reuters Datastream. MSCI data provided “as is” without any express or implied warranties.
EUR-Based Investors
Pro-cyclical assets broadly outperformed in first quarter, led by commodities and equities. European small caps outgained large caps and were the top-performing asset class over the last 12 months. European equities trailed developed markets equivalents, but outgained emerging markets peers. Europe ex UK stocks lagged UK equivalents.
Commodities were the top-performing asset class, boosted by strong gains in energy. European investment-grade corporates outperformed EMU government bonds, although both declined in value amid rising interest rates; pan-Euro high-yield bonds advanced and credit spreads declined. Gold was the bottom-performing asset class in first quarter, experiencing its steepest decline since 2016.
The euro mostly declined, falling the most vis-à-vis the Canadian dollar, UK sterling, and the US dollar, and advancing versus only the safe-haven Japanese yen and Swiss franc. The euro is mixed over the past 12 months, advancing the most versus Japanese yen and the US dollar, and declining the most vis-à-vis the Australian and Canadian dollars.
Continental Europe continued to experience a two-speed economic recovery. Manufacturing has driven the recovery while services remain burdened by ongoing COVID-19–related regulations, slow vaccine rollouts, and various lockdown measures amid a third wave of infections. Eurozone manufacturing PMI rose strongly further into expansionary territory throughout the quarter, where it has resided for the past nine months. However, Eurozone services PMI data remained in contractionary territory, but improved in March.
INDEX PERFORMANCE (€)
EURO PERFROMANCE VS VARIOUS CURRENCIES
Sources: Bloomberg Index Services Limited, EPRA, European Banking Federation, FTSE Fixed Income LLC, FTSE International Limited, ICE Benchmark Administration Ltd., J.P. Morgan Securities, Inc., MSCI Inc., National Association of Real Estate Investment Trusts, Standard & Poor’s, and Thomson Reuters Datastream.
GBP-Based Investors
Pro-cyclical assets broadly outperformed in first quarter, led by commodities and equities. UK mid caps outgained large caps and were the top-performing asset class over the last 12 months. UK equities topped developed markets equivalents, which in turn bested emerging markets equities peers. UK stocks outperformed Europe ex UK equivalents.
Commodities were the top-performing asset class, boosted by strong gains in energy. UK investment-grade corporates outperformed UK gilts, although both declined in value amid rising interest rates; UK high-yield bonds advanced and credit spreads declined. Gold was the bottom-performing asset class in first quarter, experiencing its steepest decline since 2016.
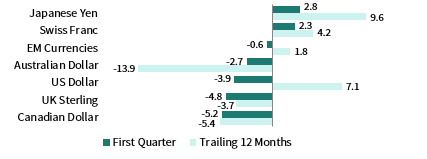
UK sterling broadly advanced, appreciating the most vis-à-vis the safe-haven Japanese yen and Swiss franc, as well as the euro, and declining versus only the Canadian dollar. Pound sterling is also mostly stronger over the past 12 months, gaining the most against the Japanese yen, US dollar, swiss franc, and declining only vis-à-vis the Australian and Canadian dollars.
The United Kingdom continued to lead all major economies with its vaccination efforts, having provided nearly half of the country’s population with at least one dose. Prime Minister Boris Johnson revealed a timetable for lifting domestic lockdowns, and consumer confidence rose to its highest level since February of last year. Services PMI improved to expansionary territory in March, and manufacturing PMI remained firmly in expansionary territory.
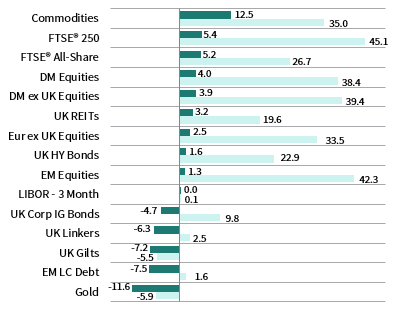
INDEX PERFORMANCE (£)
POUND STERLING PERFORMANCE VS VARIOUS CURRENCIES
Sources: Bloomberg Index Services Limited, EPRA, FTSE International Limited, Intercontinental Exchange, Inc., ICE Benchmark Administration Ltd., J.P. Morgan Securities, Inc., MSCI Inc., National Association of Real Estate Investment Trusts, Standard & Poor’s, and Thomson Reuters Datastream.
Performance Exhibits
All data are total returns unless otherwise noted. Total return data for all MSCI indexes are net of dividend taxes.
USD-Based Investors index performance chart includes performance for the Bloomberg Barclays US Aggregate Bond, Bloomberg Barclays US Corporate Investment Grade, Bloomberg Barclays US High Yield Bond, Bloomberg Barclays Municipal Bond, Bloomberg Barclays US TIPS, Bloomberg Barclays US Treasuries, ICE BofAML 91-Day Treasury Bills, FTSE® NAREIT All Equity REITs, J.P. Morgan GBI-EM Global Diversified, LBMA Gold Price, MSCI Emerging Markets, MSCI World, Russell 2000®, S&P 500, and S&P GSCI™ indexes.
EUR-Based Investors index performance chart includes performance for the Bloomberg Barclays Euro-Aggregate: Corporate, Bloomberg Barclays Pan-Euro High Yield (Euro), EURIBOR 3M, FTSE EMU Govt Bonds, FTSE Euro Broad Investment-Grade Bonds, FTSE® EPRA/NAREIT Europe ex UK RE, J.P. Morgan GBI-EM Global Diversified, LBMA Gold Price AM, MSCI Emerging Markets, MSCI Europe, MSCI Europe ex UK, MSCI Europe Small-Cap, MSCI World ex EMU, MSCI World, and S&P GSCI™ indexes.
GBP-Based Investors index performance chart includes performance for the Bloomberg Barclays Sterling Aggregate: Corporate Bond, Bloomberg Barclays Sterling Index-Linked Gilts, ICE BofAML Sterling High Yield, FTSE® 250, FTSE® All-Share, FTSE® British Government All Stocks, FTSE® EPRA/NAREIT UK RE, J.P. Morgan GBI-EM Global Diversified, LBMA Gold Price AM, LIBOR 3M GBP, MSCI Emerging Markets, MSCI Europe ex UK, MSCI World, MSCI World ex UK, and S&P GSCI™ indexes.
EM currencies is an equal-weighted basket of 20 emerging markets currencies.
Fixed Income Performance Table
Performance data for US TIPS reflect the Bloomberg Barclays US TIPS Index, with yields represented by the Bloomberg Barclays Global Inflation Linked Bond Index: US.