Capital markets enjoyed broad gains in first quarter, in contrast to a rough end to 2018. Global equities rallied to record their best quarter to start a year in over two decades. Developed markets equities outperformed emerging markets equivalents, and US stocks bested developed ex US counterparts. Meanwhile, growth outgained value and small caps edged large caps. Interest rates declined, and high-yield and investment-grade corporates outpaced global government bonds amid spread tightening. Real assets were among the top-performing asset classes, as natural resources equities, energy MLPs, and developed markets REITs experienced double-digit returns, supported by higher commodity prices and lower interest rates. Among major currencies, UK sterling gained, the US dollar was mixed, and the euro was broadly weaker.
Global risk assets excelled—despite ongoing concerns about slowing global growth and a spate of unresolved geopolitical issues. Markets were buoyed, in part, by cautious central bank policy and ostensible progress in US-China trade talks, appearing to disregard weak economic data in the Eurozone and China. At its March meeting, the US Federal Reserve held its benchmark policy rate steady as expected, but shifted to a more dovish approach by signaling no rate hikes for the remainder of 2019 and indicating plans to conclude its balance sheet runoff earlier than expected. The benchmark ten-year/three-month yield curve spread inverted shortly thereafter, generating significant market attention given its history as a reliable recession prerequisite. US President Donald Trump delayed a planned tariff increase on $200 billion of Chinese imports scheduled to go into effect on March 1, and optimism for a potential deal increased after reports that China proposed “unprecedented” concessions on forced tech transfers. The United Kingdom’s long-planned March 29 departure from the European Union was postponed as the UK Parliament’s internal deliberations spilled over into April after failing—for a third time—to ratify the Brexit deal originally tabled back in December. Fourth quarter 2018 earnings growth slowed sharply, with revisions to future earnings growth expectations skewed to the downside, but share prices generally reacted mildly to earnings misses, suggesting that investors had discounted even worse outcomes.
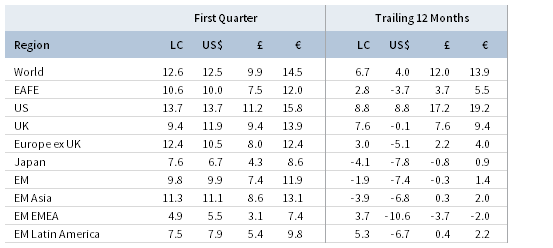
TOTAL RETURN FOR MSCI INDEXES (%)
US equities (13.6% for the S&P 500 Index) posted their best quarter to start a year in more than two decades—and the best quarter overall since 2009. All 11 S&P 500 sectors were in the black, led by information technology, real estate, and industrials; financials and healthcare were the only sectors not to experience double-digit gains. Growth equities significantly outperformed value, while small-cap stocks edged large-cap counterparts, reversing course from late last year. Fourth quarter 2018 earnings per share (EPS) grew 13% year-over-year, marking the tenth consecutive quarter of positive growth and the fifth consecutive double-digit gain; however, the rate of growth slowed to the lowest clip since third quarter 2017. Forward earnings guidance was weak this reporting season as the ratio of companies guiding higher versus lower fell to the lowest level in several quarters, yet stock prices generally rose for those companies guiding lower. Underlying macroeconomic fundamentals remained mostly positive, but consumer confidence, housing, and manufacturing data sent conflicting signals over the near-term growth outlook. Fourth quarter GDP slowed to an annualized growth rate of 2.2%, lower than preliminary expectations. Still, full-year 2018 GDP grew 2.9% as previously estimated, just shy of the Trump administration’s 3% growth target.
European equities (10.8% in USD, 12.8% in EUR, 8.3% in GBP) underperformed broader developed markets in first quarter. European corporate earnings grew an estimated 6% year-over-year in fourth quarter, marking the tenth consecutive quarter of positive EPS growth but the slowest clip since third quarter 2016. Europe ex UK and Eurozone stocks outgained UK equivalents in local currency terms, but underperformed in major currency terms as sterling rallied despite ongoing Brexit uncertainty, which has hampered UK business investment in particular. The United Kingdom’s overall 2018 GDP growth was the weakest since 2009, while the Bank of England cut its 2019 UK growth forecast to the lowest level since the global financial crisis and maintained its benchmark policy rate at 0.75%, indicating a lower likelihood of future rate rises. On the Continent, deteriorating economic data threatened growth prospects across the Eurozone. Downbeat manufacturing and trade data weighed on economic sentiment, which fell in March for the ninth month in a row. Eurozone fourth quarter GDP grew 0.2% quarter-over-quarter, as expected, but in Germany—the Eurozone’s largest economy—estimated GDP was flat, below earlier expectations, and Italy entered a technical recession in fourth quarter. Rising growth concerns led the European Central Bank to abruptly reverse course, reviving its crisis-era bank stimulus program and indicating it will keep interest rates steady until at least next year. The central bank also severely downgraded economic growth projections to just 1.1% for 2019, a decrease of 0.6% from last quarter.
Japanese equities (6.7% in USD, 8.6% in EUR, 4.3% in GBP) underperformed developed markets equivalents in first quarter in both local and major currency terms. After enjoying an eight-quarter streak of positive growth, corporate earnings fell 7% year-over-year in fourth quarter, having slowed steadily since peaking at the beginning of 2017. GDP growth turned positive at a 1.9% annualized rate, beating expectations after natural disasters caused the economy to contract in the prior quarter. Despite the promising headline growth figure, underlying data disappointed as retail sales growth and trade data were weaker than expected, manufacturing output expectations turned negative for the first time since 2012, exports shrank at their fastest pace in two years, and core inflation remained tepid. The Bank of Japan (BOJ) kept its key policy rate unchanged in March and cited weakness in exports and production as a result of slowdowns in overseas economies. The BOJ reaffirmed that its bond buying program will run for as long as necessary to reach its 2.0% core inflation target, yet the bank has continued to trim its inflation forecasts.
Emerging markets equities (9.9% in USD, 11.9% in EUR, 7.4% in GBP) lagged developed markets equivalents in first quarter. Among EM regions, emerging Asia was the top performer, followed by Latin America and emerging Europe, the Middle East & Africa. China was among the top-performing global markets of any size, and domestically listed A-shares gained 33% in USD terms, outperforming all major countries and regions year-to-date despite weakening economic signals and ongoing trade tensions. However, negotiations between US and China officials appeared to show signs of progress late in the quarter. China’s economic data releases were less promising, as manufacturing and trade data suggested worsening underlying conditions. At the opening of China’s annual legislative session last month, Premier Li Keqiang slightly lowered the government’s GDP growth target to a range of 6.0%–6.5% for 2019. The Chinese government also revealed a sizeable fiscal stimulus package in addition to further monetary policy easing. In contrast to Chinese equities’ strong results, other major emerging markets—Brazil, India, Korea, and Taiwan—underperformed the broader index. Frontier markets equities (6.9% in USD, 8.8% in EUR, 4.5% in GBP) trailed developed and emerging markets counterparts, despite strong returns from heavily weighted Kuwait and Vietnam.
Real assets broadly gained in first quarter supported by strengthening commodity prices and declining interest rates. Commodity futures advanced (6.3% for the Bloomberg Commodity TR Index and 15.0% for the energy-heavy S&P GSCI™ Index), led higher by energy and industrial metals. Oil prices ($68.39 for Brent and $60.14 for WTI) had their best quarterly gains since 2009, as US sanctions on Iran and Venezuela and greater-than-anticipated output cuts from OPEC helped to tighten supply and boost prices. Global natural resources equities (14.9% for the MSCI World Natural Resources Index in USD terms) and energy MLPs (16.8%) also benefited from higher oil prices. Global developed REITs (14.9% in USD terms) posted strong returns as central banks appeared more dovish and global yields fell. US REITs (17.2%) outperformed the broader market, while developed Asia REITs (14.5% in USD terms), Europe ex UK REITs (13.0%), and UK REITs (11.3%) lagged but also generated double-digit gains. Gold (1.1%) mildly advanced in USD terms to $1,295.72 per troy ounce.
Global fixed income gained as macroeconomic data softened and yields compressed. Riskier credits outgained sovereign bonds, as US Treasuries (2.1%) were positive amid dovish Fed statements. Five- and ten-year Treasury yields each fell 28 basis points (bps) to finish the month at 2.23% and 2.41%, respectively, and the benchmark ten-year versus three-month yield curve spread inverted temporarily toward the end of March, but did so in the absence of an inversion of the more widely followed benchmark ten-year versus two-year yield curve, which has rarely occurred in the past. UK gilts (3.4%) rallied in part on Brexit anxiety, as five-year yields fell 19 bps to 0.71% and ten-year yields fell 27 bps to 1.04%. EMU government bonds (2.5%) also gained, as ten-year German bund yields fell 32 bps to -0.07%, turning negative for the first time in two and a half years. US credit spreads tightened as high-yield (7.3%) and investment-grade (5.1%) corporate bonds strongly rebounded from fourth quarter 2018 losses and significantly outpaced Treasuries. US TIPS (3.2%) and US tax-exempt (2.9%) also bested nominal Treasuries. UK linkers (5.9%) outperformed nominal gilts.
Among major currencies, the UK sterling was broadly stronger, the US dollar was mixed, and the euro was broadly weaker. Over the past year, sterling only gained against the euro, our equal-weighted basket of EM currencies, and the Australian dollar. The US dollar gained against the euro, Swiss franc, and Japanese yen in first quarter, and is broadly stronger against all major currencies and our EM basket over the past year. The euro was broadly weaker over the trailing 12-month period, strengthening only against EM currencies.
Market Exhibits
Global earnings per share (EPS) continued to grow at an impressive double-digit pace in 2018, driven largely by a 24% gain in the United States. 2019 EPS growth forecasts have tempered across most regions, ranging from 2% to 7%, down from earlier estimates.
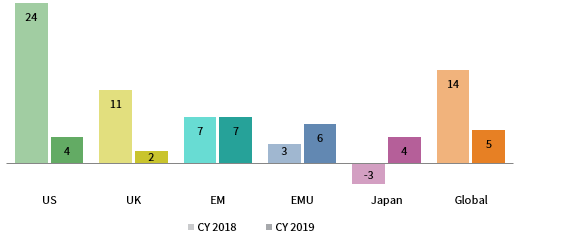
CALENDAR YEAR 2018 & 2019 EPS GROWTH ESTIMATES FOR SELECT REGIONS
As of March 31, 2019 • Percent (%)
Sources: I/B/E/S, MSCI Inc., and Thomson Reuters Datastream. MSCI data provided “as is” without any express or implied warranties.
Notes: EPS growth forecasts data are updated weekly. MSCI ACWI and EM estimates are in USD terms and reflect the impact of currency fluctuations. All other regional estimates are in local currency terms. EPS data for Japan are for their fiscal year, which runs from April 1 to March 31. Estimates are rounded to the nearest whole number.
Global composite PMI readings have declined from recent highs as the US-China trade war and slowdowns in Europe and China have sapped global growth sentiment. EMU manufacturing has deteriorated in recent quarters, dragged by the German manufacturing sector, which contracted at its fastest rate since 2012.

ROLLING 3-MONTH GLOBAL COMPOSITE PMIS
May 31, 2016 – March 31, 2019 • Percent (%)
Sources: Markit Economics and Thomson Reuters Datastream.
Notes: Composite PMI data for February 2019 are flash estimates; data for Japan and China are through January 31, 2019. A PMI reading above 50 indicates an expanding economy.
The ten-year/three-month yield curve spread inverted in late March, but ended the quarter positive. The inversion prompted concerns due to its history as a reliable recession prerequisite. This was a rare instance where the ten-year/three-month curve inverted in the absence of a ten-year/two-year curve inversion.
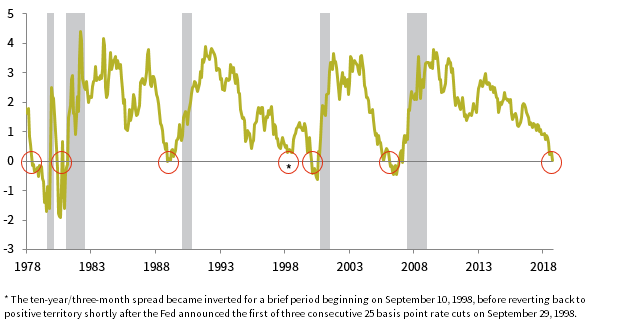
US TREASURY 10-YEAR/3-MONTH YIELD SPREAD AND RECESSIONS
June 30, 1978 – March 31, 2019 • Percent (%)
Sources: Federal Reserve, Global Financial Data, Inc., National Bureau of Economic Research (NBER), and Thomson Reuters Datastream.
Notes: Data are monthly. Gray bars represent NBER-defined US recessions. Red circles represent the ten-year/three-month inversion.
The Federal Reserve held its benchmark policy rate steady as expected, but shifted to a more dovish approach by signaling no rate hikes for the remainder of 2019. Market participants speculated over future easing, pricing in a rate cut in 2019 and potentially additional cuts beyond.
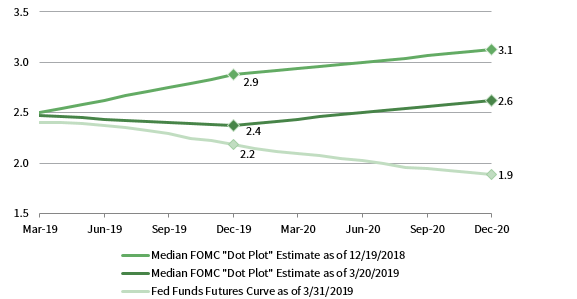
US FED FUNDS RATE EXPECTATIONS
Percent (%)
Sources: Bloomberg L.P. and Federal Reserve.
Note: Estimates are based on Federal Reserve forecasts.
Currency Performance as of March 31, 2019
The US dollar gained against the euro, Swiss franc, and Japanese yen in first quarter, and is broadly stronger against all major currencies and our equal-weighted basket of EM currencies over the trailing 12 months.
VERSUS THE US DOLLAR
Total Return (%)
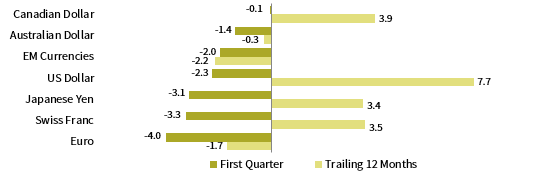
The euro weakened against all major currencies and our basket of EM currencies in first quarter. Over the trailing 12 months, the euro is weaker vis-à-vis all but EM currencies.

VERSUS THE EURO
Total Return (%)
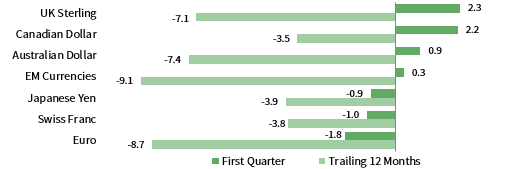
UK sterling was broadly stronger in first quarter, gaining against all major currencies. In contrast, over the trailing 12 months sterling gained only against EM currencies, the euro, and the Australian dollar.
VERSUS THE POUND STERLING
Total Return (%)
Note: EM currencies is an equal-weighted basket of 20 currencies.
USD Market Performance as of March 31, 2019
Real assets and equities were top performers in first quarter. Domestic small-cap stocks outperformed large-caps, and US equities outgained developed ex US and emerging equivalents. Bonds also advanced, led by high-yield and investment-grade corporates. Cash and gold lagged.

INDEX PERFORMANCE (US$)
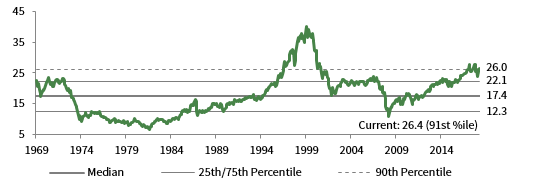
COMPOSITE NORMALIZED P/E: MSCI US
December 31, 1969 – March 31, 2019

FIXED INCOME YIELDS
March 2018 – March 2019
Sources: Bloomberg Index Services Limited, Bloomberg L.P., BofA Merill Lynch, FTSE International Limited, Frank Russell Company, J.P. Morgan Securities, Inc., MSCI Inc., National Association of Real Estate Investment Trusts, Standard & Poor’s, and Thomson Reuters Datastream. MSCI data provided “as is” without any express or implied warranties.
Euro Market Performance as of March 31, 2019
Real assets and equities outperformed in first quarter as risky assets rebounded. Developed ex EMU equities outperformed European and emerging equivalents. High-yield and investment-grade corporate bonds outpaced EMU government bonds. Cash was the sole asset class to post a negative return.

INDEX PERFORMANCE (€)
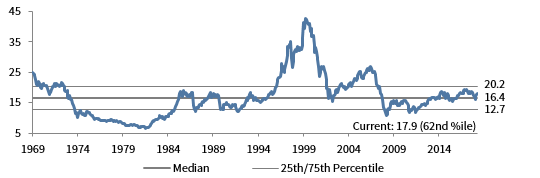
COMPOSITE NORMALIZED P/E: MSCI EUROPE EX UK
December 31, 1969 – March 31, 2019
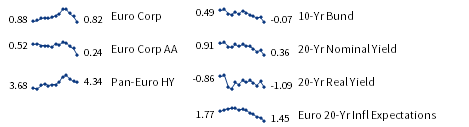
FIXED INCOME YIELDS
March 2018 – March 2019
Sources: Bloomberg Index Services Limited, Bloomberg L.P., Citigroup Global Markets, EPRA, FTSE International Limited, J.P. Morgan Securities, Inc., MSCI Inc., National Association of Real Estate Investment Trusts, Standard & Poor’s, and Thomson Reuters Datastream. MSCI data provided “as is” without any express or implied warranties.
GBP Market Performance as of March 31, 2019
Real assets and equities were top performers in first quarter. Developed ex UK equities outgained UK equities, and UK mid caps bested large and small caps. UK linkers led bond returns; UK high-yield and investment-grade corporates bested gilts. Cash and gold lagged as investors favored riskier assets.
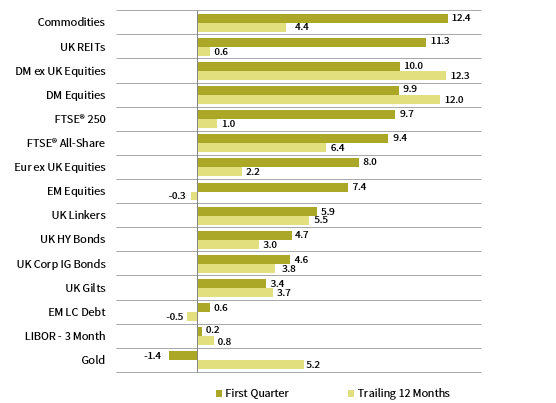
INDEX PERFORMANCE (₤)

COMPOSITE NORMALIZED P/E: MSCI UK
December 31, 1969 – March 31, 2019
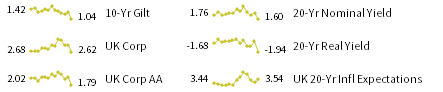
FIXED INCOME YIELDS
March 2018 – March 2019
Sources: Bloomberg Index Services Limited, Bloomberg L.P., BofA Merill Lynch, EPRA, FTSE International Limited, J.P. Morgan Securities, Inc., MSCI Inc., National Association of Real Estate Investment Trusts, Standard & Poor’s, and Thomson Reuters Datastream. MSCI data provided “as is” without any express or implied warranties.
Exhibit Notes
Performance Exhibits
Total return data for all MSCI indexes are net of dividend taxes.
US dollar index performance chart includes performance for the Bloomberg Barclays Aggregate Bond, Bloomberg Barclays Corporate Investment Grade, Bloomberg Barclays High-Yield Bond, Bloomberg Barclays Municipal Bond, Bloomberg Barclays US TIPS, Bloomberg Barclays US Treasuries, BofA Merrill Lynch 91-Day Treasury Bills, FTSE® NAREIT All Equity REITs, J.P. Morgan ELMI+, J.P. Morgan GBI-EM Global Diversified, MSCI Emerging Markets, MSCI World, Russell 2000®, S&P 500, and S&P GSCI™ indexes.
Euro index performance chart includes performance for the Bloomberg Barclays Euro-Aggregate: Corporate, Bloomberg Barclays Pan-Euro High Yield, Citigroup EMU Govt Bonds, Citigroup Euro Broad Investment-Grade Bonds, Euribor 3-month, FTSE® EPRA/NAREIT Europe ex UK, J.P. Morgan ELMI+, J.P. Morgan GBI-EM Global Diversified, MSCI Emerging Markets, MSCI Europe, MSCI Europe ex UK, MSCI Europe Small-Cap, MSCI World ex EMU, MSCI World, and S&P GSCI™ indexes.
UK sterling index performance chart includes performance for the Bloomberg Barclays Sterling Aggregate: Corporate Bond, BofA Merrill Lynch Sterling High Yield, FTSE® 250, FTSE® All-Share, FTSE® British Government All Stocks, FTSE® British Government Index-Linked All Stocks, FTSE® EPRA/NAREIT UK RE, J.P. Morgan ELMI+, J.P. Morgan GBI-EM Global Diversified, LIBOR 3M GBP, MSCI Emerging Markets, MSCI Europe ex UK, MSCI World, MSCI World ex UK, and S&P GSCI™ indexes.
Valuation Exhibits
The composite normalized P/E ratio is calculated by dividing the inflation-adjusted index price by the simple average of three normalized earnings metrics: ten-year average real earnings (i.e., Shiller earnings), trend-line earnings, and return on equity–adjusted earnings. We have removed the bubble years 1998–2000 from our mean and standard deviation calculations. All data are monthly.
Fixed Income Yields
US fixed income yields reflect Bloomberg Barclays Municipal Bond Index, Bloomberg Barclays US Corporate High Yield Bond Index, Bloomberg Barclays US Corporate Investment-Grade Bond Index, and the ten-year Treasury.
European fixed income yields reflect the BofA Merrill Lynch Euro Corporate AA Bond Index, BofA Merrill Lynch Euro Corporate Bond Index, Bloomberg Barclays Pan-European Aggregate High Yield Bond Index, Bloomberg Twenty-Year European Government Bond Index (nominal), ten-year German bund, 20-year European Inflation Swaps (inflation expectations), and the real yield calculated as the difference between the inflation expectation and nominal yield.
UK sterling fixed income yields reflect the Bank of England 20-year nominal yields, Bloomberg Generic UK 20-year inflation-linked (real) yields, ICE BofAML Sterling Corporate AA Bond Index, ICE BofAML Sterling Corporate Bond Index, and UK ten-year gilts.