Risk assets in first quarter failed to sustain January’s surge as prospects for rising inflation, higher bond yields, increasing trade protectionism, and tighter technology regulations weighed on sentiment during February and March. Global equity performance was generally weak, although emerging markets equities eked out modest gains in USD terms and continued to outperform developed markets equivalents, which declined. US Treasuries were no safe haven as yields rose and performance was in the red, however non-US government bonds offered some protection as their yields were more stable. Corporate bonds underperformed sovereign counterparts as credit spreads widened amid heightened economic uncertainty and equity volatility. Rising bond yields also pressured developed REITs as real assets mostly declined. Energy MLPs and natural resources equities fell sharply despite higher energy prices, while returns for commodities were more mixed. The US dollar continued to weaken, while the euro and UK sterling broadly appreciated.
First quarter appeared to mark a regime shift in global capital markets as the “Goldilocks” macroeconomic backdrop of 2017 gave way to a relatively more fragile investment environment. Despite ongoing strength in underlying corporate fundamentals, positive macro data momentum has begun to slow and economic policy uncertainty is rising at the same time that political risks have mostly increased, with the possible exception of Germany. Global bond yields backed up for several weeks to start the year but were then range bound in the final weeks of the quarter as risks to the positive outlook began to mount. Equity market volatility was thus awakened from a year-long slumber as a January melt-up suddenly gave way to a sharp and mostly technical-driven US equity market correction that pulled global stocks down with it. Rising stock market volatility was also driven by heightened tensions between the United States and its trading partners, most importantly China, as the two countries exchanged a round of tit-for-tat tariffs, which could simply be a negotiating tactic but also risks setting off a broader trade war. The volatility pickup was further exacerbated by some high-profile company-level developments in March, most notably the growing regulatory scrutiny of Facebook’s handling of private user data, safety and financial concerns regarding Tesla, and President Trump’s increasing Twitter attacks on Amazon’s business model. Such recent developments triggered global equities to retest their early February lows, but a small rally into quarter-end helped equity markets recapture at least some of their prior lost ground.
US equities (-0.8% for the S&P 500 Index) declined as weak performance and heightened volatility in February and March more than offset sharp gains in January. US stock prices fell more than 10% intra-quarter and finished down 8.1% from their January 26 peak. First quarter performance marks only the second quarterly loss in the last five years, the other recorded in third quarter 2015. Despite the loss, US equities outperformed developed markets counterparts for the quarter but underperformed in USD, EUR, and GBP terms over the trailing 12 months. Nine of 11 S&P 500 sectors were in the red for the quarter, led lower by telecommunication services, consumer staples, and energy; in contrast, information technology and consumer discretionary each gained more than 3% despite sharp late-quarter selloffs in the aforementioned technology leaders. Fourth quarter 2017 earnings released during first quarter exceeded expectations, and consensus full-year 2018 EPS growth estimates were upgraded by more than 7 percentage points since the start of the year, due in part to expectations for positive impacts from tax cuts. Macro data were mixed in first quarter as labor markets continued to tighten, fourth quarter GDP was revised upward to 2.9%, and sentiment indicators hit cycle highs; however, inflation and consumer spending data were weaker than expected, spurring downgrades to forecasted first quarter 2018 GDP growth. The Federal Reserve raised rates by 25 bps at their March meeting, as expected, and upgraded their forward economic projections, though the “dot plot” reflecting their expectations for the future path of the federal funds rate was little changed.
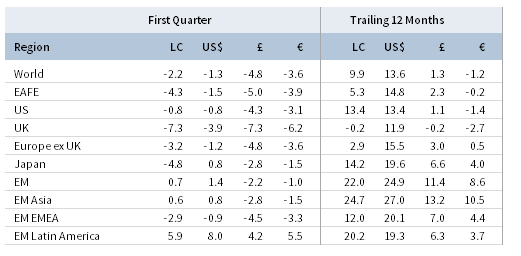
TOTAL RETURN FOR MSCI INDEXES (%)
European equities (-2.0% in USD, -4.3% in EUR, and -5.5% in GBP) underperformed developed counterparts, driven mostly by UK equity underperformance as Europe ex UK stocks performed in-line with broader developed stocks. Earnings results showed that growth accelerated in fourth quarter 2017 in spite of unfavorable currency headwinds. On monetary policy, the European Central Bank (ECB) and Bank of England (BOE) both sounded a more hawkish tone during first quarter. The ECB left rates unchanged but signaled an unwillingness to increase the Asset Purchase Program (APP) should conditions deteriorate, which is an unlikely outcome in their view. In any case, the APP is expected to expire later this year. The BOE also left rates unchanged but is no longer willing to tolerate above-target inflation, setting the stage for a rate hike at its May meeting. Political risks abated slightly during the quarter as the United Kingdom and European Union agreed to a 21-month Brexit transition period following the expiration of Article 50 in March 2019, and as Germany formed a coalition government after a five-month standstill. Italy’s government, however, remains in a hung parliament following the early March election that left no single party with a ruling majority; similar to Germany, negotiations for a governing coalition could continue for some time.
Japanese equities (0.8% in USD, -1.5% in EUR, -2.8% in GBP) outperformed developed counterparts in major currency terms due to robust yen strength but meaningfully underperformed in local currency terms. Calendar fourth quarter GDP growth was revised upward to 1.6% annualized from a preliminary 0.5%, the eighth straight quarterly expansion and the longest growth streak in nearly 30 years. In another positive development, Japan and ten other nations signed the Comprehensive and Progressive Agreement for Trans-Pacific Partnership (CPTPP), which reduces tariffs and establishes new trading rules for nearly 15% of the global economy. Inflation ticked up, but remains well off of the Bank of Japan’s (BOJ) target rate. Corporate fundamentals remained robust and delivered the highest earnings growth among major developed regions; all Japanese sectors enjoyed positive growth on both the top and bottom lines. Despite generally strong fundamental performance, Japanese equities were dragged lower on reports of alleged involvement of Prime Minister Shinzo Abe, his wife, and key political allies in a government land-sale scandal that threatens Abe’s political future. Equity markets were also rattled by a number of BOJ policy miscommunications that seemed to signal the looming end of monetary accommodation, forcing the BOJ to re-affirm its commitment to loose policy. Associated yen strength was yet another factor weighing on the market.
Emerging markets equities (1.4% in USD, -1.0% in EUR, and -2.2% in GBP) outperformed developed markets counterparts, marking the fifth consecutive quarter of outperformance. Among the major regions, Latin America outperformed, while heavily weighted emerging Asia and emerging Europe, the Middle East & Africa lagged. Brazil was the top-performing major emerging market country on improved economic momentum; Brazilian equities surged early in the quarter following an appeals court ruling to uphold a corruption conviction against former president Lula da Silva. The country was also exempted from US steel and aluminum import tariffs, but certain companies remain mired in scandal and the political situation remains relatively unstable. Russia was also a top performer following a sovereign debt ratings upgrade and the “re-election” of Vladimir Putin to a new six-year presidential term, which transpired without the large street protests that followed his return to power in 2012. Index heavyweight China outperformed the broader index despite a growing trade rift with the United States and a late selloff in Chinese internet giant Tencent. South African equities were a notable laggard despite the seemingly market-friendly Cyril Ramaphosa taking over the presidential post following the ouster of Jacob Zuma, although rand strength provided a modest buffer against losses for unhedged foreign investors. Subsequent passage of a new fiscal budget allowed the country to maintain its investment-grade debt rating from Moody’s.
Real assets were generally weak as a result of higher bond yields and mixed commodity prices. Commodity futures (-0.4% for the Bloomberg Commodity TR Index and 2.2% for the energy-heavy S&P GSCI™) were mixed, as gains in energy and agriculture were offset by losses in livestock and industrial metals, which fell on prospects of heightened trade protectionism. Oil prices gained (ending at $70.27 for Brent and $64.94 for WTI) on favorable inventory data and geopolitical tensions in the Middle East region; however global natural resources equities (-5.0% for the MSCI World Natural Resources Index in USD terms) declined amid broader equity weakness. Energy MLPs (-11.1%) were particularly weak following a regulatory body’s decision to remove certain income tax allowances on cost-of-service rates. Developed REITs (-4.3% in USD terms) sold off as higher bond yields weighed on the bond-proxy sector; US REITs (-6.7%) fell the most, followed by UK REITs (-3.8%) and Europe ex UK REITs (-3.3%). Gold prices (1.5%) rose to end first quarter at $1,323.43/troy ounce amid heightened equity volatility and general market uncertainty.
US Treasuries (-1.2%) declined despite the equity market sell-off as government yields shifted higher across maturities and the yield curve flattened slightly, with the benchmark ten-year versus two-year yield spread ending 4 bps tighter relative to fourth quarter-end. Five- and ten-year Treasury yields backed up 36 bps and 34 bps to end at 2.56% and 2.74%, respectively, but fell from more elevated levels midway through the quarter. US tax-exempt bonds (-1.1%) slightly edged Treasuries. Developed ex US government bond yields were more stable as EMU government bonds (1.4%) and UK gilts (0.3%) gained. The UK gilt yield curve flattened as five- and ten-year yields increased 30 bps and 16 bps to end the quarter at 1.04% and 1.42%, respectively. Credit spreads widened in first quarter, a reversal of recent trends and particularly for US investment-grade corporate bonds (-2.3%), which underperformed US high-yield bonds (-0.9%) and Treasuries. US TIPS (-0.8%) outperformed nominal Treasuries as real yields rose and breakeven inflation rates were relatively stable. UK linkers (0.1%), however, underperformed nominal gilts.
Among major currencies, UK sterling, the euro, and the Japanese yen appreciated in first quarter while the US dollar was generally weaker. The US dollar depreciated the most against the Japanese yen, UK sterling, and the euro, but gained against the Australian and Canadian dollars. The greenback was weaker in the trailing 12-month period versus every major currency we cover, including our equal-weighted emerging markets basket. The euro appreciated most in first quarter against the Canadian dollar, Australian dollar, and US dollar, but declined relative to the Japanese yen and UK sterling. Over the past year, the euro strengthened broadly. In first quarter, the UK sterling gained against all but the Japanese yen, and appreciated more than 3% against the Canadian dollar, Australian dollar, and US dollar. The sterling gained against all but the euro over the trailing 12 months.
Market Exhibits
Rising US trade protectionism added to market risks in Q1. The US announced new tariffs on steel and aluminum imports, though most major trading partners were eventually exempted, as well as on Chinese imports amid charges of inadequate intellectual property protections that threaten to further escalate tensions
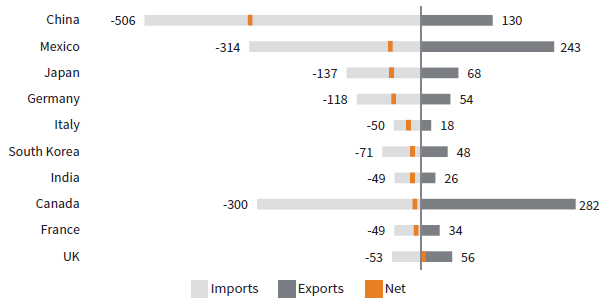
US BILATERAL TRADE BALANCE WITH TOP TRADE PARTNERS
As of December 31, 2017 • US Dollar (billions)
Sources: China Customs, Deutsche Bank, IMF CDIS, US Department of Commerce – Bureau of Economic Analysis, US Department of Commerce – US Census Bureau, and WIND.
Note: Trade balance data represent goods only for calendar year 2017.
US Treasury yields backed up in first quarter amid a growing supply/demand imbalance as the Fed reduced its balance sheet and other central banks tapered their asset purchases, curtailing demand for Treasuries. Coupled with a late cycle US fiscal expansion, the likely path for yields is up
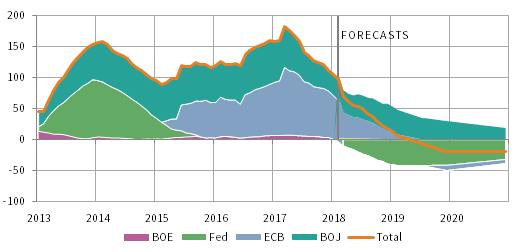
TOTAL CENTRAL BANK ASSET PURCHASES
January 31, 2013 – December 31, 2020 • US Dollar (billions)
Sources: Bank of England, Bank of Japan, Deutsche Bank, European Central Bank, Federal Reserve, J.P. Morgan Securities, Inc., and Thomson Reuters Datastream.
Notes: Central bank asset purchases are 12-month moving averages. Central bank asset purchases data after February 28, 2018, are estimates based on central bank announcements and J.P. Morgan projections.
Global equities enjoyed a historically low volatility climb from their February 2016 low to an all-time peak in late January, a 51% gain. They have since corrected 8% amid threats from rising inflation and bond yields, worsening trade tensions, and rising political and regulatory pressure on leading tech companies
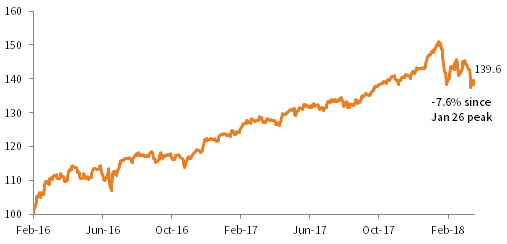
MSCI ACWI CUMULATIVE WEALTH
February 11, 2016 = 100 • Local Currency
Sources: MSCI Inc. and Thomson Reuters Datastream. MSCI data provided “as is” without any express or implied warranties.
Notes: Cumulative wealth data rebased to recent MSCI ACWI bottom on February 11, 2016. Data are based on price returns.
Earnings growth expectations for FY 2018 have been mostly upgraded to start the year, led by positive US earnings revisions due to the anticipated positive impacts from the recent tax cuts. As a result, global equities are currently poised to deliver double-digit EPS growth for a second straight year
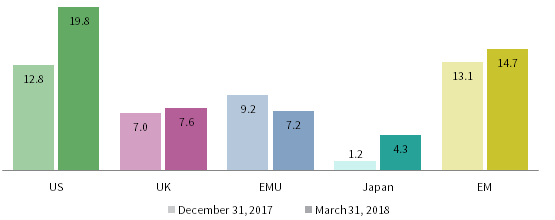
CALENDAR YEAR 2018 EPS GROWTH FORECASTS FOR SELECT REGIONS
Percent (%)
Sources: I/B/E/S, MSCI Inc., and Thomson Reuters Datastream. MSCI data provided “as is” without any express or implied warranties.
Notes: Data are weekly. MSCI EM estimates are in US$ terms and reflect the impact of currency fluctuations. All other regional estimates are in local currency terms. EPS data for Japan are for fiscal year 2018, which runs from April 1, 2018, to March 31, 2019.
Currency Performance as of March 31, 2018
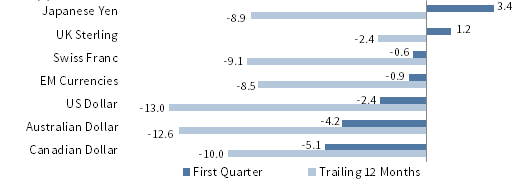
The US dollar depreciated against most major currencies and our equal-weighted EM basket, falling the most relative to the Japanese yen, UK sterling, and euro. Longer-term trends remain intact as the dollar was broadly weaker over the trailing 12 months, particularly against the euro and UK sterling
VERSUS THE DOLLAR
Total Return (%)
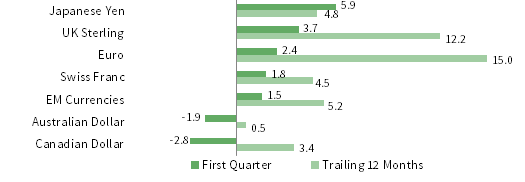
The euro gained against all but the Japanese yen and UK sterling, appreciating the most versus the Canadian, Australian, and US dollars. A more hawkish ECB as a result of the broadening economic recovery supported the common currency, which enjoyed broad-based strength in the trailing 12 months
VERSUS THE EURO
Total Return (%)
UK sterling was mostly stronger in first quarter, except against the Japanese yen, as hawkish BOE comments and agreement between UK and EU leaders on a 21-month Brexit transitional period supported the currency. UK sterling appreciated against all but the euro over the trailing 12 months
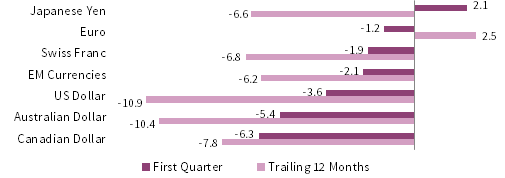
VERSUS THE POUND STERLING
Total Return (%)
Sources: MSCI Inc. and Thomson Reuters Datastream. MSCI data provided “as is” without any express or implied warranties.
Note: EM currencies is an equal-weighted basket of 20 currencies.
USD Market Performance as of March 31, 2018
US assets fell broadly in first quarter as higher US Treasury yields hit US REITs, US investment-grade bonds, and DM equities the hardest. EM assets and commodities gained with the help of ongoing US dollar weakness, while US T-bills also advanced. Global risk assets performed strongly the past year
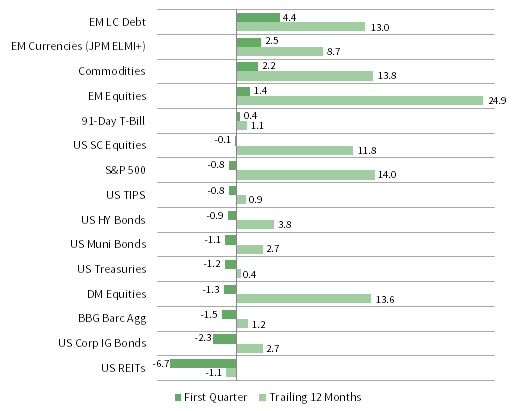
INDEX PERFORMANCE (US$)
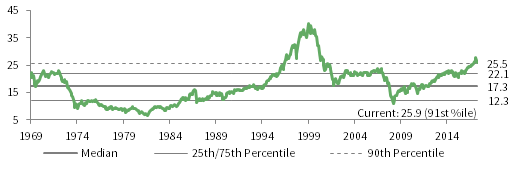
COMPOSITE NORMALIZED P/E: MSCI US
December 31, 1969 – March 31, 2018
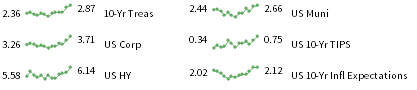
FIXED INCOME YIELDS
March 2017 – March 2018
Sources: Barclays, Bloomberg L.P., BofA Merill Lynch, FTSE International Limited, Frank Russell Company, J.P. Morgan Securities, Inc., MSCI Inc., National Association of Real Estate Investment Trusts, Standard & Poor’s, and Thomson Reuters Datastream. MSCI data provided “as is” without any express or implied warranties.
Euro Market Performance as of March 31, 2018
Global equities declined with European equities underperforming DM equivalents and EM stocks continuing to outperform. EMU government bonds gained, while both pan-euro high-yield and European corporate IG bonds declined as credit spreads widened, though EM debt posted the strongest gains
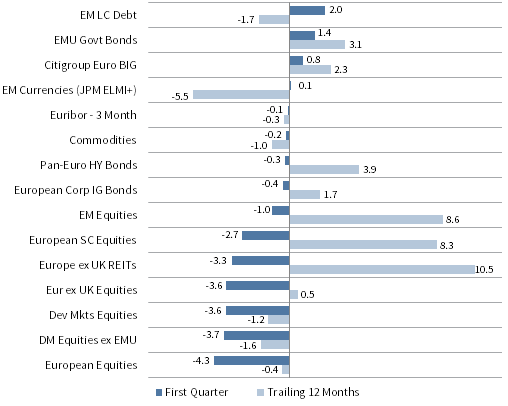
INDEX PERFORMANCE (€)

COMPOSITE NORMALIZED P/E: MSCI EUROPE EX UK
December 31, 1969 – March 31, 2018
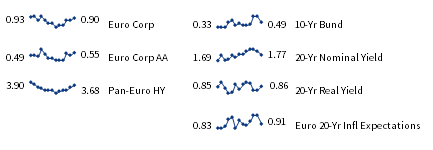
FIXED INCOME YIELDS
March 2017 – March 2018
Sources: Barclays, Bloomberg L.P., Citigroup Global Markets, EPRA, FTSE International Limited, J.P. Morgan Securities, Inc., MSCI Inc., National Association of Real Estate Investment Trusts, Standard & Poor’s, and Thomson Reuters Datastream. MSCI data provided “as is” without any express or implied warranties.
GBP Market Performance as of March 31, 2018
Global equities declined as UK equities underperformed DM counterparts, while EM equities continued to outperform. UK gilts and linkers eked out slight gains, while UK high-yield bonds were flat and UK corporate IG bonds declined. Over the past year, EM equities, UK REITs, and UK mid caps have gained the most
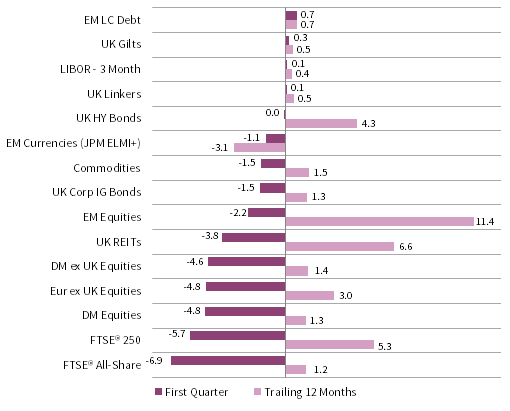
INDEX PERFORMANCE (₤)
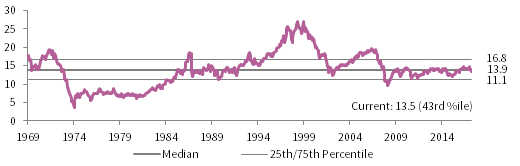
COMPOSITE NORMALIZED P/E: MSCI UK
December 31, 1969 – March 31, 2018
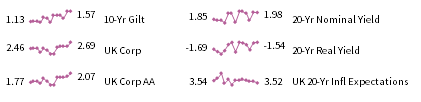
FIXED INCOME YIELDS
March 2017 – March 2018
Sources: Barclays, Bloomberg L.P., BofA Merill Lynch, EPRA, FTSE International Limited, J.P. Morgan Securities, Inc., MSCI Inc., National Association of Real Estate Investment Trusts, Standard & Poor’s, and Thomson Reuters Datastream. MSCI data provided “as is” without any express or implied warranties.
Exhibit Notes
Performance Exhibits
Total return data for all MSCI indexes are net of dividend taxes.
US dollar index performance chart includes performance for the Bloomberg Barclays Aggregate Bond, Bloomberg Barclays Corporate Investment Grade, Bloomberg Barclays High-Yield Bond, Bloomberg Barclays Municipal Bond, Bloomberg Barclays US TIPS, Bloomberg Barclays US Treasuries, BofA Merrill Lynch 91-Day Treasury Bills, FTSE® NAREIT All Equity REITs, J.P. Morgan ELMI+, J.P. Morgan GBI-EM Global Diversified, MSCI Emerging Markets, MSCI World, Russell 2000®, S&P 500, and S&P GSCI™ indexes.
Euro index performance chart includes performance for the Bloomberg Barclays Euro-Aggregate: Corporate, Bloomberg Barclays Pan-Euro High Yield, Citigroup EMU Govt Bonds, Citigroup Euro Broad Investment-Grade Bonds, Euribor 3-month, FTSE® EPRA/NAREIT Europe ex UK, J.P. Morgan ELMI+, J.P. Morgan GBI-EM Global Diversified, MSCI Emerging Markets, MSCI Europe, MSCI Europe ex UK, MSCI Europe Small-Cap, MSCI World ex EMU, MSCI World, and S&P GSCI™ indexes.
UK sterling index performance chart includes performance for the Bloomberg Barclays Sterling Aggregate: Corporate Bond, BofA Merrill Lynch Sterling High Yield, FTSE® 250, FTSE® All-Share, FTSE® British Government All Stocks, FTSE® British Government Index-Linked All Stocks, FTSE® EPRA/NAREIT UK RE, J.P. Morgan ELMI+, J.P. Morgan GBI-EM Global Diversified, LIBOR 3M GBP, MSCI Emerging Markets, MSCI Europe ex UK, MSCI World, MSCI World ex UK, and S&P GSCI™ indexes.
Valuation Exhibits
The composite normalized P/E ratio is calculated by dividing the inflation-adjusted index price by the simple average of three normalized earnings metrics: ten-year average real earnings (i.e., Shiller earnings), trend-line earnings, and return on equity–adjusted earnings. We have removed the bubble years 1998–2000 from our mean and standard deviation calculations. All data are monthly.
Fixed Income Yields
US fixed income yields reflect Bloomberg Barclays Municipal Bond Index, Bloomberg Barclays US Corporate High Yield Bond Index, Bloomberg Barclays US Corporate Investment-Grade Bond Index, and the ten-year Treasury.
European fixed income yields reflect the BofA Merrill Lynch Euro Corporate AA Bond Index, BofA Merrill Lynch Euro Corporate Bond Index, Bloomberg Barclays Pan-European Aggregate High Yield Bond Index, Bloomberg Twenty-Year European Government Bond Index (nominal), ten-year German bund, 20-year European Inflation Swaps (inflation expectations), and the real yield calculated as the difference between the inflation expectation and nominal yield.
UK sterling fixed income yields reflect the BofA Merrill Lynch Sterling Corporate AA Bond Index, BofA Merrill Lynch Sterling Corporate Bond Index, UK ten-year gilts, Bank of England 20-year nominal yields, and Bloomberg Generic UK 20-year inflation-linked (real) yields. Current UK 20-yr nominal yield data are as of March 27, 2018.