First quarter saw a continuation of the equity rally. Global equities were led by emerging markets; developed markets counterparts underperformed despite both UK and US stocks touching all-time highs during the quarter. Many of last year’s underperformers outperformed in the first quarter and vice versa—global growth stocks outperformed while small caps trailed. The US Federal Reserve hiked rates in March, weighing on higher-quality fixed income in the final month of the quarter, though emerging markets and high-yield bonds fared better as worries over fundamentals continue to ease. Real asset performance was mixed. Despite OPEC compliance with its announced output cuts, crude oil prices fell 7%, weighing on energy stocks. However, MLPs managed to post small gains as did US and developed REITs in USD terms.
Risk assets started 2017 on a high note, with markets continuing the rally that began in the second half of 2016. Emerging markets assets outperformed, as easing concerns over China allowed equity markets to bounce back from a weak 2016 and Indian stocks benefitted from favorable political developments. Strengthening economic data helped propel Eurozone stocks, as did a slight easing of political risks after the Dutch elections. US economic data were somewhat supportive, though the surge in “soft” economic indicators, such as consumer and business confidence, was much stronger than the improvement in underlying “hard data” like GDP. Equities rising across the globe seemed to sail over several potential speed bumps, including another interest rate hike by the Fed, the start of divorce proceedings between the United Kingdom and the European Union, and a dip in oil prices given resurgent US supply. For now, the consensus seems to be that equities are the best house on a somewhat unattractive block, but upcoming elections in France and further rate hikes by the Fed may test this assumption in the months ahead.
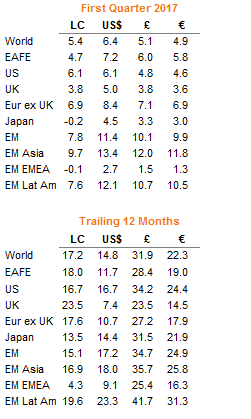
Total Return for MSCI Indexes (%)
US equities (6.1%) advanced but underperformed global equivalents in USD terms for the quarter following a dovish rate hike by the Fed, declines in the energy sector, and a weaker currency. US earnings may see reduced headwinds from currency strength as the US dollar depreciated 1.8% during the quarter. US large caps (6.0%), which hit all-time highs in March, enjoyed a strong rally after robust fourth quarter 2016 earnings, outperforming small caps by over 350 basis points (bps) in the first quarter. While it is unclear how much more room US equities have to grow given stretched valuations, margin debt climbed to $528 billion in February, a record high according to NYSE and a renewed sign of investors’ bullishness. Growth stocks outperformed value stocks for the first time in five quarters and all sectors in the S&P 500 advanced with the exception of energy (-6.7%) and telecommunications (-4.0%). IT was by far the best-performing sector, returning 12.6% for the quarter. Volatility remained low throughout January and February, but picked up in mid-March as investors closely watched the effort to “repeal and replace” the Affordable Care Act. The S&P 500 fell more than 1% in the week leading up to the vote, breaking a 109-day streak without such a fall; the dip resulted in the worst week for US equities since November’s election.
European equities (6.0%) also had a strong first quarter, slightly edging developed markets peers. EMU stocks (7.1%) outperformed Europe ex UK (6.9%) and UK (3.8%) stocks. This performance followed double-digit earnings growth in fourth quarter 2016 and stronger than anticipated economic data releases throughout the quarter. Eurozone composite PMI hit its highest levels since 2011 and headline inflation rose to the European Central Bank’s 2.0% target in February. On March 29, Theresa May’s government formally laid out its plan for the Great Repeal Bill to end EU law in the United Kingdom. This initiates the two-year negotiation between the United Kingdom and the EU on the specifics of the divorce. Much remains unknown about how the negotiations will play out, with another potential Scottish referendum looming, and given Europe’s changing political landscape. The recent Dutch election saw incumbent Prime Minister Mark Rutte beat populist candidate Geert Wilders; Dutch equities returned nearly 10% in the first quarter. Looking ahead, current opinion polls in France show presidential contenders Marine Le Pen and Emmanuel Macron nearly tied in first round voting, but Macron more clearly in the lead in the second round.
Japanese equities (-0.2%) were down slightly for the quarter, with the stock market maintaining a close negative correlation to the currency, meaning unhedged US and European investors saw gains (4.5%, 3.3%, and 3.0%, in USD, GBP, and EUR terms, respectively). Japanese earnings have actually been resilient, and are expected to grow another 12% in the current fiscal year. With inflation still significantly below its 2% target, the Bank of Japan announced that monetary easing would continue during its March meeting.
Emerging markets returned a hefty 11.4% in USD terms in the first quarter (10.1% in GBP terms and 9.9% in euros), outperforming developed markets by over 500 bps in these currencies. By region, emerging Asia and Latin America significantly outperformed emerging Europe, the Middle East & Africa. Positive economic data boosted returns in China (13.1%) and a landslide victory for Prime Minister Narendra Modi’s party in Uttar Pradesh in late March was a boon to India (12.1%); in local currency terms these countries led the quarter’s returns in emerging Asia. Foreign portfolio flows into emerging markets equities were strong in the first quarter and picked up speed in March; according to the Institute of International Finance, emerging markets received an estimated $30 billion in non-resident portfolio inflows in the last month of the quarter, the highest since January 2015.
Real assets experienced a range of performance outcomes during the quarter. Commodity futures were down for the quarter (-2.3% for the Bloomberg Commodity TR Index and -5.1% for the energy-heavy S&P GSCI™) as losses in the energy and agriculture sectors weighed on returns. Despite OPEC’s global production cut to the level agreed on in November, excess supply in the United States pushed oil prices down at the beginning of March, followed by a small reversal in the final week of the quarter in response to Kuwait’s support for extending OPEC’s production cuts. WTI and Brent fell 5.8% and 7.0% for the quarter, ending at $50.60 and $52.83, respectively. Gold advanced 7.8% over the quarter to $1,247.25/troy ounce. Investors searching for higher-yielding alternatives bolstered energy MLPs (3.9%) for the quarter, while natural resources equities (-2.9% for the MSCI World Natural Resources Index in USD terms) declined. US REITs (2.5%) and global developed REITs (2.3%) gained over the quarter despite negative returns in March following the Fed rate hike.
Global developed markets government bonds (-0.1%) fell slightly in aggregate, with some dispersion among regions. UK gilts (1.6%) outperformed US Treasuries (0.7%) and EMU government bonds (-1.5%). The US Treasury yield curve flattened over the first quarter. Longer-dated ten-year yields fell 5 bps to 2.40%, while short-term yields rose following the Fed’s March 15 rate hike. Inflation-linked bonds fared well, led by emerging markets (7.4% in USD terms) and UK linkers (1.9%). US TIPS (1.3%) outperformed Treasuries for a third consecutive quarter as the headline personal consumption expenditures price index hit 2.1% year-over-year in February. Despite flat or negative returns in March, a combination of improving credit metrics and expectations of revisions to tax and regulatory policies enacted by the Trump administration bolstered the corporate credit market. Global investment-grade fixed income returned 1.8%, led by US corporate bonds (1.3%). Following expectations for better domestic growth, US high-yield bonds (2.7%) continued their strong rally.
At the end of 2016, the consensus was the dollar would continue its bull run, the euro would fall, and dollar strength would weigh on emerging markets’ dollar-based debt. At the end of the first quarter, the dollar was weaker against all major developed markets currencies and all but two emerging markets currencies following a rate hike and small downgrades to growth. The euro was more mixed; the currency strengthened against the Canadian dollar, UK pound, and US dollar but weakened against the Australian dollar, Japanese yen, the Swiss franc, and our equal-weighted EM currency basket. Following the Brexit proposal and uncertainty around the fallout, the pound ended the quarter down against all major currencies except the US dollar and Canadian dollar. The yen continued its strength, up against all major developed markets except the Australian dollar. Emerging markets currency strength prevailed, with the US dollar, euro, and pound sterling weaker vis-à-vis our equal-weighted emerging markets currency basket.
Market Exhibits
US Fed Funds Rate Expectations
The Fed delivered a widely anticipated 25 bp rate hike at its March 15 meeting, but made no meaningful changes to growth, inflation, or interest rate projections over the next two years. For the first time in several years, market expectations are converging with the Fed’s for the year ahead
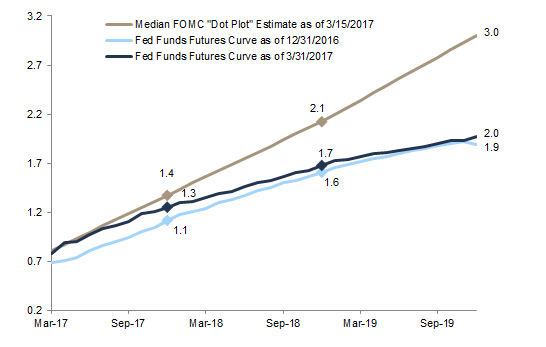
US Fed Funds Rate Expectations
Percent (%)
Sources: Bloomberg L.P., Federal Reserve, and Thomson Reuters Datastream.
Note: All data are through December 2019.
US Treasury Yield Curve
Following the rate hike, the US Treasury yield curve flattened. Relative to the end of the year, two-year yields shifted up 7 bps while ten-year yields fell 5 bps; the spread between ten-year and two-year bonds hit its lowest level since November’s election near the end of March, ending the quarter just slightly higher
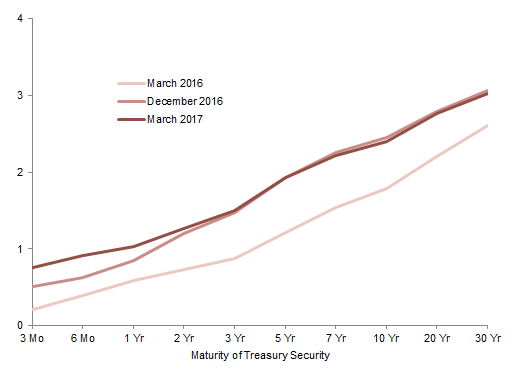
US Treasury Yield Curve
As of March 31, 2017 • Percent (%)
Sources: Thomson Reuters Datastream and US Treasury.
Relative Performance of MSCI World Value vs MSCI World Growth
Value equities, which had an outstanding fourth quarter and beat growth equities for a calendar year for the first time since 2008, couldn’t sustain the momentum in the first quarter, lagging growth equities by 440 bps

Relative Performance of MSCI World Value vs MSCI World Growth
First Quarter 2011 – First Quarter 2017 • Total Return Differential in Local Currency Terms (ppts)
Sources: MSCI Inc. and Thomson Reuters Datastream. MSCI data provided “as is” without any express or implied warranties.
Note: Total return data for all MSCI indexes are net of dividend taxes.
MSCI World Total Returns by Sector
Not surprisingly, IT, the biggest growth sector by market cap, outperformed for the quarter while energy, a larger component of value indexes than of growth indexes, underperformed
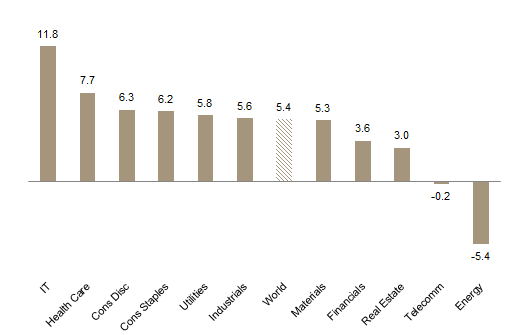
MSCI World Total Returns by Sector
As of First Quarter 2017 • Percent (%)
Sources: MSCI Inc. and Thomson Reuters Datastream. MSCI data provided “as is” without any express or implied warranties.
Notes: All data are local currency. Total return data for all MSCI indexes are net of dividend taxes.
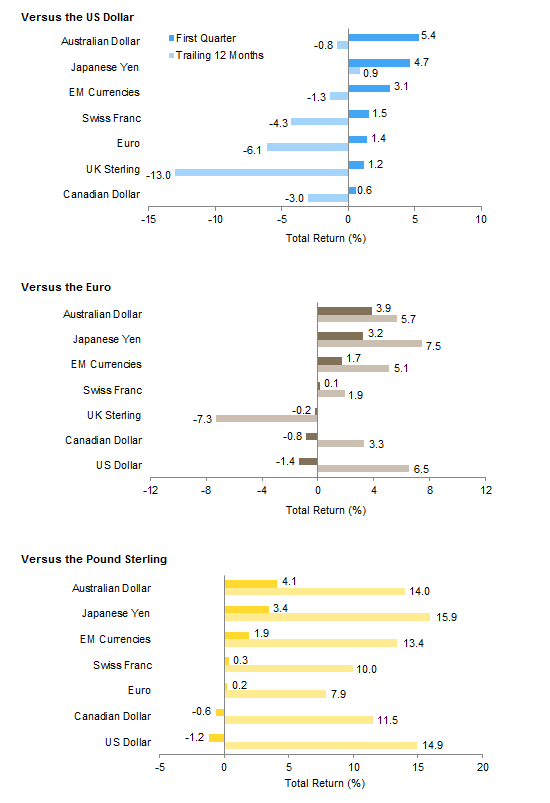
Currency Performance
First quarter saw a reversal in the trend of USD strength as the greenback fell against all major developed markets and our equal-weighted basket of EM currencies
The euro was more mixed over the quarter, gaining against the US dollar, Canadian dollar, and British pound but weakening versus the Australian dollar, Japanese yen, our EM currency basket, and the Swiss franc. On a trailing one-year basis, only the British pound has depreciated against the euro
Pound weakness continued as the British pound fell for the quarter versus all major developed currencies except the US dollar and Canadian dollar
Currency Performance
As of March 31, 2017
Sources: MSCI Inc. and Thomson Reuters Datastream. MSCI data provided “as is” without any express or implied warranties.
Note: EM currencies is an equal-weighted basket of 20 currencies.
Index Performance (US$)
Emerging markets assets posted top performance for the quarter, supported by a weaker US dollar. Developed markets equities and US stocks gained by smaller amounts and outperformed fixed income equivalents. US large-cap stocks outperformed small-cap stocks for the first time in four quarters, but small caps are still the best-performing asset class over the past 12 months. High-yield bonds beat out US TIPS, US investment-grade bonds, and Treasuries for the quarter

Index Performance (US$)
As of March 31, 2017
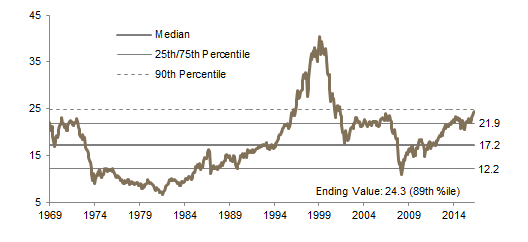
MSCI US Composite Normalized P/E
December 31, 1969 – March 31, 2017
Sources: Barclays, Bloomberg L.P., BofA Merill Lynch, FTSE International Limited, Frank Russell Company, J.P. Morgan Securities, Inc., MSCI Inc., National Association of Real Estate Investment Trusts, Standard & Poor’s, and Thomson Reuters Datastream. MSCI data provided “as is” without any express or implied warranties.
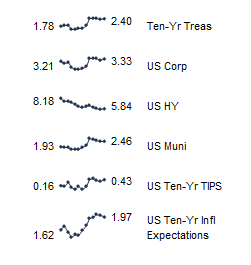
Fixed Income Yields
March 2016 – March 2017
Index Performance (€)
Emerging markets equities were the top performers in first quarter and for the past 12 months. European small-cap stocks narrowly edged out large-cap counterparts for the quarter, but trailed over the past year. Commodities retreated, and are one of the weaker performing risk asset categories over the past 12 months

Index Performance (€)
As of March 31, 2017

MSCI Europe ex UK Composite Normalized P/E
December 31, 1969 – March 31, 2017
Sources: Barclays, Bloomberg L.P., Citigroup Global Markets, EPRA, FTSE International Limited, J.P. Morgan Securities, Inc., MSCI Inc., National Association of Real Estate Investment Trusts, Standard & Poor’s, and Thomson Reuters Datastream. MSCI data provided “as is” without any express or implied warranties.
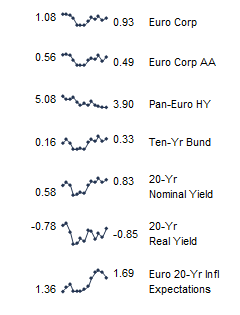
Fixed Income Yields
March 2016 – March 2017
Index Performance (₤)
Almost all assets enjoyed gains for the quarter, with the exception of commodities, which declined. Emerging markets equities, Europe ex UK equities, and UK mid-cap stocks outperformed while yield-oriented assets including UK gilts, REITs, and linkers underperformed. All asset classes are in the black for the past 12 months, led by emerging and developed markets equities

Index Performance (£)
As of March 31, 2017
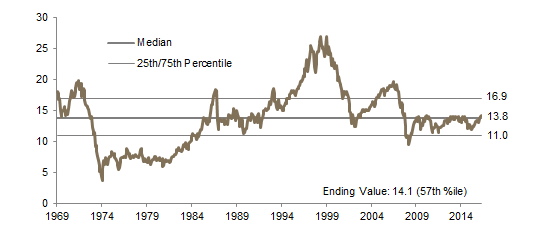
MSCI UK Composite Normalized P/E
December 31, 1969 – March 31, 2017
Sources: Barclays, Bloomberg L.P., BofA Merill Lynch, EPRA, FTSE International Limited, J.P. Morgan Securities, Inc., MSCI Inc., National Association of Real Estate Investment Trusts, Standard & Poor’s, and Thomson Reuters Datastream. MSCI data provided “as is” without any express or implied warranties.
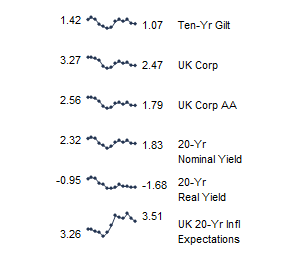
Fixed Income Yields
March 2016 – March 2017
Exhibit Notes
Performance Exhibits
Total return data for all MSCI indexes are net of dividend taxes.
US dollar index performance chart includes performance for the Bloomberg Barclays Aggregate Bond, Bloomberg Barclays Corporate Investment Grade, Bloomberg Barclays High-Yield Bond, Bloomberg Barclays Municipal Bond, Bloomberg Barclays US TIPS, Bloomberg Barclays US Treasuries, BofA Merrill Lynch 91-Day Treasury Bills, FTSE® NAREIT All Equity REITs, J.P. Morgan ELMI+, J.P. Morgan GBI-EM Global Diversified, MSCI Emerging Markets, MSCI World, Russell 2000®, S&P 500, and S&P GSCI™ indexes.
Euro index performance chart includes performance for the Bloomberg Barclays Euro-Aggregate: Corporate, Bloomberg Barclays Pan-Euro High Yield, Citigroup EMU Govt Bonds, Citigroup Euro Broad Investment-Grade Bonds, EURIBOR 3M, FTSE® EPRA/NAREIT Europe ex UK, J.P. Morgan ELMI+, J.P. Morgan GBI-EM Global Diversified, MSCI Emerging Markets, MSCI Europe, MSCI Europe ex UK, MSCI Europe Small-Cap, MSCI World ex EMU, MSCI World, and S&P GSCI™ indexes.
UK sterling index performance chart includes performance for the Bloomberg Barclays Sterling Aggregate: Corporate Bond, BofA Merrill Lynch Sterling High Yield, FTSE® 250, FTSE® All-Share, FTSE® British Government All Stocks, FTSE® British Government Index-Linked All Stocks, FTSE® EPRA/NAREIT UK RE, J.P. Morgan ELMI+, J.P. Morgan GBI-EM Global Diversified, LIBOR 3M GBP, MSCI Emerging Markets, MSCI Europe ex UK, MSCI World, MSCI World ex UK, and S&P GSCI™ indexes.
Valuation Exhibits
The composite normalized P/E ratio is calculated by dividing the inflation-adjusted index price by the simple average of three normalized earnings metrics: ten-year average real earnings (i.e., Shiller earnings), trend-line earnings, and return on equity–adjusted earnings. We have removed the bubble years 1998–2000 from our mean and standard deviation calculations. All data are monthly.
Fixed Income Yields
US fixed income yields reflect Bloomberg Barclays Municipal Bond Index, Bloomberg Barclays US Corporate High-Yield Bond Index, Bloomberg Barclays US Corporate Investment-Grade Bond Index, and the ten-year Treasury.
European fixed income yields reflect the BofA Merrill Lynch Euro Corporate AA Bond Index, BofA Merrill Lynch Euro Corporate Bond Index, Barclays Pan-European Aggregate High Yield Bond Index, Bloomberg Twenty-Year European Government Bond Index (nominal), ten-year German bund, 20-year European Inflation Swaps (inflation expectations), and the real yield calculated as the difference between the inflation expectation and nominal yield.
UK sterling fixed income yields reflect the BofA Merrill Lynch Sterling Corporate AA Bond Index, BofA Merrill Lynch Sterling Corporate Bond Index, UK ten-year gilts, and Bank of England 20-year nominal, real, and zero coupon (inflation expectations) yields.