First quarter saw most global risk assets complete a round-trip retreat and recovery as heightened risks to financial markets emanating from China and commodity markets were met with fresh policy responses. Global high-yield bonds and natural resources equities outperformed as prices of crude oil and some industrial metals recovered from multi-year lows. Value equities outperformed their more expensive growth counterparts on a global basis for the first time in almost two years despite a wretched quarter for developed markets bank stocks, which meaningfully underperformed. Global equities finished the quarter modestly down. Emerging markets equities’ strong March performance sent them into the black for the quarter, while developed markets stocks were in the red notwithstanding small gains in the United States and the United Kingdom. Global government bonds outperformed equities as safe-haven assets remained well bid—gold spot prices appreciated the most since third quarter 1986. The US dollar weakened against most major currencies as dovish US Federal Reserve commentary confirmed the market’s subdued rate hike expectations for 2016.
The interrelated issues weighing on markets at the start of the year—namely, China’s slowing economy and opaque currency policy, plunging crude oil and industrial metals prices, the strong US dollar, and expectations of further Fed tightening vis-à-vis widening adoption of negative interest rate policy by other major developed markets central banks—have not gone away, but the market’s reckoning with them will wait for another day. For now, Chinese policymakers have managed to stabilize growth, slow the pace of capital outflows, and reduce pressure on the currency through fresh stimulus and tighter capital controls. The Fed helped a little too, holding rates steady in March and reiterating its plan for gradual and data-driven future rate hikes, including explicitly taking into consideration financial developments abroad (read “China”). Brent crude oil prices rallied roughly 42% from their January 20 trough to quarter-end and have stabilized near the $40/barrel level since a group of the largest oil-producing nations tentatively agreed to consider a production freeze at an upcoming summit. A weaker US dollar likely also contributed to the recovery in crude and industrial metals prices. The dollar’s weaker stance came despite further monetary easing by the Bank of Japan (BOJ), which adopted a negative deposit rate for the first time in late January, and the European Central Bank (ECB), which lowered its deposit rate further into negative territory in March, as the yen and the euro surprisingly strengthened following these announcements. Despite these recent moves, dollar strength is likely to resume later this year in anticipation of the Fed’s next rate hike. If and when that happens, the headwinds facing global risk assets could return to the fore and pressure their prices once again.
US equities (1.3%) outperformed developed markets equivalents after recovering from one of their worst Januarys on record and from further declines in early February, having at one point corrected 10.3% on a cumulative year-to-date basis. To put some historical context around the level of volatility experienced by markets to start the year, first quarter 2016 marked the first time since fourth quarter 1933 that the S&P 500 generated a quarterly gain after having traded down 10% or more on an intra-quarter basis. US value equities outperformed US growth stocks, following the global trend, and large caps outpaced small caps. The strong dollar, weak global demand, and depressed commodity prices continue to weigh on the earnings outlook, with an expected profit recovery delayed until the second half of the year. Consensus estimates for first quarter S&P 500 earnings have been downgraded by over 9% since the start of the quarter, significantly greater than the average decline in quarterly estimates over the past decade. If the current estimate stands, it would be the worst year-over-year earnings decline since third quarter 2009. Consensus estimates for calendar year 2016 have been similarly slashed and now stand at just 2% versus nearly 13% a year ago. The largest recent earnings downgrades have come from the energy, materials, and financials sectors.
European equities (-4.9%) underperformed as UK equities (0.2%) outpaced EMU (-6.6%) and Europe ex UK (-7.0%) markets in aggregate. As in the United States, analysts have sharply cut their 2016 earnings estimates for EMU equities since the start of the year, with the latest forecasts suggesting just 3% growth, while expectations for UK earnings growth for the current year remain firmly in negative territory. Financials, the largest sector at approximately one-fifth of the regional indexes, was also the worst performing, with UK financials declining roughly 12% and EMU financials down even further, at about -15%. Bank stocks, in particular, sold off amid disappointing results and heightened investor concerns regarding capital adequacy, troubled loan books, and negative central bank deposit rates as European banks struggle to navigate increasingly complex and ever-shifting regulatory and monetary policy environments.
Japan (-12.7%) was the worst-performing major developed equity market. The BOJ’s surprise policy shift, adopting a negative deposit rate just days after BOJ Governor Haruhiko Kuroda said such a policy was not in the cards, clearly damaged sentiment among foreign investors. As in Europe, the BOJ’s new negative interest rate policy appeared to trigger a sell-off in Japanese financials (-19.3%), the worst-performing sector. Unexpected yen strength following the BOJ’s announcement similarly led export-oriented sectors to underperform for the quarter, with consumer discretionary (-14.6%), information technology (-13.5%), and materials (-15.8%) all experiencing double-digit declines. Following such sharp losses, Japanese equities appear oversold, particularly in light of resilient earnings growth expectations, which remain in double digits for 2016.
Emerging markets equities (2.8%) outperformed their developed markets counterparts, and particularly for USD- and GBP-based investors given the strong appreciation of emerging markets currencies. Latin America (11.9%) outperformed; Brazilian equities (15.2%) rallied as investors anticipated a change in economic policy amid growing signs that President Dilma Rousseff will face impeachment. Emerging EMEA (7.6%) also enjoyed strong gains, driven by rebounds in Russia (7.9%), South Africa (8.2%), and Turkey (17.4%), while emerging Asia (0.3%) lagged as declines in China (-4.7%) and India (-2.4%) weighed on returns. Foreign portfolio flows into emerging markets equities rebounded strongly in March after nine straight months of flat or negative flows. The commodity price rebound, dovish US Fed commentary, and signs that China’s growth is stabilizing, with the latest Purchasing Manager Index readings surprising positively, likely all contributed to the improvement in sentiment toward emerging markets assets, though fundamentals remain challenged in the near term.
Inflation-sensitive assets experienced mixed performance amid a volatile quarter for commodities and commodity-related assets, with commodity futures paring prior substantial losses to finish with muted gains (0.4% for the Bloomberg Commodity TR Index) or small losses (-2.5% for the energy-heavy S&P GSCI™), depending on the index. Crude oil prices traded below $30/barrel during the quarter before rallying to finish just below $40/barrel—Brent closed up 6.2% at $39.60, while WTI rose 3.5% to $38.34/barrel. Industrial metals prices also sold off before rallying later in the quarter. Gold (16.2%) received substantial interest, with the spot price rising 16.2% to $1,234.60/troy ounce, the largest quarterly gain observed since 1986. Natural resources equities (5.5%) outperformed broader equity markets as energy and metals and mining stocks rallied; gold mining stocks were particularly strong. The performance of energy master limited partnerships (-4.2%) remained closely correlated with changes in the price of WTI crude; both traded down double digits on an intra-quarter basis. US REITs (5.8%) outperformed the broader equity market, while UK REITs (-7.0%) underperformed. Finally, US TIPS (4.5%) and UK linkers (5.7%) each outperformed nominal bonds in their respective markets.
Global government bonds (3.8%) sustained the sizeable gains achieved during the January and early February market turmoil. Major markets all notched strong returns, with UK gilts (4.9%), EMU sovereigns (3.4%), and US Treasury bonds (3.2%) all handily outperforming their respective domestic equity markets. US tax-exempt bonds (1.7%) also outperformed US equities, but by a smaller amount. The US Treasury yield curve continued to flatten, with ten-year and five-year yields falling 49 bps and 55 bps over the quarter to 1.78% and 1.21%, respectively, while the three-month yield rose 5 bps to 0.21%. Corporate credit spreads tightened as US investment-grade bonds (4.0%) and US high-yield bonds (3.4%) rebounded from losses early in the quarter.
The US dollar weakened against most global currencies. A main exception was the British pound, which was substantially weaker during the quarter, weighed down by uncertainty surrounding the United Kingdom’s upcoming June referendum on EU membership as well as a record current account deficit in February. US dollar weakness also means that it has now retreated versus the euro, Japanese yen, Swiss franc, and Australian dollar over the past year. Emerging markets currencies appreciated 4.5% and 7.2% versus the US dollar and pound sterling, respectively, while depreciating 0.4% against the euro.
First quarter saw most global risk assets complete a round-trip retreat and recovery as heightened risks to financial markets emanating from China and commodity markets were met with fresh policy responses that helped drive a sharp rally led by cyclical assets
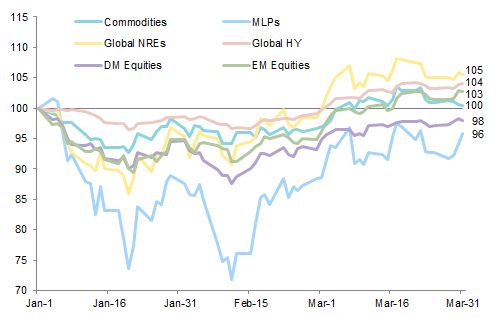
First Quarter 2016 Performance of Global Risk Assets
January 1, 2016 – March 31, 2016 • January 1, 2016 = 100 • Local Currency
Sources: Alerian, Barclays, Bloomberg L.P., MSCI Inc., and Thomson Reuters Datastream. MSCI data provided “as is” without any express or implied warranties.
Notes: Data are daily. Commodities represented by the Bloomberg Commodity TR Index and Global NREs by the MSCI World Natural Resources Index. Total returns for MSCI developed markets equities are net of dividend taxes. Total returns for MSCI emerging markets equities are gross of dividend taxes.
The BOJ surprised markets in late January by following the major central banks in Europe in adopting a negative interest rate policy, while Sweden’s Riksbank and the ECB subsequently lowered rates further into negative territory
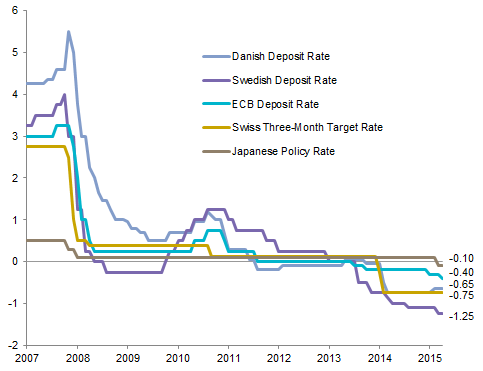
Negative Central Bank Rates
December 31, 2007 – March 31, 2016 • Percent (%)
Sources: Bloomberg L.P. and Thomson Reuters Datastream.
Note: Data are monthly.
First quarter regional equity market performance marked a reversal from 2015: emerging markets equities outperformed, while Japanese and Europe ex UK stocks lagged as negative interest rates clouded the outlook for growth and profits
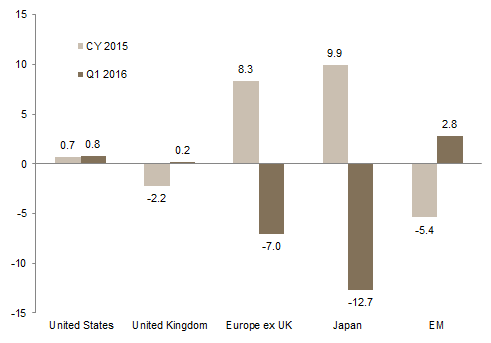
Equity Market Performance by Region
As of March 31, 2016 • Total Returns (%) • Local Currency
Sources: MSCI Inc. and Thomson Reuters Datastream. MSCI data provided “as is” without any express or implied warranties.
Notes: Total returns for developed markets indexes are net of dividend taxes. Total returns for emerging markets indexes are gross of dividend taxes.
Value equities outperformed their growth counterparts on a global basis by the most since first quarter 2014 and after six consecutive quarters of underperformance

Relative Performance of MSCI ACWI Value vs MSCI ACWI Growth
First Quarter 2011 – First Quarter 2016 • Total Return Differential in LC Terms (ppts)
Sources: MSCI Inc. and Thomson Reuters Datastream. MSCI data provided “as is” without any express or implied warranties.
Note: Data are gross of dividend taxes.
The US dollar weakened against most major global currencies in first quarter, with the exception of the British pound; the dollar has now retreated versus the Australian dollar, euro, Swiss franc, and yen over the past year
The euro experienced large gains versus the US dollar and British pound for the quarter but weakened versus the Canadian dollar, Japanese yen, and Australian dollar. On a trailing one-year basis, only the yen has gained ground against the euro
The British pound depreciated versus all currencies over the quarter amid uncertainty regarding the United Kingdom’s upcoming referendum on EU membership, touching a level versus the US dollar only seen during past crisis periods
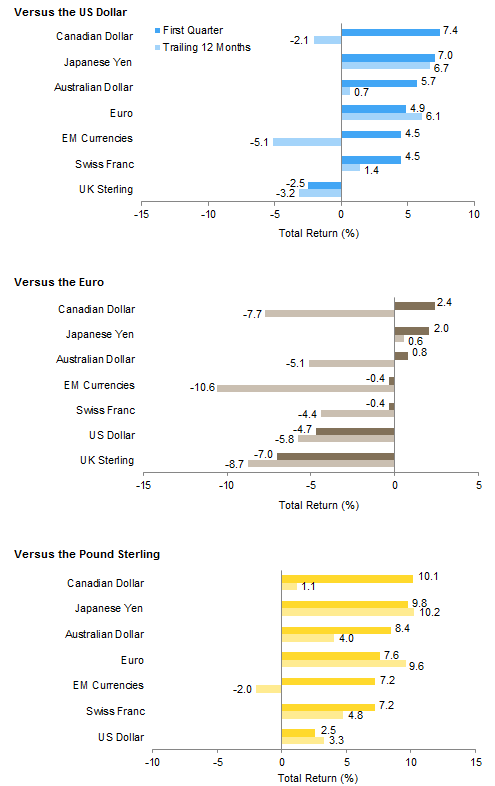
Currency Performance
As of March 31, 2016
Sources: MSCI Inc. and Thomson Reuters Datastream. MSCI data provided “as is” without any express or
implied warranties.
Note: EM currencies is an equal-weighted basket of 20 currencies.
Emerging markets assets were supported by US dollar weakness and a sharp sentiment reversal, outperforming most developed markets equities and bonds for first quarter. All categories of US bonds, led by US TIPS and corporate credits, outperformed US stocks as well as developed markets equities in aggregate

Index Performance (US$)
As of March 31, 2016
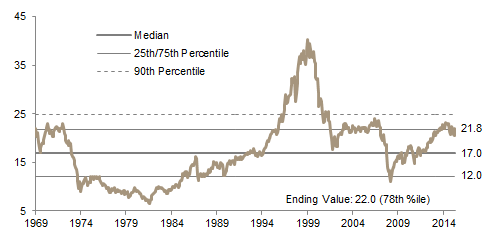
MSCI US Composite Normalized P/E
December 31, 1969 – March 31, 2016
Sources: Barclays, BofA Merill Lynch, FTSE International Limited, Frank Russell Company, J.P. Morgan Securities, Inc., MSCI Inc., National Association of Real Estate Investment Trusts, Standard & Poor’s, and Thomson Reuters Datastream. MSCI data provided “as is” without any express or implied warranties.
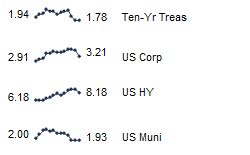
Fixed Income Yields
March 2015 – March 2016
Emerging markets debt and equities, Europe ex UK REITs, and European bonds gained in first quarter, while developed markets equities declined in euro terms. European equities suffered the worst declines; large caps in particular have underperformed for the last year
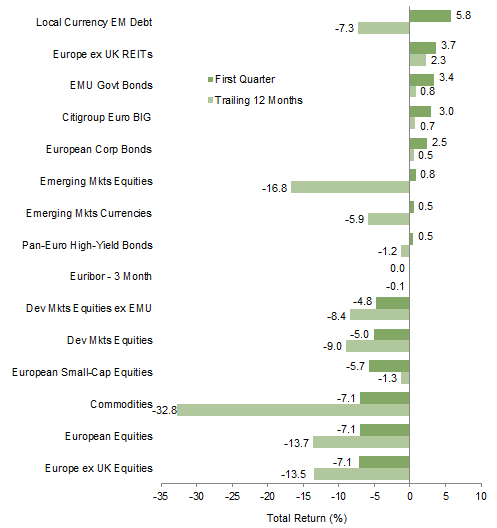
Index Performance (€)
As of March 31, 2016
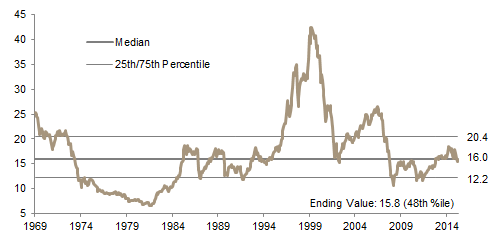
MSCI Europe ex UK Composite Normalized P/E
December 31, 1969 – March 31, 2016
Sources: Barclays, Citigroup Global Markets, EPRA, FTSE International Limited, J.P. Morgan Securities, Inc., MSCI Inc., National Association of Real Estate Investment Trusts, Standard & Poor’s, and Thomson Reuters Datastream. MSCI data provided “as is” without any express or implied warranties.

Fixed Income Yields
March 2015 – March 2016
UK bonds rallied for the quarter; UK equities were flat and UK REITs suffered losses, and both underperformed global equivalents, due in part to the weak pound. Emerging markets debt and equities enjoyed strong gains, with currency moves helping drive their outperformance

Index Performance (₤)
As of March 31, 2016
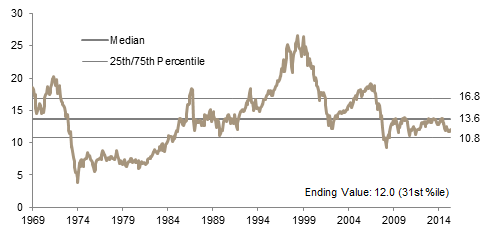
MSCI UK Composite Normalized P/E
December 31, 1969 – March 31, 2016
Sources: Barclays, BofA Merrill Lynch, EPRA, FTSE International Limited, J.P. Morgan Securities, Inc., MSCI Inc., National Association of Real Estate Investment Trusts, Standard & Poor’s, and Thomson Reuters Datastream. MSCI data provided “as is” without any express or implied warranties.
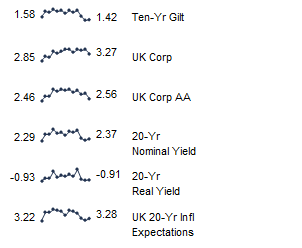
Fixed Income Yields
March 2015 – March 2016
Exhibit Notes
Performance Exhibits
Total returns for MSCI developed markets indexes are net of dividend taxes. Total returns for MSCI emerging markets indexes are gross of dividend taxes.
US dollar index performance chart includes performance for the Barclays Corporate Investment Grade, Barclays High Yield Bond, Barclays Municipal Bond, Barclays US TIPS, Barclays US Treasuries, BofA Merrill Lynch 91-Day Treasury Bills, FTSE® NAREIT All Equity REITs, J.P. Morgan ELMI+, J.P. Morgan GBI-EM Global Diversified, MSCI Emerging Markets, MSCI World, Russell 2000®, and S&P GSCI™ indexes.
Euro index performance chart includes performance for the Barclays Euro-Aggregate: Corporate, Barclays Pan-Euro High Yield, Citigroup EMU Govt Bonds, FTSE® EPRA/NAREIT Europe ex UK, J.P. Morgan ELMI+, J.P. Morgan GBI-EM Global Diversified, MSCI Emerging Markets, MSCI Europe, MSCI Europe ex UK, MSCI Europe Small Cap, MSCI World ex EMU, MSCI World, and S&P GSCI™ indexes.
UK sterling index performance chart includes performance for the Barclays Sterling Agg Corps, BofA Merrill Lynch Sterling High Yield, FTSE® British Government All Stocks, FTSE® British Government Index-Linked All Stocks, FTSE® EPRA/NAREIT UK RE, FTSE® 250, J.P. Morgan ELMI+, J.P. Morgan GBI-EM Global Diversified, MSCI Emerging Markets, MSCI Europe ex UK, MSCI World, MSCI World ex UK, and S&P GSCI™ indexes.
Valuation Exhibits
The composite normalized P/E ratio is calculated by dividing the inflation-adjusted index price by the simple average of three normalized earnings metrics: ten-year average real earnings (i.e., Shiller earnings), trend-line earnings, and return on equity–adjusted earnings. We have removed the bubble years 1998–2000 from our mean and standard deviation calculations. All data are monthly.
Fixed Income Yields
US fixed income yields reflect Barclays Municipal Bond Index, Barclays US Corporate High Yield Bond Index, Barclays US Corporate Investment-Grade Bond Index, and the ten-year Treasury.
European fixed income yields reflect the BofA Merrill Lynch Euro Corporate AA Bond Index, BofA Merrill Lynch Euro Corporate Bond Index, Barclays Pan-European Aggregate High Yield Bond Index, Bloomberg Twenty-Year European Government Bond Index (nominal), ten-year German bund, 20-year European Inflation Swaps (inflation expectations), and the real yield calculated as the difference between the inflation expectation and nominal yield.
UK sterling fixed income yields reflect the BofA Merrill Lynch Sterling Corporate AA Bond Index, BofA Merrill Lynch Sterling Corporate Bond Index, UK ten-year gilts, and Bank of England 20-year nominal, real, and zero coupon (inflation expectations) yields.