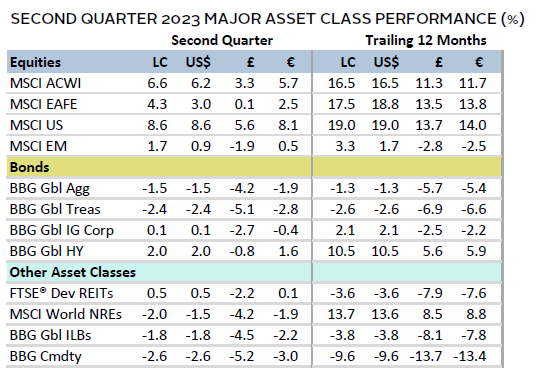
Performance was mixed in second quarter as several crosscurrents painted an uncertain outlook. Equities outperformed fixed income with mostly positive returns, as Japanese and US equities led. Growth and large-cap equities outperformed value and small-cap counterparts, but this lead narrowed in June. Large-cap technology explained much of this outperformance as investors grew optimistic on artificial intelligence (AI). Chinese equities were the bottom performer due to disappointing progress on reopening, which reversed the optimism from first quarter. Commensurately, real assets suffered on fears of slowing demand. High-yield bonds outperformed within fixed income in second quarter. UK sterling broadly appreciated, the euro and US dollar were mixed, and the Japanese yen depreciated sharply.
Sources: Bloomberg Index Services Limited, Bloomberg L.P., EPRA, FTSE International Limited, MSCI Inc., National Association of Real Estate Investment Trusts, and Thomson Reuters Datastream. MSCI data provided “as is” without any express or implied warranties.
Note: Local currency returns for the Bloomberg fixed income indexes, the Bloomberg Commodity Index, and the FTSE® Developed REITs are in USD terms.
The Macro Picture
Fluctuating market expectations for future central bank policy impacted both stocks and bonds during the quarter. Concerns of a liquidity crunch following the banking crisis and potential ructions from impasse on the US debt ceiling initially led investors to price in a more benign path for interest rates, even pricing in rate cuts by year-end. Although the Federal Reserve paused hikes in June to assess the impact of recent tightening, strong economic data and sticky inflation led the central bank to forecast two additional rate hikes this year. In addition, the Bank of England (BOE) delivered an outsized 50-basis point (bp) rate hike in June, as the United Kingdom remained embattled with one of the highest inflation rates in developed markets. Ultimately, market rate expectations broadly reverted higher, as other central banks also signaled an unwavering commitment to lowering inflation. Still, Japanese and Chinese monetary policies remained dovish, with the latter initiating stimulus measures in June to boost its economic recovery.
Economic data were mixed during the quarter, adding to the uncertain outlook. Purchasing manager index (PMI) data signaled a slow down across most developed markets, especially in manufacturing. The Eurozone was hit particularly hard, with manufacturing activity reaching a 37-month low in June. Data also showed the region entered a technical recession in first quarter. Labor market tightness was a common challenge in controlling inflation globally; however, US jobless claims briefly rose to a 20-month high in June. Fears of a global slowdown and a disappointing economic reopening for China weighed heavily on commodities, and higher rates and affordability concerns dampened real estate performance.
Equities
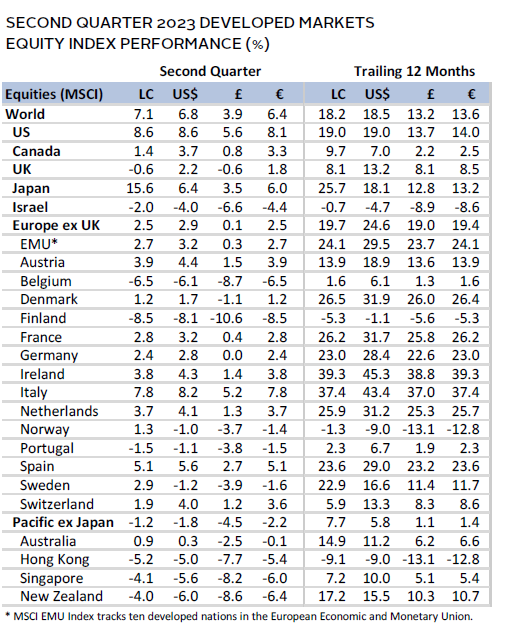
US equities outperformed DM ex US counterparts by nearly 5 percentage points (ppts) in second quarter. US stocks returned almost 17% YTD and the S&P 500 Index entered a new bull market. This was mostly due to investor frenzy around AI technologies, leading to both growth and large-cap strategies outperforming their counterparts in second quarter. Although, in June, investors favored the industrials and materials sectors instead of the quarter’s top-performing sectors—IT and communication services.
Investor optimism around AI and relatively strong economic data was tempered by various events. These included liquidity concerns due to the banking crisis, fears of not reaching a resolution on the debt ceiling, and heeding the Fed’s more hawkish tone despite a pause in rate hikes in June. Although both headline CPI data and the Fed’s preferred measure of inflation cooled in May to 4.0% and 3.8%, respectively, Chairman Powell made it clear that at least two additional rate hikes were probable by year-end. In June, the Fed ramped up its 2023 GDP growth expectations to 1.0% from 0.4% in March on robust economic data. Further, first quarter GDP estimates were revised up to 2.0% from the prior estimate of 1.3%. Housing starts and sales surprised to the upside, as did the consumer confidence survey, raising concerns that inflationary pressures remain. Additionally, while the June manufacturing PMI suggested activity contracted and reached a six-month low, with input prices declining at the fastest pace since May 2020, the flash services PMI remained in expansionary territory. Initial jobless claims, however, did briefly increase to a 20-month high, signaling some reprieve in the tight labor market—a large contributor to US inflation woes.
European equities lagged DM peers, as the Eurozone entered a technical recession, with its GDP declining by 0.1% quarter-over-quarter in both fourth quarter 2022 and first quarter 2023. Indeed, sentiment reversed from the investor optimism seen in first quarter, when it had become clear that the energy crisis had been contained. Preliminary Eurozone inflation bested expectations, cooling to 5.5% in June. However, the European Central Bank (ECB) continued to raise the deposit rate to 3.5% and emphasized the need for continued hiking to bring inflation to target (2%), which likely includes a 25-bp increase in July. While the inflationary impact from supply-chain challenges and energy prices have moderated, labor costs have proven more stubborn. Composite PMIs point to a stagnating economy, with the contraction in manufacturing activity deepening. While services activity has slowed in recent months, it remains in expansionary territory. Elsewhere, the Swiss National Bank and the Norges Bank increased rates by 25 bps and 50 bps, respectively, with the latter raising by more than expected.
UK equities posted negative returns, contrasting the 3.2% gain in first quarter. Performance reflected investor concerns as both headline and core inflation came in hotter than expected, hitting 8.7% and 7.1%, respectively, in May. These are the highest rates among developed markets. The BOE raised rates by 50 bps to 5.0%, versus earlier expectations of a 25-bp increase. Markets now expect policy rates to hit 6% by year-end, increasing concerns over housing affordability. The labor market remains a key concern, as pay increased by 6% in the three months ending May, continuing the fastest pace since 1991. The BOE signaled it remains committed to a tighter policy to curb inflation, even if it means prompting a recession.
Japanese equities outperformed developed markets by more than 8 ppts, as investors that flocked to the region expected to benefit from several tailwinds. New Bank of Japan (BOJ) Governor Ueda’s policy to remain dovish for now was well-received by markets, even as the central bank considers tweaks to its ultra-easy policy. Investors were also attracted to the country on the introduction of shareholder-friendly reforms encouraging a renewed focus on profitability and news that Warren Buffet was bullish on Japan. Near quarter-end, authorities shared concerns over the continued weakness of the yen and indicated another intervention to support the currency was not off the table. However, economic data released in June broadly disappointed. While flash PMI data suggested overall activity remains in expansionary territory, the index softened to a four-month low, and the manufacturing sector entered contractionary territory. Additionally, even though headline CPI moderated to 3.2%, “core-core” CPI (ex fresh food and energy) accelerated above expectations to 4.3%.
Pacific ex Japan equities declined, lagging DM by around 8 ppts. The Reserve Bank of Australia (RBA) paused rate hikes in April, but returned to rate increases in May, with additional tightening expected in 2023 to tackle still-high inflation. Hawkish sentiment has led to an inverted yield curve for the first time since 2008. Most observers believe that RBA Governor Lowe will not be reappointed when his term expires in September, given the criticism on policy guidance and communication. Economists have indicated that a double-dip recession is possible, expecting GDP to contract again later this year after having fallen into a mild recession in first quarter. The Reserve Bank of New Zealand achieved its forecasted peak interest rate of 5.5% in May and signaled no further increases.
Sources: MSCI Inc. and Thomson Reuters Datastream. MSCI data provided “as is” without any express or implied warranties.
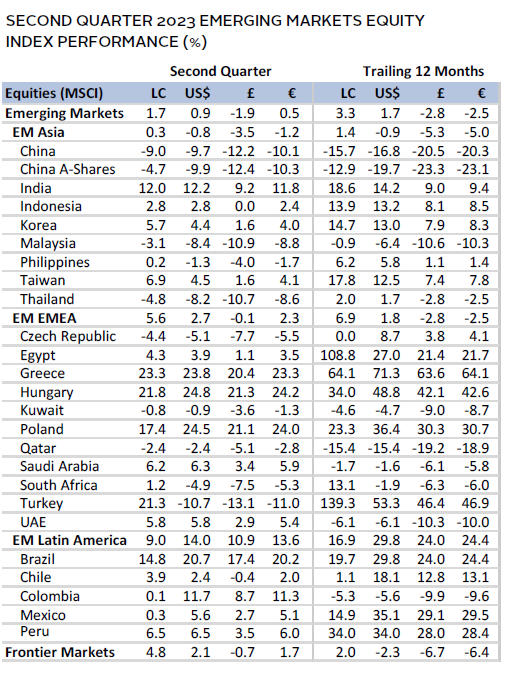
Emerging markets equities lagged DM peers in second quarter, with weakness from China heavily weighing on the group. Returns varied widely—Latin America and Europe, the Middle East & Africa led, while emerging Asia lagged by a wide margin, even as India posted strong results. Most central banks in Latin America held rates steady, albeit rates in the region are much higher than in developed markets. For instance, policy rates are 13.75% and 11.25% in Brazil and Mexico, respectively, versus recent inflation rates in those countries of 3.9% and 5.8%, which are nearing their respective targets. Indonesia also held rates at 5.75% as inflation continued to cool. Turkey, however, raised rates to a staggering 15% (from 8.5%) in June, although that underwhelmed analysts amid inflation of nearly 40%. South Africa remains committed to tight policy, expecting inflation to approach its target midpoint (4.5%) by third quarter. South Korean consumer sentiment improved, as automobile and ship exports rose materially in June; however, exports of semiconductor chips to China did weaken. India enjoyed robust economic activity in second quarter, and technology giants Amazon and Alphabet revealed large investments as Prime Minister Modi visited the United States, fueling further optimism.
Chinese equities performed dismally and lagged EM by nearly 11 ppts in second quarter, as optimism faded from the bullish reopening thesis. Instead, investors focused on deteriorating economic trends—including a less robust property sector and increasing local government and household debt loads. Disappointing economic data prompted the government to cut major lending rates by 10 bps in late June. Headlines highlighting geopolitical friction with the United States on the trade front also weighed on sentiment.
Sources: MSCI Inc. and Thomson Reuters Datastream. MSCI data provided “as is” without any express or implied warranties.
Fixed Income
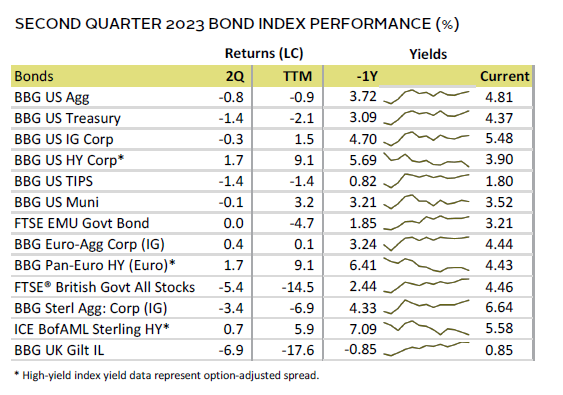
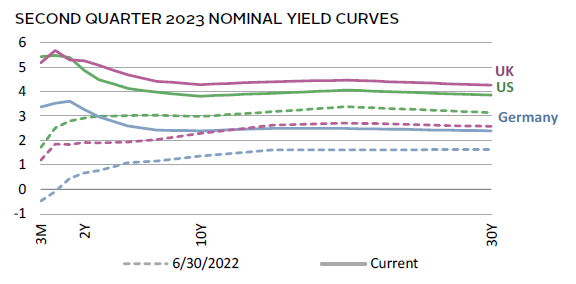
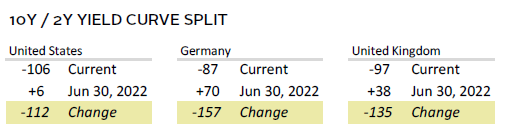
US fixed income assets mostly declined, as debt ceiling fears sent Treasury yields higher and credit default swap spreads soaring to all-time highs during second quarter. Yields rose as investors also priced in continued hawkish sentiment from the Fed given strong economic data. Still, the two major yield curve spreads (the ten-year/two-year and ten-year/three-month) inverted further, reinforcing heightened risks of recession. High-yield corporates outperformed their more rate-sensitive investment-grade equivalents, posting the only positive return, while TIPS performed at par with nominal peers. Five- and ten-year yields increased by 53 bps and 33 bps, respectively, to 4.13% and 3.81%.
Euro-denominated bonds mostly advanced while UK sterling fixed income assets mostly declined. Euro high-yield corporates out-performed EMU government and investment-grade bonds. Five- and ten-year German bund yields rose by 25 bps and 8 bps to 2.59% and 2.39%, respectively. Yields at the front end of the curve however expanded by much more, with the three-month up 64 bps to 3.52% and the two-year up 57 bps to 3.27%. Meanwhile in the United Kingdom, linkers delivered the worst performance, with only UK high-yield corporates posting a positive return. Five- and ten-year gilt yields increased by 127 bps and 81 bps, respectively, to 4.68% and 4.29%. The ten-year/two-year curve became markedly more inverted, and three-month yields rose to more than 5% by quarter-end.
Sources: Bank of England, Bloomberg Index Services Limited, Federal Reserve, FTSE Fixed Income LLC, FTSE International Limited, Intercontinental Exchange, Inc., and Thomson Reuters Datastream.
Real Assets
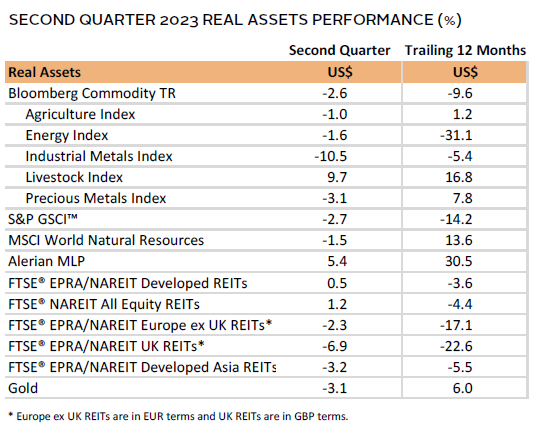
Real assets suffered in second quarter on renewed economic growth fears and an underwhelming Chinese economic reopening. Although performance reversed somewhat in June, it was not enough to post positive returns for the quarter. For instance, commodities were up 4% in June, but that still meant the asset class was down nearly 3% in second quarter.
Oil prices ($74.90 for Brent, $70.64 for WTI) fell nearly 6% during the quarter, reflecting increased fears of slowing growth. The commodity was unable to hold onto the optimism around demand growth stemming from the return of Chinese tourism. European natural gas prices are now down nearly 90% since their peak in August 2022. However, the commodity did get a boost on fears of increased uncertainty stemming from the short-lived mutiny attempt in Russia.
Global Natural Resources Equities led underlying commodities in June and during second quarter as investors began to price in a less severe recession, looking beyond weakening PMI data across developed markets. Most of this outperformance took place in June.
Global REITs were challenged across the board as bond yields pushed higher, with UK REITs posting the weakest returns. In the United States, despite marginally positive returns, headlines continued to highlight the mounting pressure on office REITs as lending conditions tighten and occupancy remains challenged.
Gold reversed course from first quarter, largely driven by higher bond yields despite increased uncertainty in markets. Broadly, however, prices remain near historical highs in nominal terms.
Sources: Alerian, Bloomberg L.P., EPRA, FTSE International Limited, Intercontinental Exchange, Inc., MSCI Inc., National Association of Real Estate Investment Trusts, Standard & Poor’s, and Thomson Reuters Datastream. MSCI data provided “as is” without any express or implied warranties.
Note: Gold performance based on spot price return.
USD-Based Investors
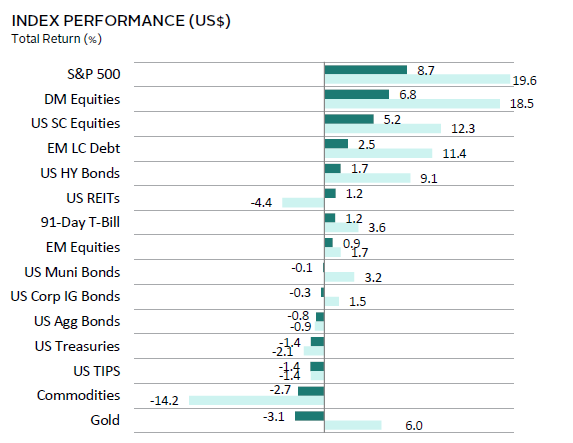
Risk assets were mixed in second quarter, as US equities posted strong returns. US stocks were driven higher by investor optimism for AI-led growth, although positive performance was not widespread, with IT accounting for most of the gains. US small caps also benefited from this trend, outperforming most other asset classes. Commodities posted weak returns, dragged down by concerns of China’s recovery stalling. US TIPS also lagged as inflation data moderated, and gold posted the weakest returns on stronger economic data and higher bond yields.
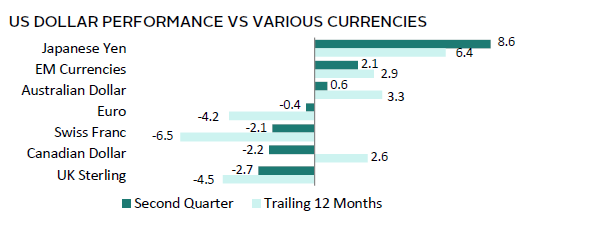
The US dollar was weak across most major currencies, but gained versus the Japanese yen, EM currencies, and the Australian dollar. It declined the most versus the UK sterling. Over the last 12 months, the directional movement in the US dollar trended similarly to second quarter, except that it gained versus the Canadian dollar.
Investor optimism was tempered due to various concerns, including anxiousness that a liquidity crunch would follow the banking crisis, fears of not reaching a resolution on the debt ceiling, and heeding the Fed’s more hawkish tone despite a pause in rate hikes in June. Although both headline CPI data and the Fed’s preferred measure of inflation cooled in May to 4.0% and 3.8%, respectively, Chairman Powell made it clear that at least two additional rate hikes were probable by year-end. In June, the Fed ramped up its 2023 GDP growth expectations to 1.0% from 0.4% in March on robust economic data. Further, first quarter GDP estimates were revised up to 2.0% from the prior estimate of 1.3%. Housing starts and sales surprised to the upside, as did the consumer confidence survey, raising concerns that inflationary pressures remain. Additionally, while the June manufacturing PMI suggested activity contracted and reached a six-month low, the flash services PMI remained expansionary.
Sources: Bloomberg Index Services Limited, FTSE International Limited, Frank Russell Company, Intercontinental Exchange, Inc., J.P. Morgan Securities, Inc., MSCI Inc., National Association of Real Estate Investment Trusts, Standard & Poor’s, and Thomson Reuters Datastream. MSCI data provided “as is” without any express or implied warranties.
EUR-Based Investors
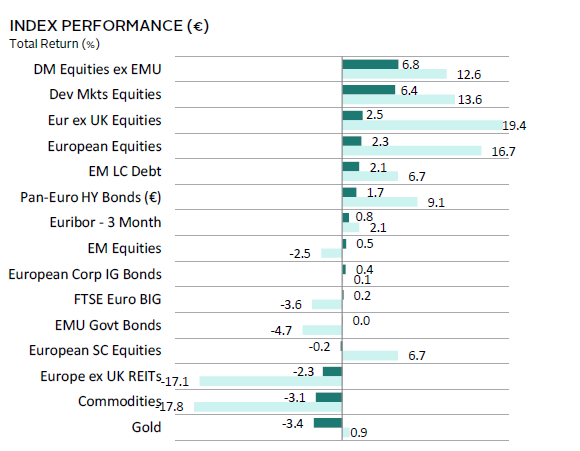
Risk assets were mostly positive in second quarter, save for real assets posting negative returns. Higher rates weighed on Europe ex UK REITs and gold, while concerns on China’s recovery stalling dragged down commodities. Over the last 12 months, REITs and commodities were the worst performers, driven by tighter lending conditions and slowing demand. European equities lagged DM equities but led fixed income. Within fixed income returns were modest, with the exception being EM local currency debt and high-yield euro bonds, where the outperformance was notable.
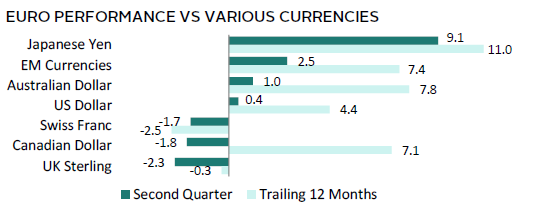
The euro was strong in second quarter, appreciating against the Japanese yen, EM currencies, Australian dollar, and US dollar. The ECB’s continued commitment to raise rates to combat inflation helped support the euro. Over the trailing 12 months, the common currency has advanced across most major currencies, except for the Swiss franc and UK sterling.
The Eurozone entered a technical recession in second quarter, with its GDP declining by 0.1% quarter-over-quarter in both fourth quarter 2022 and first quarter 2023. Eurozone inflation bested expectations, cooling to 5.5% in June. However, the ECB continued to raise the deposit rate to 3.5 % and emphasized the need for continued hiking to bring inflation to target (2%), which likely includes a 25-bp increase in July. While the inflationary impact from supply-chain challenges and energy prices have moderated, labor costs have proven more stubborn. Composite PMIs point to a stagnating economy, with the contraction in manufacturing activity deepening. While services activity has slowed in recent months, it remains in expansionary territory. Elsewhere, the Swiss National Bank and the Norges Bank increased rates by 25 bps and 50 bps, respectively, with the latter raising by more than expected.
Sources: Bloomberg Index Services Limited, EPRA, European Banking Federation, FTSE Fixed Income LLC, FTSE International Limited, Intercontinental Exchange, Inc., J.P. Morgan Securities, Inc., MSCI Inc., National Association of Real Estate Investment Trusts, Standard & Poor’s, and Thomson Reuters Datastream. MSCI data provided “as is” without any express or implied warranties.
GBP-Based Investors
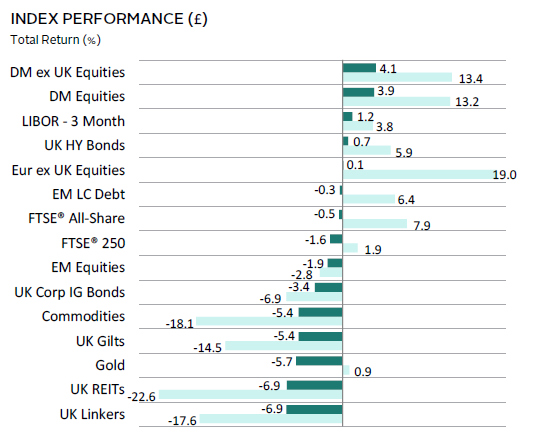
Risk assets were mixed, as broader DM equities led UK and Europe ex UK stocks. UK linkers, UK REITs, and gold were the worst performers, driven by higher interest rates and a slower-than-anticipated rebound from China. Cash was one of the top-performing assets, and UK high-yield corporates outperformed other fixed income categories. Over the last 12 months, REITs, commodities, linkers, and nominal gilts have been the worst performers, impacted by concerns from high inflation, tighter lending conditions, and slowing demand.
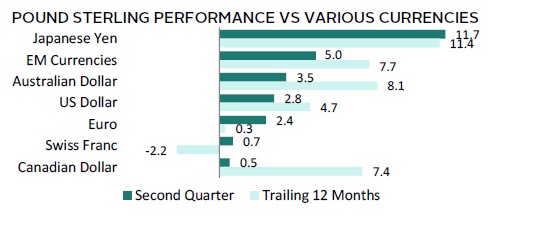
UK sterling advanced across the board in second quarter, gaining the most versus the Japanese yen and EM currencies. Performance followed a similar trend over the trailing 12 months, except that the pound fell versus the Swiss franc.
UK equities performance reflected investor concerns as both headline and core inflation came in hotter than expected, hitting 8.7% and 7.1%, respectively, in May. These are the highest rates among developed markets. The BOE raised rates by 50 bps to 5.0%, versus earlier expectations of a 25-bp increase. Markets now expect policy rates to hit 6% by year-end, increasing concerns over housing affordability. The labor market remains a key concern, as pay increased by 6% in the three months ending May, continuing the fasted pace since 1991. The BOE signaled it remains committed to a tighter policy to curb inflation, even if it means prompting a recession.
Sources: Bloomberg Index Services Limited, EPRA, FTSE International Limited, Intercontinental Exchange, Inc., J.P. Morgan Securities, Inc., MSCI Inc., National Association of Real Estate Investment Trusts, Standard & Poor’s, and Thomson Reuters Datastream. MSCI data provided “as is” without any express or implied warranties.
Performance Exhibits
All data are total returns unless otherwise noted. Total return data for all MSCI indexes are net of dividend taxes.
USD-Based Investors index performance chart includes performance for the Bloomberg US Aggregate Bond, Bloomberg US Corporate Investment Grade, Bloomberg US High Yield Bond, Bloomberg Municipal Bond, Bloomberg US TIPS, Bloomberg US Treasuries, ICE BofAML 91-Day Treasury Bills, FTSE® NAREIT All Equity REITs, J.P. Morgan GBI-EM Global Diversified, LBMA Gold Price, MSCI Emerging Markets, MSCI World, Russell 2000®, S&P 500, and S&P GSCI™ indexes.
EUR-Based Investors index performance chart includes performance for the Bloomberg Euro-Aggregate: Corporate, Bloomberg Pan-Euro High Yield (Euro), EURIBOR 3M, FTSE EMU Govt Bonds, FTSE Euro Broad Investment-Grade Bonds, FTSE® EPRA/NAREIT Europe ex UK RE, J.P. Morgan GBI-EM Global Diversified, LBMA Gold Price AM, MSCI Emerging Markets, MSCI Europe, MSCI Europe ex UK, MSCI Europe Small-Cap, MSCI World ex EMU, MSCI World, and S&P GSCI™ indexes.
GBP-Based Investors index performance chart includes performance for the Bloomberg Sterling Aggregate: Corporate Bond, Bloomberg Sterling Index-Linked Gilts, ICE BofAML Sterling High Yield, FTSE® 250, FTSE® All-Share, FTSE® British Government All Stocks, FTSE® EPRA/NAREIT UK RE, J.P. Morgan GBI-EM Global Diversified, LBMA Gold Price AM, LIBOR 3M GBP, MSCI Emerging Markets, MSCI Europe ex UK, MSCI World, MSCI World ex UK, and S&P GSCI™ indexes.
EM currencies is an equal-weighted basket of 20 emerging markets currencies.
Fixed Income Performance Table
Performance data for US TIPS reflect the Bloomberg US TIPS Index, with yields represented by the Bloomberg Global Inflation Linked Bond Index: US.