Investor sentiment soured in second quarter, leading to steep declines across nearly all asset classes. Global equities foundered as developed and emerging stocks alike fell into bear markets. Rising interest rates and deteriorating global economic growth prospects meant growth stocks trailed value, while large caps edged small caps. Aggressive monetary tightening and high inflation pressured government bond performance, while corporates lagged on rising credit spreads. Real assets also declined, with energy commodities being the lone exception among major asset classes as oil prices continued climbing. Against this backdrop, the US dollar appreciated to a 20-year high, euro performance was mixed, and UK sterling mostly weakened.

Sources: Bloomberg Index Services Limited, Bloomberg L.P., EPRA, FTSE International Limited, MSCI Inc., National Association of Real Estate Investment Trusts, and Thomson Reuters Datastream. MSCI data provided “as is” without any express or implied warranties.
Note: Local currency returns for the Bloomberg fixed income indexes, the Bloomberg Commodity Index, and the FTSE® Developed REITs are in USD terms.
The Macro Picture
Second quarter’s sharp global asset repricing was driven primarily by central bank maneuvering and its potential implications for global growth. Indeed, global rate setters have ramped up monetary tightening over concerns that recent multi-decade high inflation could become entrenched. The US Federal Reserve raised its benchmark policy rate by 125 basis points (bps), which was the fastest tightening pace since the late 1980s, as longer-term consumer inflation expectations hit their highest level in 14 years. Other major central banks also lifted rates while the European Central Bank (ECB) outlined its plans to begin rate hikes in July.
As policymakers forcefully tighten policy, investors have grown more concerned about an economic “hard landing,” where restrictive monetary conditions tip the economy into a recession. Beyond monetary policy, other developments clouded the economic outlook during second quarter—Russia cut its supply of natural gas to Europe, escalating the region’s energy crisis; China continued to impose strict COVID-19 lockdowns, which resulted in a domestic slowdown; and ongoing supply chain disruptions continued to spark fears that inflation could remain elevated even if growth stagnates.
These factors contributed to significant turmoil in risk assets. Global equities fell into bear market territory, with more speculative and rate-sensitive stocks bearing the brunt of the losses. Investment-grade bonds, which frequently ballast portfolios in such an environment, were not spared as bond yields rose sharply. In fact, global investment-grade bonds suffered their worst quarter on record in USD terms, with performance more than 3 standard deviations below average.
Equities
US equities fell into a bear market in second quarter, extending losses for the year. US equities experienced their sharpest quarterly drawdown since 2008 (outside the initial pandemic sell-off), bringing first half performance to the lowest since 1962. US stocks trailed developed ex US peers again as rising interest rates and economic growth concerns weighed on tech- and growth-heavy US shares; this dynamic was reflected in underlying sector performance. All 11 S&P 500 Index sectors declined, with consumer discretionary, communication services, and information technology falling the most. Defensive consumer staples and utilities fell the least, followed by energy. Growth trailed value by the widest margin since the tech bubble burst in 2000 and has given up nearly all its pandemic outperformance over value. Large caps edged small caps, outperforming for the fifth straight quarter.
The Fed appeared more willing to accept the economic consequences of its aggressive efforts to fight inflation, which reached new 40-year highs. The headline CPI unexpectedly accelerated in May to 8.6% year-over-year (YOY), while increases in core prices also topped expectations. High inflation has weighed on consumer sentiment, which fell to an all-time low in June, while confidence indicators also plunged. Consumer spending data weakened as nominal retail sales unexpectedly contracted in May and real consumption expenditures fell for the first time this year. Still, the US labor market held steady with unemployment at 3.6% and job gains in May exceeding expectations. Preliminary US PMI data for June remained in expansionary territory but came in below expectations, and new orders declined for the first time since July 2020. The Federal Reserve Bank of Atlanta now expects GDP contracted at a -2.1% annualized pace in second quarter.
European equities declined but bested broader developed markets due to US underperformance. However, European shares lagged developed ex US counterparts for a second straight quarter. UK stocks declined the least among major developed markets, bringing year-to-date (YTD) outperformance versus the developed index to nearly 20 percentage points (ppts). Europe ex UK shares have performed roughly on par with broader developed markets this year.
Eurozone inflation hit record highs in second quarter, prompting the ECB to prime markets for an exit from its eight-year-long negative policy rate environment. The ECB announced plans to lift the benchmark deposit rate by 25 bps and 50 bps in July and September, respectively, while also ending new asset purchases as planned at the beginning of July. Peripheral European bond spreads over bunds rose after the announcement, leading the central bank to take preliminary steps to mitigate financial fragmentation among the eurozone’s more heavily indebted countries. Preliminary PMI data for June missed expectations and suggested that eurozone growth slowed to its weakest pace in 16 months, driven by a decline in manufacturing output and a deceleration in the service sector.
The Bank of England (BOE) hiked policy rates by 25 bps in both May and June as inflation accelerated to a new 40-year high of 9.1% YOY. Economic data pointed to weakening momentum. GDP declined for a second straight month in April as manufacturing and industrial activity missed expectations. Consumer confidence fell to a record low in June, while retail sales ex auto fuel contracted more than expected. Although preliminary June PMI data remained in expansionary territory, new order growth slowed for a fourth straight month.
Japanese equities fell for a third straight quarter but outperformed broader developed markets. Japanese shares also managed to outperform in USD terms despite the yen depreciating almost 11% versus the greenback to its weakest level in nearly 25 years. The weak yen contributed to inflation hitting a seven-year high during the quarter, with broadening inflationary pressures across categories. Input prices also soared to near 10% YOY. Bank of Japan (BOJ) Governor Haruhiko Kuroda noted that recent yen weakness is a negative for the economy. Still, the BOJ remains steadfast in its commitment to accommodative monetary policy, viewing recent inflationary pressures as transitory, given limited pass-through to higher wages. As a result of its efforts to cap ten-year Japanese government bond yields at 0.25%, the BOJ now owns a record 50% of all outstanding Japanese government debt.
Pacific ex Japan equities bested broader developed markets for a second consecutive quarter. However, removing the impact from heavily weighted US stocks, Pacific ex Japan lagged other non-US developed markets. All four Pacific ex Japan countries fell on the quarter; Singapore and Australia lagged, whereas Hong Kong and New Zealand outperformed. Singapore announced a $1 billion-plus aid package to soften the sting from inflation, which has risen to the highest rate in a decade, given the country’s reliance on food and energy imports. The Reserve Bank of Australia hiked its benchmark cash rate by 75 bps in just over a month during the quarter, the fastest tightening pace since 1994. Likewise, the Reserve Bank of New Zealand lifted rates by 100 bps. Both countries are contending with above-target inflation, cooling housing prices, and tight labor markets.

Sources: MSCI Inc. and Thomson Reuters Datastream. MSCI data provided “as is” without any express or implied warranties.
Emerging markets equities declined but outperformed developed stocks for the first time in six quarters. In fact, emerging stocks topped developed peers by the widest margin in 13 years. This was mostly due to the outsized US equity drawdown; however, emerging shares still edged the developed ex US benchmark. Emerging Asia bested the broader index for the first time since late 2020, whereas emerging Europe, the Middle East & Africa (EMEA) and Latin America lagged. The latter region maintained its YTD outperformance but was weighed down, in part, by weaker commodity prices. Still, analysts have upgraded their 2022 earnings growth outlook by 23 ppts YTD. Index heavyweight China buoyed broader index performance, delivering among the only gains. All other major emerging countries fell by double digits.
Chinese equities were a bright spot among global stocks, gaining for the first time in a year. Shares rebounded on a late-quarter rollback of COVID-19 containment measures, easing policy, and signs of softening regulatory pressure on technology firms. Economic data also bounced back, with PMI measures for June indicating expansionary activity for the first time in four months, while YOY export growth accelerated and exceeded expectations in May. Other Asian countries declined amid signs of slowing global trade. Elsewhere in emerging markets, central banks continued hiking rates in second quarter. Latin America and EMEA countries are still tightening aggressively to fight inflation, but appear to be in the latter stages of their tightening cycles. Outside of China, multiple Asian countries have begun lifting interest rates as inflationary pressures have increased.

Sources: MSCI Inc. and Thomson Reuters Datastream. MSCI data provided “as is” without any express or implied warranties.
Fixed Income
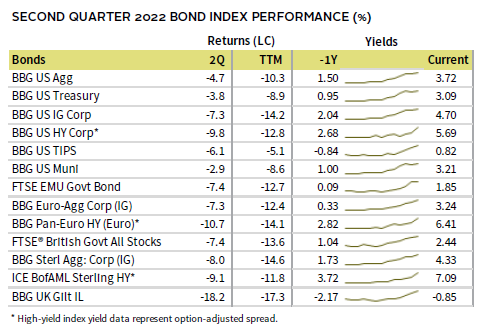
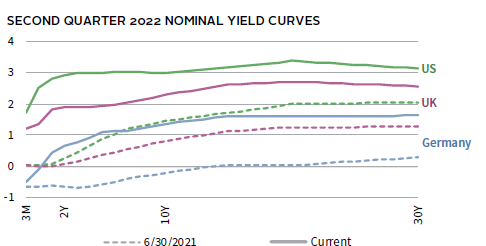
US investment-grade bonds sank in second quarter as high inflation prompted the Fed to tighten monetary policy more aggressively than originally anticipated. US bonds ended June with historic drawdowns—it was their weakest six-month start to a calendar year and trailing 12-month period on record since the mid-1970s. US Treasuries fared better than their corporate counterparts, as credit spreads widened the most since early 2020 and now sit above median levels. Five- and ten-year Treasury yields climbed 59 bps and 66 bps to 3.01% and 2.98%, respectively, as the yield curve ended the quarter inverted between these tenors. US TIPS trailed nominal Treasuries as ten-year TIPS yields rose nearly 120 bps, matching their largest quarterly increase on record. This meant ten-year breakeven inflation expectations fell 48 bps to 2.36%.
Performance among sterling- and euro-denominated bonds was similarly weak. High-yield corporates lagged in these markets, mirroring the relative performance and spread widening of their US counterparts. Five- and ten-year gilt yields rose 51 bps and 67 bps to 1.93% and 2.29%, respectively. Ten-year German bund yields advanced 81 bps to 1.37%, their highest quarter-end level since 2014. Highlighting the risk of fragmentation among eurozone economies, Italian BTP spreads over German bunds rose as much as 100 bps during the quarter and hit their highest level since early 2020.

Real Assets
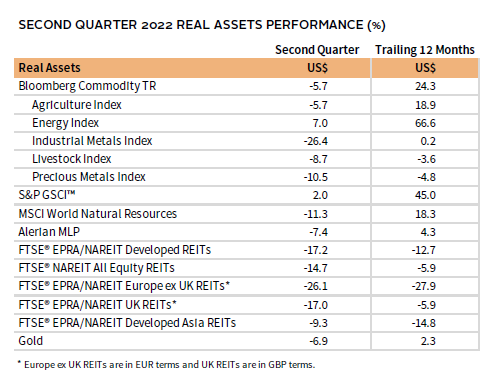
Energy commodities were effectively the only major asset class that gained in second quarter, leading to divergent performance among the major commodity futures benchmarks. Industrial metals declined the most, posting their largest quarterly drawdown since 2008. Growth-sensitive copper prices fell to a 16-month low, while others such as tin and zinc also plunged.
Oil prices ($114.81 for Brent and $105.76 for WTI) gained around 6% on the quarter, but global prices traded as high as $124/barrel in early June. Supply issues mounted as the EU embargoed most Russian oil imports in May. In early June, OPEC+ raised its planned production increase by roughly two-thirds but has struggled to meet output targets on reports of limited spare capacity. European natural gas prices advanced roughly 20%—contrasting with declines for the US benchmark—as Russia cut gas shipments through the major Nord Stream pipeline by about 60%, prompting Germany to activate the second of its three-step emergency gas plan.
Global natural resources equities and energy MLPs declined alongside broader stock markets.
Global REITs also posted steep losses as government bond yields continued climbing. Declines were broadly based across major regions, with Europe ex UK REITs lagging the most.
Gold prices stumbled to $1,806.87/troy ounce as central banks rolled back monetary accommodation, and US real yields and the dollar surged.
Sources: Alerian, Bloomberg L.P., EPRA, FTSE International Limited, Intercontinental Exchange, Inc., MSCI Inc., National Association of Real Estate Investment Trusts, Standard & Poor’s, and Thomson Reuters Datastream. MSCI data provided “as is” without any express or implied warranties.
Note: Gold performance based on spot price return.
USD-Based Investors
Nearly all asset classes declined in second quarter as high inflation, central bank tightening, and concerns over the economic outlook dented investor sentiment. Developed and growth-oriented US equities fell the most, underperforming their emerging markets peers. All fixed income categories ended in the red as yields rose, while rising credit spreads weighed on high-yield and investment-grade corporates relative to Treasuries. Commodities and cash delivered the only gains for the quarter. However, within commodities, energy was the only subcategory that gained, offsetting steep declines for industrial metals.
The US dollar strengthened to a 20-year high in second quarter, boosted by a more aggressive Fed and widening interest rate differentials. The greenback appreciated the most versus the Japanese yen, Australian dollar, and UK sterling. Performance was similarly robust over the past year.
Headline consumer prices unexpectedly accelerated in May to 8.6% YOY, a new 40-year high, while increases in core prices also topped expectations. Consumer sentiment fell to an all-time low in June, while confidence indicators also plunged. Weaker consumer spending data also weighed on the economic outlook, as nominal retail sales unexpectedly contracted in May and real consumption expenditures fell for the first time this year. Still, the US labor market held steady with unemployment at 3.6% and job gains in May exceeding expectations. Preliminary US PMI data for June remained in expansionary territory but came in below expectations across both manufacturing and services, while new orders declined for the first time since July 2020. The Federal Reserve Bank of Atlanta now expects GDP contracted at a -2.1% annualized pace in second quarter.


Sources: Bloomberg Index Services Limited, FTSE International Limited, Frank Russell Company, Intercontinental Exchange, Inc., J.P. Morgan Securities, Inc., MSCI Inc., National Association of Real Estate Investment Trusts, Standard & Poor’s, and Thomson Reuters Datastream. MSCI data provided “as is” without any express or implied warranties.
EUR-Based Investors
Nearly all asset classes declined in second quarter as high inflation, central bank tightening, and concerns over the economic outlook dented investor sentiment. Europe ex UK REITs, European small caps and broad developed equities fell the most, as US stocks weighed on the latter. European large- and mid-caps outperformed, while emerging markets stocks fell the least among equity assets. All fixed income categories ended in the red as yields rose, while rising credit spreads weighed on high-yield corporates relative to investment-grade peers. Commodities and gold delivered the only gains for the quarter. However, within commodities, energy was the only subcategory that gained, offsetting steep declines for industrial metals.
Euro performance was mixed, appreciating vis-à-vis the Japanese yen, Australian dollar, and UK sterling, while weakening the most versus the US and Canadian dollars. The common currency generally depreciated over the past year, particularly versus the US and Canadian dollars and Swiss franc. The euro gained against the yen over that period and was effectively flat relative to UK sterling.
Eurozone inflation hit record highs in second quarter, prompting the ECB to prime markets for an exit from its eight-year long negative policy rate environment. The ECB announced plans to lift the benchmark deposit rate by 25 bps and 50 bps in July and September, respectively, while also ending new asset purchases as planned at the beginning of July. Peripheral European bond spreads over bunds rose after the announcement, reflecting the risk of financial fragmentation among the eurozone’s more heavily indebted countries. Preliminary PMI data for June missed expectations and suggested that eurozone growth slowed to its weakest pace in 16 months, driven by a decline in manufacturing output and a deceleration in the service sector.


Bloomberg Index Services Limited, EPRA, European Banking Federation, FTSE Fixed Income LLC, FTSE International Limited, Intercontinental Exchange, Inc., J.P. Morgan Securities, Inc., MSCI Inc., National Association of Real Estate Investment Trusts, Standard & Poor’s, and Thomson Reuters Datastream. MSCI data provided “as is” without any express or implied warranties.
GBP-Based Investors
Nearly all asset classes declined in second quarter as high inflation, central bank tightening, and concerns over the economic outlook dented investor sentiment. Among equities, developed stocks and UK mid-caps fell the most, while broader UK stocks were bested only by emerging markets peers. All fixed income categories ended in the red as yields rose, while rising credit spreads weighed on high-yield and investment-grade corporates relative to gilts. Commodities, gold, and cash delivered the only gains for the quarter. However, within commodities, energy was the only subcategory that gained, offsetting steep declines for industrial metals.
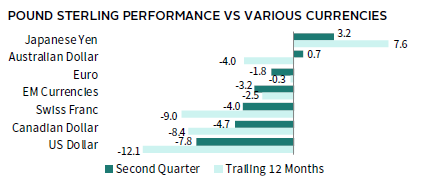
UK sterling weakened as economic data deteriorated and the BOE stuck with its initial rate hike pace. The pound depreciated the most versus the US and Canadian dollars and the Swiss franc but managed to gain against the broadly weaker Japanese yen and Australian dollar. UK Sterling weakened in a similar fashion over the past year, appreciating versus only the Japanese yen.
The BOE hiked policy rates by 25 bps in both May and June as inflation accelerated to a new 40-year high of 9.1% YOY. Economic data pointed to weakening momentum. GDP declined for a second straight month in April as manufacturing and industrial activity missed expectations. Consumer confidence fell to a record low in June, while retail sales ex auto fuel contracted more than expected. Although preliminary June PMI data remained in expansionary territory, new order growth slowed for a fourth straight month.

Sources: Bloomberg Index Services Limited, EPRA, FTSE International Limited, Intercontinental Exchange, Inc., J.P. Morgan Securities, Inc., MSCI Inc., National Association of Real Estate Investment Trusts, Standard & Poor’s, and Thomson Reuters Datastream. MSCI data provided “as is” without any express or implied warranties.
Performance Exhibits
All data are total returns unless otherwise noted. Total return data for all MSCI indexes are net of dividend taxes.
USD-Based Investors index performance chart includes performance for the Bloomberg US Aggregate Bond, Bloomberg US Corporate Investment Grade, Bloomberg US High Yield Bond, Bloomberg Municipal Bond, Bloomberg US TIPS, Bloomberg US Treasuries, ICE BofAML 91-Day Treasury Bills, FTSE® NAREIT All Equity REITs, J.P. Morgan GBI-EM Global Diversified, LBMA Gold Price, MSCI Emerging Markets, MSCI World, Russell 2000®, S&P 500, and S&P GSCI™ indexes.
EUR-Based Investors index performance chart includes performance for the Bloomberg Euro-Aggregate: Corporate, Bloomberg Pan-Euro High Yield (Euro), EURIBOR 3M, FTSE EMU Govt Bonds, FTSE Euro Broad Investment-Grade Bonds, FTSE® EPRA/NAREIT Europe ex UK RE, J.P. Morgan GBI-EM Global Diversified, LBMA Gold Price AM, MSCI Emerging Markets, MSCI Europe, MSCI Europe ex UK, MSCI Europe Small-Cap, MSCI World ex EMU, MSCI World, and S&P GSCI™ indexes.
GBP-Based Investors index performance chart includes performance for the Bloomberg Sterling Aggregate: Corporate Bond, Bloomberg Sterling Index-Linked Gilts, ICE BofAML Sterling High Yield, FTSE® 250, FTSE® All-Share, FTSE® British Government All Stocks, FTSE® EPRA/NAREIT UK RE, J.P. Morgan GBI-EM Global Diversified, LBMA Gold Price AM, LIBOR 3M GBP, MSCI Emerging Markets, MSCI Europe ex UK, MSCI World, MSCI World ex UK, and S&P GSCI™ indexes.
EM currencies is an equal-weighted basket of 20 emerging markets currencies.
Fixed Income Performance Table
Performance data for US TIPS reflect the Bloomberg US TIPS Index, with yields represented by the Bloomberg Global Inflation Linked Bond Index: US.