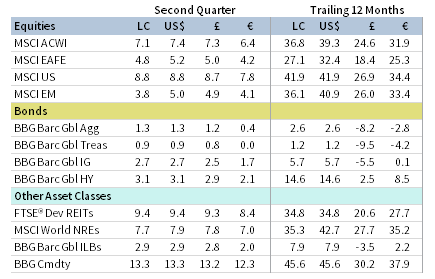
Risk assets excelled in second quarter, driven by improving economic momentum. Global equities reached new all-time highs, advancing for the fifth consecutive quarter; developed shares outperformed emerging equivalents. Value lagged growth, while small caps trailed large caps—both reversals of trends from recent quarters. Fixed income assets advanced despite rising inflation, led by corporate and inflation-linked bonds. Real assets delivered hefty gains as resurgent demand boosted commodity prices. The US dollar mostly depreciated during the quarter, while the euro and UK sterling were mixed.
Sources: Bloomberg Index Services Limited, Bloomberg L.P., FTSE International Limited, MSCI Inc., and Thomson Reuters Datastream. MSCI data provided “as is” without any express or implied warranties.
Note: Local currency returns for the Bloomberg Barclays indexes, the Bloomberg Commodity Index, and the FTSE® Developed REITs are in USD terms.
The Macro Picture
Inflationary pressures mounted during the quarter, leading to surging producer and consumer prices. But markets took these higher inflation prints in stride, perhaps reflecting a consensus view that the inflationary spike will subside. Indeed, temporary factors, such as pent-up demand and supply chain disruptions, are expected to abate as conditions normalize. Moreover, bond yields and market inflation expectations generally declined or held steady during the quarter, in contrast to sharply rising yields during first quarter. Value stocks, which typically benefit from inflationary cyclical upswings, trailed their growth counterparts for the first time in two quarters.
While most central bankers continue to view the recent high inflation as transitory, rate setters pivoted to a more-hawkish-than-expected stance regarding the path of future policy. Following its June meeting, the Federal Reserve forecasted two 25 basis point (bp) rate hikes in 2023—whereas prior guidance showed no rate hikes until 2024 at the earliest—and began discussing the need to plan for tapering asset purchases at future meetings. Other developed central banks similarly adjusted policy, while several emerging markets policymakers raised rates.
COVID-19 and virus variants remain a key risk to the sustainability of the economic rebound, particularly amid high valuations across most capital market asset classes. Rising cases in Singapore, Taiwan, and Japan forced tighter containment measures, while the newly identified Delta variant—which was largely to blame for the devastating virus wave in India—spread globally. In Australia, nearly half the population was under lockdown at the end of second quarter, while the United Kingdom, a global leader in inoculation rates, was forced to delay its full reopening.
Equities
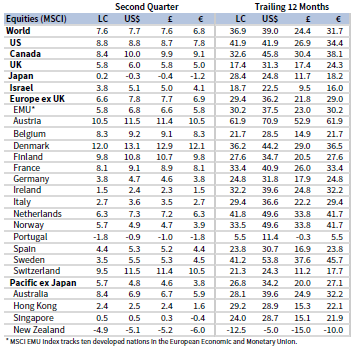
US equities advanced for the fifth consecutive quarter, outperforming their developed ex US and emerging markets equivalents, and closing the quarter at all-time highs. The VIX index of implied volatility fell to its lowest level since February 2020, and was below the long-term average more than 80% of the time during the quarter. Ten of 11 S&P 500 Index sectors gained, led by real estate, information technology, and energy, whereas utilities declined. Value trailed growth and small caps lagged large caps, though value and small caps maintained their respective outperformance edge year-to-date. US corporate earnings per share grew 52% year-over-year in first quarter, vastly exceeding expectations. Analysts have upgraded second quarter growth expectations to more than 60% year-over-year as a record number of companies have revised guidance higher.
US economic activity was robust in second quarter as inflation accelerated. Business activity indicators rose to record high levels across both manufacturing and services despite survey respondents highlighting significant supply constraints, rising input prices, and difficulty finding staff. Indeed, net job additions underwhelmed expectations during the quarter, but the unemployment rate fell to a pandemic low of 5.8%. Consumer and producer price inflation rose to multi-year high year-over-year rates, driven in part by depressed levels in comparable periods and one-off items. While retail sales and consumer spending leveled off as the quarter progressed, spending levels remained well above pre-pandemic levels. Consensus estimates call for 10% GDP growth in second quarter, accelerating from the 6.4% annualized pace in first quarter. President Biden endorsed a $1.2 trillion infrastructure plan reached between a bipartisan group of senators and administration officials, raising expectations that fiscal policy will remain supportive.
European equities gained but underperformed broader developed markets due to US outperformance; European shares bested the developed ex US equity index. Europe ex UK topped UK counterparts for the ninth time in the past ten quarters. UK stocks have trailed most other major developed markets year-to-date and continue to trade at a steep discount to broader developed stocks on a normalized valuation basis.
Eurozone business activity expanded at the fastest rate in 15 years, according to preliminary survey data, as the vaccine-enabled economic reopening lifted confidence. The services sector returned to growth during the quarter, while manufacturing activity (which had recovered to growth prior to services) remained strongly expansionary. Firms reported that demand is outstripping supply, leading to an unprecedented rate of price increases across both manufacturing and services. Improving activity has lifted both business and consumer confidence to multi-year highs. The European Central Bank (ECB) made no changes to monetary policy during the quarter and plans to continue its pandemic stimulus program through at least March 2022, in line with previous guidance. The central bank also raised their GDP and inflation outlook, but reiterated their view that inflation is likely to be temporary.
In the United Kingdom, business activity indicators reached their highest levels on record, with firms reporting high input and output price inflation during the quarter. Monthly GDP data showed accelerating economic growth in April following a contraction in first quarter. The Bank of England (BOE) held monetary policy and guidance steady during the quarter—though currency markets had been positioned for more hawkish guidance—and raised inflation and GDP growth forecasts. UK consumer price growth in May exceeded the Bank of England’s 2% target for the first time in nearly two years.
Japanese equities trailed broader developed stocks for the first time in two quarters, and have returned the least year-to-date among major developed regions. Authorities imposed the third COVID-19 state of emergency during the quarter, restricting economic activity, which ultimately drove overall business activity indicators back into contractionary territory. The services sector was responsible for the decline in overall activity as manufacturing remained expansionary. Strong external demand has supported manufacturing, with sentiment reaching its highest level since fourth quarter 2018. The Bank of Japan made no major policy changes during the quarter, while consumer prices deflated for an eighth straight month in May.
Pacific ex Japan equities advanced in second quarter, but trailed broader developed markets due to strong US equity performance. Pacific ex Japan stocks outgained developed ex US counterparts. Australia drove performance for the quarter, while Hong Kong and Singapore gained but underperformed, and New Zealand declined. New Zealand shares declined despite continued economic momentum during the quarter, which prompted the Reserve Bank of New Zealand to unexpectedly forecast rate hikes beginning in September 2022, earlier than prior guidance. Singapore, which had been largely successful combatting the spread of COVID-19, imposed containment measures as variant cases rose in the country. The Australian economy grew at a faster than expected rate in first quarter, while the Reserve Bank of Australia has given no indication it will tighten policy earlier than previously forecast.
Sources: MSCI Inc. and Thomson Reuters Datastream. MSCI data provided “as is” without any express or implied warranties.
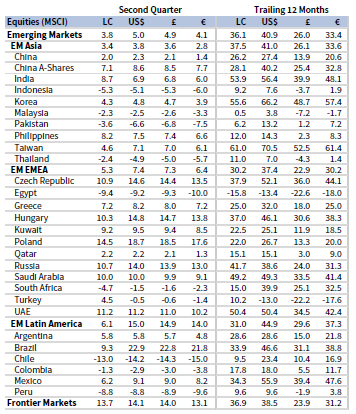
Emerging markets equities advanced for the fifth consecutive quarter following the COVID-19–driven drawdown in first quarter 2020, but delivered the lowest gain over that period. Emerging markets trailed developed counterparts for the second straight quarter, bringing year-to-date underperformance to 6.3 percentage points. As of quarter-end, emerging markets also underperformed on a trailing 12-month basis for the first time since the trailing 12 months ended June 2020. Latin America and emerging Europe, the Middle East & Africa outperformed among regions, whereas heavily weighted emerging Asia lagged. Latin America’s return was more than twofold higher in major currency terms as the Brazilian real appreciated between 12% and 13% across major currency pairs. Brazil, India, Taiwan, and Korea all bested the broader index, China advanced but underperformed, whereas South Africa declined. South African authorities imposed stricter containment measures as the country dealt with a third wave of COVID-19 infections.
Several major emerging markets central banks raised rates in response to rising inflation, including Mexico, Brazil, and Russia, which helped their associated currencies appreciate. In China, producer prices rose 9.0% year-over-year in May, exceeding expectations and recording the highest clip since 2008, driven largely by surging commodity prices. Authorities took several measures to ease the inflationary pressures, including taking steps to clamp down on excessive commodity speculation and hoarding and releasing the national metals stockpile for the first time publicly since 2010. While input prices have soared, consumer price inflation has been more benign at 1.3% year-over-year in May, below the recent rates seen in some developed economies. Chinese business activity has remained expansionary across manufacturing and services, but indicated growth cooled during the quarter.
Sources: MSCI Inc. and Thomson Reuters Datastream. MSCI data provided “as is” without any express or implied warranties.
Fixed Income
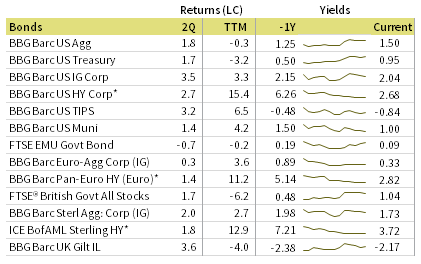
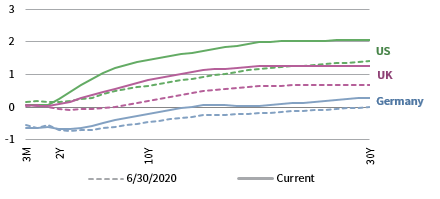
US fixed income broadly gained in second quarter as yields declined despite accelerating price inflation. Investment-grade and high-yield corporate bonds outgained Treasuries, tightening credit spreads to near all-time lows. Inflation-adjusted high-yield bond yields fell into negative territory for the first time during the quarter, as inflation rates topped all-time low nominal yields. Five- and ten-year Treasury yields declined 5 bps and 29 bps to 0.87% and 1.45%, respectively. Longer-term 30-year Treasury Yields declined 35 bps. The yield curve flattened as Fed policy developments boosted shorter-term yields; the ten-year/two-year Treasury yield spread fell 38 bps, the largest curve flattening since fourth quarter 2018. TIPS bested nominal Treasuries and ten-year breakeven inflation declined 5 bps to 2.32%; however, inflation expectations had reached as high as 2.54% intra-quarter.
UK linkers gained the most among sterling-denominated fixed income, while relative Gilt and corporate bond performance mirrored their US counterparts. Five- and ten-year Gilt yields declined 3 bps and 11 bps to 0.36% and 0.82%, respectively. Euro-denominated high-yield corporate bonds bested their investment-grade and sovereign peers, as euro area government bonds declined. Ten-year German bund yields rose 9 bps to -0.20%, while peripheral yields mostly climbed as European economies reopened and economic momentum accelerated.
* High-yield index yield data represent option-adjusted spread.
Sources: Bank of England, Bloomberg Index Services Limited, BofA Merrill Lynch, Federal Reserve, FTSE Fixed Income LLC, FTSE International Limited, Intercontinental Exchange, Inc., and Thomson Reuters Datastream.
Real Assets
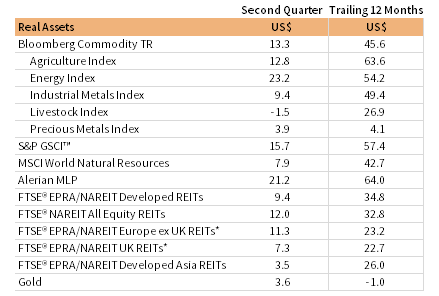
Commodity futures delivered their strongest quarterly returns in more than ten years, led by energy, agriculture, and industrial metals. Certain industrial metals such as copper and iron ore reached all-time highs during the quarter, while broad commodity spot prices rose to their highest nominal levels in a decade.
Oil prices ($75.13 for Brent and $73.47 for WTI) each surpassed the $70/barrel mark for the first time in several years, as some analysts estimated the oil market is currently running at a 3 million barrel/day deficit. Oil prices have now risen about 50% year-to-date, their best first half performance since 2008. OPEC+ members announced plans to gradually increase production during the quarter, reversing some of the deep cuts made at the start of the pandemic. The group is debating further production increases in early July as global demand continues to rebound.
Global natural resources equities and MLPs advanced, with the latter notching its third consecutive 20%+ quarterly return.
Global developed REITs topped the broader equity market in second quarter. Among regions, US REITs and Europe ex UK REITs outperformed, while UK REITs and developed Asia REITs also gained but lagged the aggregate REIT index.
Gold prices climbed to $1,765.43/troy ounce, but trailing 12-month performance turned negative for the first time since the 12-month period ended May 2019. The yellow metal had advanced nearly 12% quarter-to-date through May, but prices faltered in June as the Fed took a more hawkish stance.
* Europe ex UK REITs are in EUR terms and UK REITs are in GBP terms.
Sources: Alerian, Bloomberg L.P., EPRA, FTSE International Limited, Intercontinental Exchange, Inc., MSCI Inc., National Association of Real Estate Investment Trusts, Standard & Poor’s, and Thomson Reuters Datastream. MSCI data provided “as is” without any express or implied warranties.
Notes: Total return data for all MSCI indexes are net of dividend taxes. Gold performance based on spot price return.
USD-Based Investors
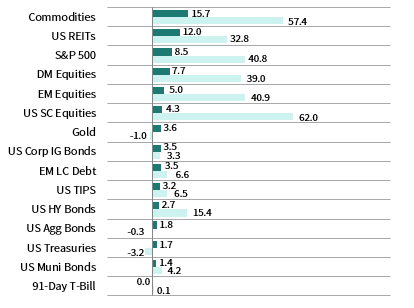
Real assets and equities led performance in second quarter, driven by robust economic activity. Commodities gained the most and have also been one of the top performers over the past year. US large caps bested all other major equity categories, while US small caps and emerging markets stocks lagged. Still, small caps were the top performer over the past year. Gold prices faltered in June as the Fed provided more-hawkish-than-expected guidance.
Corporate bonds and TIPS outperformed among domestic fixed income assets, reflecting the risk-on and inflationary environment. High-yield corporate bonds outperformed over the past year as yields have fallen to all-time lows, caving into negative territory in inflation-adjusted terms. Treasuries also gained as yields declined despite accelerating inflation.
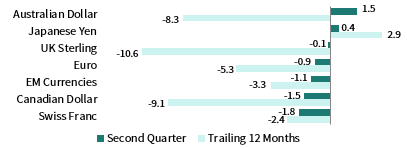
The US dollar mostly depreciated in second quarter, falling the most vis-à-vis the Swiss franc, Canadian dollar, and emerging markets currencies. The dollar appreciated versus the Australian dollar and Japanese yen. The greenback generally weakened over the past year, gaining versus only the Japanese yen.
Business activity indicators rose to record high levels across both manufacturing and services despite survey respondents highlighting significant supply constraints, rising input prices, and difficulty finding staff. Consumer and producer price inflation rose to multi-year high year-over-year rates, driven in part by depressed levels in comparable periods and one-off items. While retail sales and consumer spending leveled off as the quarter progressed, spending levels remained well above pre-pandemic levels. Consensus estimates call for 10% GDP growth in second quarter, accelerating from the 6.4% annualized pace in first quarter.
Sources: Bloomberg Index Services Limited, FTSE International Limited, Frank Russell Company, Intercontinental Exchange, Inc., J.P. Morgan Securities, Inc., MSCI Inc., National Association of Real Estate Investment Trusts, Standard & Poor’s, and Thomson Reuters Datastream. MSCI data provided “as is” without any express or implied warranties.
EUR-Based Investors
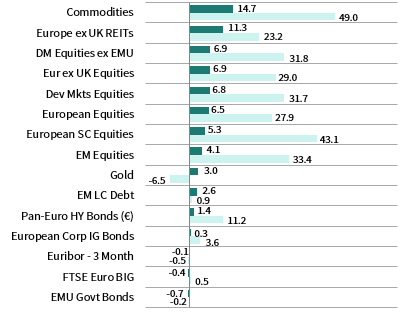
Real assets and equities led performance in second quarter, driven by robust economic activity. Commodities gained the most and have also delivered the highest returns over the past year. Europe ex UK stocks bested broader developed markets, which in turn outgained emerging markets. European small caps trailed their large- and mid-cap peers, but have outperformed over the past year. Gold prices faltered in June as the Fed provided more-hawkish-than-expected guidance.
Corporate bonds outperformed among domestic fixed income assets, reflecting the risk-on environment. Corporates also outperformed over the past year as yields and credit spreads have continued to compress. Euro area government bonds declined as yields rose across most core and peripheral countries.
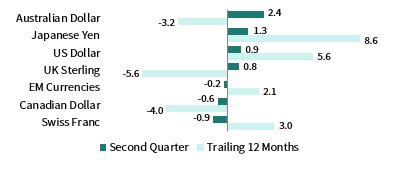
The euro was mixed in second quarter, appreciating the most versus the Australian dollar, Japanese yen, and US dollar, but declining against the Swiss franc, Canadian dollar, and emerging markets currencies. The common currency is similarly mixed over the past year, gaining the most vis-à-vis traditional safe havens such as the Japanese yen, US dollar, and Swiss franc, while depreciating the most against the UK sterling.
Eurozone business activity expanded at the fastest rate in 15 years, according to preliminary survey data, as the vaccine-enabled economic reopening boosted confidence. The services sector returned to growth during the quarter, while manufacturing activity (which had recovered to growth prior to services) remained strongly expansionary. The ECB made no changes to monetary policy during the quarter and plans to continue its pandemic stimulus program through at least March 2022, in line with previous guidance.
Sources: Bloomberg Index Services Limited, EPRA, European Banking Federation, FTSE Fixed Income LLC, FTSE International Limited, ICE Benchmark Administration Ltd., J.P. Morgan Securities, Inc., MSCI Inc., National Association of Real Estate Investment Trusts, Standard & Poor’s, and Thomson Reuters Datastream.
GBP-Based Investors
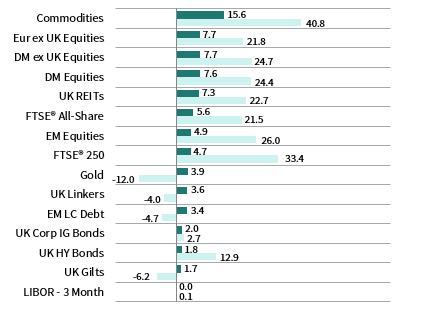
Real assets and equities led performance in second quarter, driven by robust economic activity. Commodities gained the most and have also delivered the highest returns over the past year. Europe ex UK stocks bested UK shares and broader developed markets, which in turn outgained emerging markets. UK mid-caps gained the least among equity categories, but have outperformed over the past year. Gold prices faltered in June as the Fed provided more-hawkish-than-expected-guidance.
Corporate bonds and linkers outperformed among domestic fixed income assets, reflecting a risk-on and inflationary environment. High-yield corporate bonds outperformed over the past year as yields and spreads have continued to compress. Gilts also gained as yields declined despite an inflationary pick up.
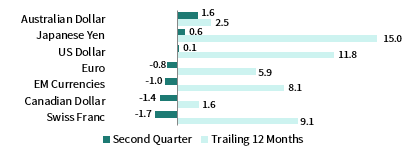
UK sterling was mixed in second quarter, declining the most against the Swiss franc, Canadian dollar, and emerging markets currencies. Sterling appreciated versus the Australian dollar, Japanese yen, and US dollar. The pound gained broadly over the past year, advancing the most versus the traditionally safe-haven Japanese yen, US dollar, and Swiss franc.
Business activity indicators reached their highest levels on record during the quarter, with firms reporting high input and output price inflation. Monthly GDP data showed accelerating economic growth in April following a contraction in first quarter. The BOE held monetary policy and guidance steady during the quarter and raised inflation and GDP growth forecasts. The United Kingdom was forced to delay its full reopening due to the emergence and spread of the Delta variant.
Sources: Bloomberg Index Services Limited, EPRA, FTSE International Limited, Intercontinental Exchange, Inc., ICE Benchmark Administration Ltd., J.P. Morgan Securities, Inc., MSCI Inc., National Association of Real Estate Investment Trusts, Standard & Poor’s, and Thomson Reuters Datastream.
Performance Exhibits
All data are total returns unless otherwise noted. Total return data for all MSCI indexes are net of dividend taxes.
USD-Based Investors index performance chart includes performance for the Bloomberg Barclays US Aggregate Bond, Bloomberg Barclays US Corporate Investment Grade, Bloomberg Barclays US High Yield Bond, Bloomberg Barclays Municipal Bond, Bloomberg Barclays US TIPS, Bloomberg Barclays US Treasuries, ICE BofAML 91-Day Treasury Bills, FTSE® NAREIT All Equity REITs, J.P. Morgan GBI-EM Global Diversified, LBMA Gold Price, MSCI Emerging Markets, MSCI World, Russell 2000®, S&P 500, and S&P GSCI™ indexes.
EUR-Based Investors index performance chart includes performance for the Bloomberg Barclays Euro-Aggregate: Corporate, Bloomberg Barclays Pan-Euro High Yield (Euro), EURIBOR 3M, FTSE EMU Govt Bonds, FTSE Euro Broad Investment-Grade Bonds, FTSE® EPRA/NAREIT Europe ex UK RE, J.P. Morgan GBI-EM Global Diversified, LBMA Gold Price AM, MSCI Emerging Markets, MSCI Europe, MSCI Europe ex UK, MSCI Europe Small-Cap, MSCI World ex EMU, MSCI World, and S&P GSCI™ indexes.
GBP-Based Investors index performance chart includes performance for the Bloomberg Barclays Sterling Aggregate: Corporate Bond, Bloomberg Barclays Sterling Index-Linked Gilts, ICE BofAML Sterling High Yield, FTSE® 250, FTSE® All-Share, FTSE® British Government All Stocks, FTSE® EPRA/NAREIT UK RE, J.P. Morgan GBI-EM Global Diversified, LBMA Gold Price AM, LIBOR 3M GBP, MSCI Emerging Markets, MSCI Europe ex UK, MSCI World, MSCI World ex UK, and S&P GSCI™ indexes.
EM currencies is an equal-weighted basket of 20 emerging markets currencies.
Fixed Income Performance Table
Performance data for US TIPS reflect the Bloomberg Barclays US TIPS Index, with yields represented by the Bloomberg Barclays Global Inflation Linked Bond Index: US.
