Risk assets broadly rallied in second quarter, sharply reversing course after experiencing extraordinary market turmoil in February and March. Developed markets equities posted their best quarterly return since fourth quarter 1998, outpacing emerging markets. Global growth stocks trounced value, while small caps outpaced large caps. High-yield and investment-grade corporate bonds handily outperformed sovereigns as credit spreads narrowed. Real assets broadly gained as oil prices sharply bounced back from all-time lows, posting their highest quarterly price increase in 30 years. The US dollar and UK sterling broadly weakened, while the euro was mixed.

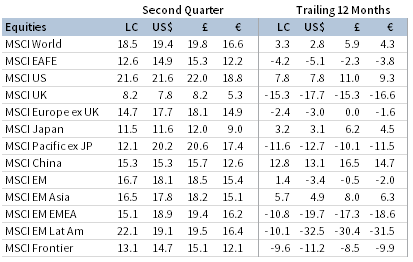
SECOND QUARTER MAJOR ASSET CLASS PERFORMANCE (%)
Sources: Bloomberg Index Services Limited, Bloomberg L.P., FTSE International Limited, MSCI Inc., and Thomson Reuters Datastream. MSCI data provided “as is” without any express or implied warranties.
Note: Local currency returns for the Bloomberg Barclays indexes, the Bloomberg Commodity Index, and the FTSE® Developed REITs are in US dollar terms.
The Macro Picture
Global equities swiftly recouped the bulk of their first quarter losses as investors turned optimistic about an economic rebound, supported by abundant central bank and fiscal policy measures. The quarter began with the global economy in virtual standstill, with many countries following stringent lockdown guidelines in efforts to flatten the curve of coronavirus cases. As new cases steadily declined, countries quickly began taking steps to reopen, supporting a shift in risk appetite amid signs that the economy was beginning to improve. However, some public health experts warned that prematurely reopening could have serious consequences.
By June, global cases reached 10 million, driven by surging cases in the US, Brazil, and India. In the United States, outbreaks across southern and western states forced officials to roll back plans for economic reopening and reimplement certain restrictions. These reversals threaten to take an additional toll on economic activity, at a time when the global economy stands on shaky ground. Investors are faced with the conundrum of whether the economy is still primed to meet the lofty expectations that the markets have priced in. While markets have so far largely brushed this risk aside, economists struck a more cautious tone. The International Monetary Fund (IMF) downgraded global growth forecasts again in June (now expecting a decline of 4.9% for 2020) noting that the recovery is projected to be more gradual than previously forecast, and that the extent of the recent rebound in financial market sentiment appears disconnected from shifts in underlying economic prospects.
Equities
US equities posted their largest quarterly gain since 1998, outperforming developed ex US counterparts by 12 percentage points over the past year. US stocks have retraced 77% of their peak-to-trough drawdown, gaining 40.1% since the March 23 low, and are just 8% below their all-time high. Tech stocks, represented by the Nasdaq Composite Index, reached record highs in June and finished the quarter nearly 50% above their March 23 lows. All 11 S&P 500 sectors advanced, led by cyclicals; consumer discretionary, information technology, energy, and materials all advanced more than 25%. Defensive utilities and consumer staples were the only sectors not to experience double-digit gains. Small caps topped large caps, while growth stocks’ dominance over value continued. Over the past 12 months, growth has outperformed value by the widest margin since data began in 1975.
US first quarter GDP declined at a 5.0% annualized rate, worse than initially expected, and the National Bureau of Economic Research affirmed that the US economy officially entered a recession in February, ending the longest expansion in US history. Weekly initial unemployment claims were filed at a staggering rate, with 14 consecutive weeks each exceeding the previous record of 695,000 claims set in 1982. Nearly 50 million workers in the United States have filed for unemployment benefits since the initial surge in March. The unemployment rate touched 14.7%—a level last seen during the Great Depression. Despite the bleak economic backdrop, investors have continued to price in expectations of a rapid return to economic normalcy, betting that the worst of the crisis may be in the rearview. Massive amounts of stimulus from Congress and the Fed have helped support asset prices, but the surge in coronavirus cases late in the quarter threatened prospects for a swift return to growth.
European equities trailed broader developed markets stocks in second quarter as Europe ex UK bested UK shares; however, Europe outperformed in June as the decline in new COVID-19 cases boosted the recovery outlook relative to the United States. Retail sales, consumer confidence, and industrial outlook all sharply declined before showing signs of improvement in June as lockdowns eased. Business activity data declined to lower levels than in other major regions but rebounded to only mildly contractionary. The unemployment rate ticked up to 7.4% but did not increase at the same magnitude as the United States, largely due to structural differences in the two economies. Euro area first quarter GDP declined 3.6% quarter-over-quarter, which translates to a contraction of almost 14% on an annualized basis—the most severe since records begin in 1995. The euro area’s three largest economies—Germany, France, and Italy—all entered technical recessions (defined as two consecutive quarters of GDP declines). Data were similarly weak in the United Kingdom, with first quarter GDP contracting 2.2%.
New coronavirus infections have been largely contained in Europe, allowing economies to take steps toward reopening. The EU formally announced plans to open its borders to visitors from 15 countries that have largely contained the virus. The European Commission proposed establishing a recovery fund to help support member countries hit hardest by coronavirus, backed by Germany and France, but hurdles remain high as all 27 member states must agree and four have already voiced opposition against the proposal. In the United Kingdom, the most recent round of Brexit trade negotiations ended in deadlock, raising the risk of a no-deal, hard Brexit outcome as UK leadership recommitted to not extending the deadline past year-end 2020.
Japanese equities trailed other major developed markets, despite the country reopening well in advance of many other countries. Prime Minister Shinzo Abe announced the decision to lift the country’s state of emergency in May. Japanese GDP beat expectations but contracted at a 2.2% annualized pace in calendar first quarter, entering a technical recession. Consumer spending, industrial production, and foreign trade declined sharply; however, unemployment rose just 0.5 percentage points to 2.9%. The Cabinet of Japan approved multiple rounds of fiscal stimulus totaling more than 40% of GDP. Late in the quarter Bank of Japan (BOJ) Governor Haruhiko Kuroda announced he expects the BOJ to keep interest rates negative until at least fiscal year 2023.
Emerging markets equities trailed developed peers despite a weakening US dollar. In major currency terms, Latin America and emerging Europe, the Middle East & Africa outgained the broader index, while emerging Asia lagged. Among major emerging markets, Brazil, South Africa, India, Taiwan, and Korea outperformed, while China lagged. Escalating US-China tensions weighed on sentiment in the second half of the quarter as the Trump administration sought to act against China for perceived mishandling of the COVID-19 outbreak, raising doubts about the future of the recently passed Phase One trade deal. Further adding to tensions, the United States took steps to limit Chinese companies’ ability to list on US exchanges. China unilaterally passed a contentious new National Security Law for Hong Kong, prompting the United States to introduce legislation that would penalize individuals and businesses that help China restrict Hong Kong’s autonomy.
Chinese data were mixed; industrial production increased, trade data exceeded expectations, and business activity rebounded to expansionary territory, but retail sales slumped and first quarter GDP (-6.8% year-over-year) declined further than expected—its first official economic contraction since 1976. The People’s Bank of China cut policy rates and reserve requirements, while Chinese officials abandoned full-year GDP growth targets. Elsewhere, COVID-19 cases spiked in Brazil, Russia, and India, though associated equity markets outperformed for the quarter in major currency terms. Argentina defaulted on its debt for the ninth time after failing to reach a restructuring deal with bondholders but was the top-performing equity market of any size on optimism of an international bailout led by the IMF. Within frontier markets, Vietnam was a top performer due in part to speculation the country could benefit from rising US-China tensions.
SECOND QUARTER EQUITY INDEX PERFORMANCE (%)
Sources: MSCI Inc. and Thomson Reuters Datastream. MSCI data provided “as is” without any express or implied warranties.
Fixed Income
Credits rallied in second quarter as credit spreads narrowed amid investors’ search for yield. US corporates outperformed despite mounting financial stress and record issuance as the Fed officially began corporate bond ETF—and later individual corporate bond—purchases. US Treasuries modestly advanced; ten-year and five-year yields fell 4 and 8 bps to 0.66% and 0.29%, respectively. Two- and five-year Treasury yields touched all-time lows during the quarter as the US Treasury said it expected borrowing of $3 trillion in second quarter—more than five times the prior quarterly high—and the Fed announced it expects to keep its benchmark interest rate near zero through at least 2022. The ten-year/two-year yield spread widened slightly to 50 bps. TIPS outperformed nominal Treasuries, pushing real yields further into negative territory and lifting ten-year breakeven inflation rates 84 bps above their March low. Tax-exempt municipal bonds rebounded from steep declines early in the quarter but lagged most other fixed income sectors.
Relative performance for sterling-denominated bonds mirrored their US counterparts. The Bank of England’s consideration of negative policy rates sent gilt yields hit new all-time lows, with five-year maturities falling into negative territory for the first time; ten- and five-year gilt yields declined 17 and 23 bps to 0.19% and -0.06%, respectively. UK linkers outgained nominal gilts. German ten-year bund yields remained unchanged.

SECOND QUARTER BOND INDEX PERFORMANCE (%)
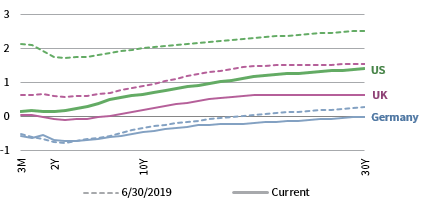
SECOND QUARTER NOMINAL YIELD CURVES

10Y/2Y YIELD CURVE SPLIT
* High-yield index yield data represent option-adjusted spread.
Sources: Bank of England, Bloomberg Index Services Limited, BofA Merrill Lynch, Federal Reserve, FTSE Fixed Income LLC, FTSE International Limited, Intercontinental Exchange, Inc., and Thomson Reuters Datastream.
Real Assets
Commodity futures mostly advanced, driven by industrial and precious metals and energy.
Oil prices ($41.15 for Brent and $39.27 for WTI) nearly doubled but swung wildly early in the quarter as the May WTI futures contract expired with virtually nowhere to store physical oil. The disappearance of storage capacity, resulting from the global supply glut and weak demand stemming from COVID-19 lockdowns, briefly pushed WTI prices into negative territory for the first time in history. OPEC+ production cuts, declining US supply, and increased global demand from easing lockdown restrictions later in the quarter supported a more balanced market, propelling prices back to early March levels.
Global natural resources equities gained, supported by stronger underlying commodity prices. MLP prices saw a sharp rebound, but remain one of the worst-performing asset classes over the past 12 months.
Global developed REITs advanced, led by US REITs; Asia REITs, Europe ex UK, UK REITs also gained but underperformed the broader market.
Gold prices ($1,783.66 per troy ounce) advanced for the quarter, reaching the highest level in almost eight years. Investors continued to seek safety in the yellow metal amid ongoing economic uncertainty and fears of inflation spurred by accommodative policy measures.
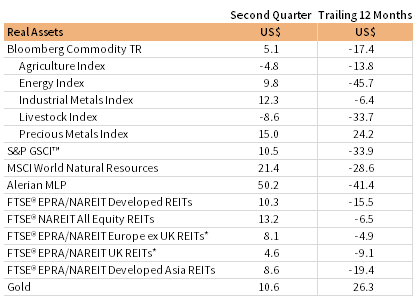
SECOND QUARTER REAL ASSETS PERFORMANCE (%)
* Europe ex UK REITs are in EUR terms and UK REITs in GBP terms.
Sources: Alerian, Bloomberg L.P., EPRA, FTSE International Limited, Intercontinental Exchange, Inc., MSCI Inc., National Association of Real Estate Investment Trusts, Standard & Poor’s, and Thomson Reuters Datastream. MSCI data provided “as is” without any express or implied warranties.
Notes: Total return data for all MSCI indexes are net of dividend taxes. Gold performance based on spot price return.
USD-Based Investors
Risk assets gained across the board in second quarter, led by equities and real assets as many countries began lifting COVID-19 lockdown restrictions and investors turned optimistic about an economic rebound.
US small caps outperformed domestic large caps, while emerging markets equities lagged despite a weakening US dollar. High-yield and investment-grade corporate bonds outperformed Treasuries as the Fed officially began purchasing corporate bond ETFs (and later in the quarter, individual corporate bonds), supporting borrowing conditions and leading to record issuance. US REITs, gold, and commodity prices climbed amid continued macro uncertainty, a declining US dollar, and a recovery in oil prices.
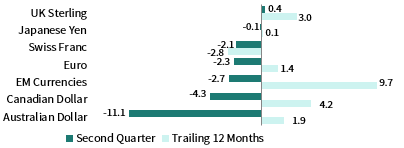
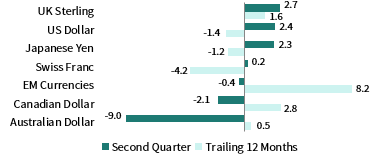
The US dollar generally depreciated but gained moderately versus UK sterling; the greenback fell the most versus commodity-sensitive currencies, including the Australian and Canadian dollars and an equal-weighted basket of emerging markets currencies. Despite recent weakness, the US dollar has mostly appreciated over the past year, declining only vis-à-vis the safe-haven Swiss franc.
The United States officially entered a recession in February, ending the longest expansion on record. A surge in new coronavirus cases sparked investor unease near the end of the quarter, stalling equity momentum through much of June.

INDEX PERFORMANCE (US$)
US DOLLAR PERFORMANCE VS VARIOUS CURRENCIES
Sources: Bloomberg Index Services Limited, FTSE International Limited, Frank Russell Company, Intercontinental Exchange, Inc., J.P. Morgan Securities, Inc., MSCI Inc., National Association of Real Estate Investment Trusts, Standard & Poor’s, and Thomson Reuters Datastream. MSCI data provided “as is” without any express or implied warranties.
EUR-Based Investors
Risk assets gained across the board in second quarter, led by equities, high-yield bonds, and real assets as many countries began lifting COVID-19 lockdown restrictions and investors turned optimistic about an economic rebound. EU countries had largely controlled the spread of COVID-19, prompting the bloc to prepare to reopen its borders to certain countries, excluding the United States and other countries that have failed to control outbreaks of the virus. The European Commission proposed establishing a recovery fund to help support member countries hit hardest by coronavirus, backed by Germany and France, but hurdles remain high as all 27 member states must agree and four have already voiced opposition against the proposal.
European small caps outperformed large-cap equivalents, while emerging markets equities lagged. High-yield and investment-grade corporate bonds outperformed EMU government bonds despite mounting financial stress. Gold, Europe ex UK REITs, and commodity prices climbed amid continued macro uncertainty and a recovery in oil prices.
The euro was mixed in second quarter, appreciating the most versus UK sterling, US dollar, and the Japanese yen; commodity-sensitive currencies held up better vis-à-vis the common currency as the euro fell the most against the Australian and Canadian dollars. Euro performance was over the opposite over past 12 months, gaining the most against commodity-sensitive currencies, but declining versus the safe-haven Swiss franc, US dollar, and Japanese yen.

INDEX PERFORMANCE (€)
EURO PERFROMANCE VS VARIOUS CURRENCIES
Sources: Bloomberg Index Services Limited, EPRA, European Banking Federation, FTSE Fixed Income LLC, FTSE International Limited, ICE Benchmark Administration Ltd., J.P. Morgan Securities, Inc., MSCI Inc., National Association of Real Estate Investment Trusts, Standard & Poor’s, and Thomson Reuters Datastream.
GBP-Based Investors
Risk assets gained across the board in second quarter, led by equities and real assets as many countries began lifting COVID-19 lockdown restrictions and investors turned optimistic about an economic rebound.
UK equities underperformed ex UK developed equivalents, while emerging markets equities lagged. High-yield and investment-grade corporate bonds outperformed gilts as credit market conditions improved and the BOE boosted its bond-buying program in June. Gold and commodity prices climbed amid continued macro uncertainty and a recovery in oil prices.
UK sterling declined in May as hard-Brexit risks re-emerged and the BOE signaled the potential for negative policy rates. UK sterling fell the most versus commodity-sensitive currencies, including the Australian and Canadian dollars and an equal-weighted basket of emerging markets currencies, faring better against safe-haven US dollar and Japanese yen. UK sterling performance was flipped over the past 12 months, weakening the most against safe havens but gaining against commodity-sensitive Canadian dollar and emerging markets currencies.
UK and EU negotiators failed to make progress on the future trading relationship, raising the odds of a hard Brexit outcome.

INDEX PERFORMANCE (£)

SECOND QUARTER MAJOR ASSET CLASS PERFORMANCE (%)
Sources: Bloomberg Index Services Limited, EPRA, FTSE International Limited, Intercontinental Exchange, Inc., ICE Benchmark Administration Ltd., J.P. Morgan Securities, Inc., MSCI Inc., National Association of Real Estate Investment Trusts, Standard & Poor’s, and Thomson Reuters Datastream.
Performance Exhibits
All data are total returns unless otherwise noted. Total return data for all MSCI indexes are net of dividend taxes.
USD-Based Investors index performance chart includes performance for the Bloomberg Barclays US Aggregate Bond, Bloomberg Barclays US Corporate Investment Grade, Bloomberg Barclays US High Yield Bond, Bloomberg Barclays Municipal Bond, Bloomberg Barclays US TIPS, Bloomberg Barclays US Treasuries, ICE BofAML 91-Day Treasury Bills, FTSE® NAREIT All Equity REITs, J.P. Morgan GBI-EM Global Diversified, LBMA Gold Price, MSCI Emerging Markets, MSCI World, Russell 2000®, S&P 500, and S&P GSCI™ indexes.
EUR-Based Investors index performance chart includes performance for the Bloomberg Barclays Euro-Aggregate: Corporate, Bloomberg Barclays Pan-Euro High Yield (Euro), EURIBOR 3M, FTSE EMU Govt Bonds, FTSE Euro Broad Investment-Grade Bonds, FTSE® EPRA/NAREIT Europe ex UK RE, J.P. Morgan GBI-EM Global Diversified, LBMA Gold Price AM, MSCI Emerging Markets, MSCI Europe, MSCI Europe ex UK, MSCI Europe Small-Cap, MSCI World ex EMU, MSCI World, and S&P GSCI™ indexes.
GBP-Based Investors index performance chart includes performance for the Bloomberg Barclays Sterling Aggregate: Corporate Bond, Bloomberg Barclays Sterling Index-Linked Gilts, ICE BofAML Sterling High Yield, FTSE® 250, FTSE® All-Share, FTSE® British Government All Stocks, FTSE® EPRA/NAREIT UK RE, J.P. Morgan GBI-EM Global Diversified, LBMA Gold Price AM, LIBOR 3M GBP, MSCI Emerging Markets, MSCI Europe ex UK, MSCI World, MSCI World ex UK, and S&P GSCI™ indexes.
EM currencies is an equal-weighted basket of 20 emerging markets currencies.
Fixed Income Performance Table
Performance data for US TIPS reflect the Bloomberg Barclays US TIPS Index, with yields represented by the Bloomberg Barclays Global Inflation Linked Bond Index: US.