Capital markets performance during second quarter was generally positive, consistent with broad-based economic growth and mostly healthy corporate fundamentals, but negative geopolitical developments generated some weakness in certain market segments. Global equities gained, recovering all of their first quarter losses, though a rebound in developed markets stocks stood in contrast to losses for emerging markets equivalents, the first time since 2016 that developed markets outperformed emerging markets. Global growth stocks outperformed value counterparts for the sixth consecutive quarter, and small caps outpaced large caps, the latter driven entirely by a US small-cap rally. Global government bonds experienced mixed results as losses suffered by European peripheral debt and emerging markets sovereigns erased small gains across the broader markets and yield curves in major economies continued to flatten. Rising energy prices contributed to strong real assets performance, and developed REITs rebounded from losses suffered earlier in the year. Among currencies, the US dollar enjoyed broad strength, while the euro and UK sterling declined against most major currencies we track.
Last year’s supportive market narrative of synchronizing global growth and waning political risks that helped drive strong gains and muted volatility has transitioned to a more uncertain backdrop and more typical volatility regime in 2018. Rising international trade tensions, growing political populism, and diverging economic policies have been overshadowing still healthy macroeconomic and corporate fundamentals. Regarding trade, thus far the uncertainty about where negotiations could lead has dampened market sentiment more than the perceived impact of protectionist measures taken to date. Still, last quarter saw the United States further escalate tensions with its major trading partners, particularly with China as the two countries exchanged further tit-for-tat tariff announcements. On the political front, anti-establishment parties recently took power in Italy, and there are concerns about resurging populism in Latin America as leftist candidates recently won presidential races in Colombia and Mexico, and with Brazil holding important national elections later this year. Finally, global macroeconomic sentiment was hurt by signs of the inevitable cyclical slowdowns in three of the four major economies—Eurozone, Japan, and China—after a period of strong above-trend growth, as well as by one-off crises in Argentina and Turkey that made for negative headlines, despite being idiosyncratic cases involving smaller markets. Together, these developments, along with the combination of ongoing monetary tightening and late cycle fiscal stimulus in the United States, contributed to a resurgent US dollar and an emerging markets sell-off last quarter, with USD-denominated assets leading overall market performance last quarter.
US equities (3.4% for the S&P 500 Index) advanced as continued strength in underlying fundamentals outshined headline-grabbing trade fears and geopolitical tensions. Possibly as a result of lower perceived exposure to a potential trade war, US small caps outperformed large caps after underperforming last calendar year. US stocks led other developed and emerging markets counterparts, topping returns over the trailing 12 months. Seven of 11 S&P 500 sectors were in the black for the quarter, led higher by energy, consumer discretionary, and information technology; in contrast, industrials and financials declined the most. First quarter earnings exceeded expectations and full-year 2018 earnings growth estimates are well in the double digits. Underlying economic data were also mostly positive as retail sales grew more than expected, the Federal Reserve’s preferred core inflation metric reached its 2.0% target for the first time in six years, and unemployment ticked down to tie its lowest level since 1969. The Fed raised its benchmark lending rate a quarter of a percentage point in June, as expected, and signaled it would tolerate inflation above target “for some time” noting the “overall outlook for growth remains favorable.” One risk highlighted in the Fed’s statement is the potential for a full-blown trade war arising from the Trump administration’s import tariffs announced in second quarter and resulting tit-for-tat duties by other markets in response, including close allies Canada and the European Union.
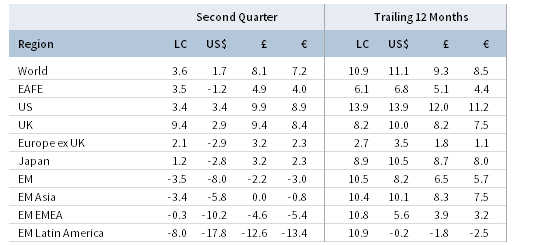
TOTAL RETURN FOR MSCI INDEXES (%)
European equities (-0.9% in USD, 4.4% in EUR, and 5.3% in GBP) underperformed developed markets peers amid increasing political uncertainty and weakening macroeconomic data across the Continent. UK stocks (9.4%) bested EMU (2.4%) and Europe ex UK (2.1%) equivalents. In Italy, the anti-establishment Five Star Movement and far-right League formed a governing coalition after initially getting blocked over a controversial anti-euro finance minister; in Spain, the now former Prime Minister Mariano Rajoy was ousted in a no-confidence vote led by Basque nationalists and Catalan separatists over a corruption scandal; and, in Germany, disagreement over migration policy threatened the decades-old political alliance between Chancellor Angela Merkel’s Christian Democrats and the state of Bavaria’s Christian Social Union. Despite this internal turmoil, a united EU announced retaliatory tariffs against targeted industries in the United States that are scheduled to go into effect in July. Underlying Eurozone economic data were mixed as consumer confidence turned negative for the first time since late last year, but first quarter GDP and May retail sales grew as expected, and flash estimates indicated June inflation increased above the European Central Bank’s (ECB) target for the first time in over a year. The ECB kept target interest rates steady at 0.0% at its mid-June meeting and indicated its massive bond-buying program would likely be wound down by the end of the year if data continue to meet forecasts. In the United Kingdom, inflation beat the Bank of England’s (BOE’s) target, estimated first quarter GDP matched expectations, and retail sales grew more than expected, marking an improvement in underlying trends. Early in May, the BOE decided against raising interest rates after Governor Mark Carney (in April) suggested future rate hikes are not a foregone conclusion.
Japanese equities (-2.8% in USD, 2.3% in EUR, and 3.2% in GBP) underperformed developed markets peers, hurt by yen weakness against the US dollar. Corporate earnings in calendar first quarter 2018 grew at double digits, but GDP declined for the first time in two years as macroeconomic data continued to deteriorate—real wages, consumer confidence, and retail sales disappointed, while inflation fell further below the Bank of Japan’s (BOJ) target rate. BOJ policy remained largely unchanged as Governor Haruhiko Kuroda announced in April that the gradual normalization of monetary conditions will be considered once the 2% inflation target is reached “sometime within the next five years.” The more open-ended timeframe abandons long-standing language providing a specific estimated timetable. Domestic political risk waned in the second half of the quarter as prosecutors declined to indict officials in a public land sale scandal that had threatened Prime Minister Shinzo Abe’s administration, and an internal finance ministry investigation failed to implicate Abe directly. Trade risks rose as the United States announced possible tariffs on imported automobiles, many of which come from Japan.
Emerging markets equities (-8.0% in USD, -3.0% in EUR, and -2.2% in GBP) underperformed developed markets counterparts, reversing a trend since the beginning of 2017. Among the major regions, heavily weighted emerging Asia outperformed in major currency terms, while emerging Europe, the Middle East & Africa lagged and Latin America fell sharply. Columbia and Qatar were the only countries with positive returns in US dollar terms; meanwhile laggards Brazil and Turkey both declined more than 25%, pulled down by economic tumult. In Brazil, widespread strikes in the trucking and oil industries threatened to bring the economy to a halt; in Turkey, sticky inflation led to significant lira depreciation and a substantial emergency interest rate hike, but did not deter voters from re-electing President Recep Tayyip Erdogan in June with recently expanded presidential powers. Among major emerging economies India, China, and Mexico outperformed the most in USD terms, with Mexico gaining almost 10% in June and paring earlier losses as polls suggested left-wing candidate Andres Manuel Lopez Obrador would win the July 1 presidential election, which subsequently transpired. With respect to China, as announced last year, domestically listed Chinese A-shares were included in the major MSCI equity indexes for the first time on June 1, boosting China’s weight to roughly one-third of the flagship MSCI Emerging Markets (EM) Index—more than twice that of the next largest country, Korea. MSCI also announced in June that Argentina and Saudi Arabia will be added to the EM Index mid-2019, with the former being promoted from the MSCI Frontier Markets Index. Frontier markets (-15.2% in USD, -10.7% in EUR, and -9.9% in GBP) lagged developed and emerging markets counterparts, dragged down by a steep decline in Argentina (-41.9% in USD) as the Argentine peso fell 30.2% against the USD in second quarter, threatening a currency crisis, with the International Monetary Fund announcing an emergency aid package in June.
Real assets mostly gained in second quarter, supported by rising energy prices. Commodity futures advanced (0.4% for the Bloomberg Commodity TR Index and 8.0% for the energy-heavy S&P GSCI™ Index), largely driven by surging energy prices and, notably, in spite of broad USD strength. Crude oil prices (ending at $79.44 for Brent and $74.15 for WTI) finished the quarter at their highest levels since fourth quarter 2014. Brent prices touched above $80 per barrel mid-quarter for the first time in nearly four years on threats to global supply from both Venezuela’s worsening economic crisis and renewed US economic sanctions against Iran, but finished below that mark as Saudi Arabia and Russia announced a deal to boost production that was short on specifics. Energy MLPs (11.8%) and natural resources equities (10.7% for the MSCI World Natural Resources Index in USD terms) and benefitted from the crude rally and were the top-performing asset classes for the quarter. Developed markets REITs (5.5% in USD terms) rebounded further, beating global equities and bonds; US REITs (8.5%) outperformed Europe ex UK REITs (6.2%) and UK REITs (5.0%). Gold (-5.5%) declined in USD terms to $1,251.13/troy ounce in response to dollar strength and is now down 4.0% year-to-date.
US Treasuries (0.1%) were barely positive after rising geopolitical risks drove a recovery from steep losses suffered earlier in the quarter. EMU government bonds (-0.9%) declined as losses for peripheral Eurozone bonds due to heightened political uncertainty, particularly in Italy, outweighed gains for core EMU sovereigns, led by German bunds. After initially steepening, yield curves reversed course, flattening across major developed economies as long-term rates declined amid safe haven demand, while short-term rates rose. The ten-year US Treasury yield backed up as high as 3.11% mid-quarter—its highest level since July 2011—but gave back most of its rise to finish the quarter up 11 basis points (bps) at 2.85%; five-year yields gained 17 bps to end at 2.73%. The benchmark ten-year versus two-year yield spread fell to 33 bps, its lowest level since mid-2007. Five- and ten-year UK gilt yields declined 6 bps and 3 bps to end the quarter at 0.97% and 1.39%, respectively. US credit spreads widened, though US high-yield bonds (1.0%) managed slight gains and continued to outpace US investment-grade corporate bonds (-1.0%). US tax-exempt bonds (0.9%) edged taxable equivalents and remain up over the past year. US TIPS (0.8%) outgained nominal counterparts; in contrast, UK linkers (-1.0%) underperformed nominal gilts (0.2%).
Among major currencies, the US dollar was near universally stronger in second quarter, while the euro and UK sterling were broadly weaker. The greenback sharply appreciated against virtually all developed and emerging markets currencies we track, gaining the most against an equal-weighted basket of EM currencies, UK sterling, and the euro; however, over the past 12 months the US dollar still weakened against the euro, UK sterling, and Japanese yen. The euro depreciated against the US dollar, Canadian dollar, Swiss franc, Australian dollar, and Japanese yen, but the common currency strengthened vis-à-vis UK sterling and remained stronger over the last 12 months against the major developed markets currencies we track, as well as versus our EM basket. UK sterling declined against all major DM counterparts last quarter but advanced relative to our EM currency basket and remains up over the trailing 12 months against a majority of global currencies.
Market Exhibits
Rising risk of a global trade war pressured consensus 2018 GDP growth forecasts for the EMU, United Kingdom, Japan, and EM ex China lower in recent months. By contrast, economists continued to upgrade their growth outlook for the US economy, which is benefitting from the 2017 tax reform.
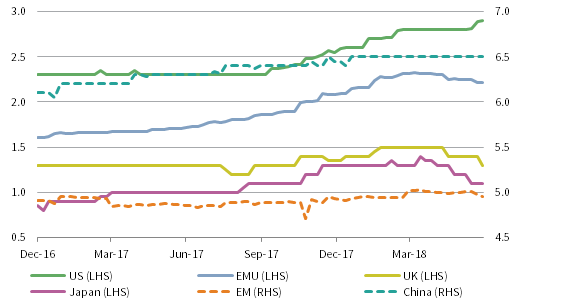
CHANGES IN CONSENSUS 2018 REAL GDP GROWTH FORECASTS
December 31, 2016 – June 30, 2018 • Percent (%)
Source: Bloomberg L.P.
Note: GDP data are the weekly median of consensus growth forecasts.
The US Federal Reserve’s June rate hike increased short-term US Treasury supply, and steady demand for longer-term Treasuries led the benchmark ten-year versus two-year yield spread to finish second quarter at 33 bps, its lowest level since mid-2007, just prior to the last recession.
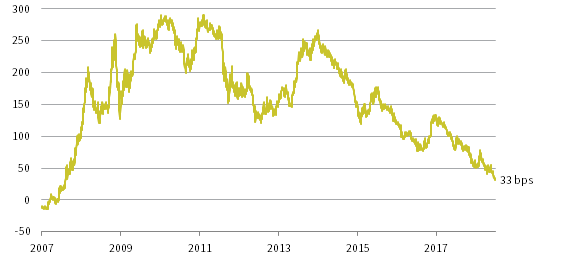
10-YR/2-YR TREASURY YIELD SPREAD
January 1, 2007 – June 30, 2018 • Basis Points (bps)
Sources: Bloomberg L.P., Federal Reserve, and Thomson Reuters Datastream.
Notes: The Fed Funds Future Curve as of December 31, 2017, ends in November 2020, three years after its start date. Yield spread data are daily.
Global earnings per share (EPS) growth for 2017 exceeded prior consensus analyst estimates for the first time since 2010. Analysts have similarly upgraded 2018 EPS growth expectations across most regions, but growing geopolitical and trade tensions are a risk to the global earnings outlook.
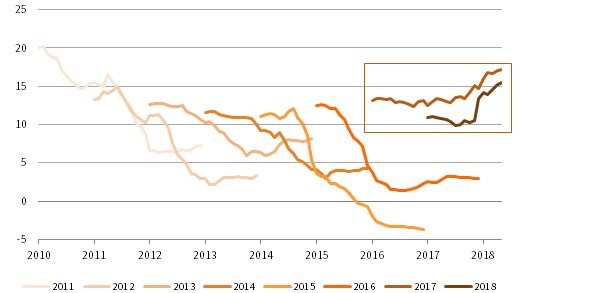
MSCI ACWI EPS GROWTH ESTIMATES OVER TIME BY FISCAL YEAR
February 28, 2010 – June 30, 2018 • Percent (%)
Sources: I/B/E/S, MSCI Inc., and Thomson Reuters Datastream. MSCI data provided “as is” without any express or implied warranties.
Note: Data are monthly.
Global merger and acquisition activity is on pace to reach its highest calendar year level since 2007—and in the United States, the highest ever. In June a US federal judge approved a blockbuster merger between AT&T and Time Warner, potentially setting up an easier path for future mega-mergers.
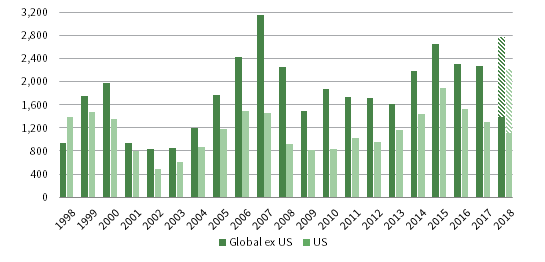
AGGREGATE DISCLOSED M&A DEAL VOLUME: GLOBAL EX US VS US
1998–2018 • USD (billions)
Source: Dealogic.
Notes: Announcements are based on deal acquirer nationality. Dealogic updates its database on a regular basis; therefore, historical data may change. Data for 2018 are as of June 30. Shaded bars represent annualized estimates through the end of 2018.
Currency Performance as of June 30, 2018
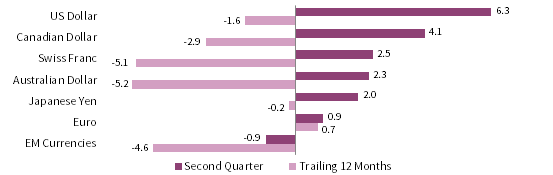
The US dollar appreciated in second quarter against all developed and emerging currencies we track, gaining the most against an equal-weighted basket of EM currencies, UK sterling, and the euro; however, over the past 12 months the dollar declined versus the euro, UK sterling, and yen.
VERSUS THE US DOLLAR
Total Return (%)
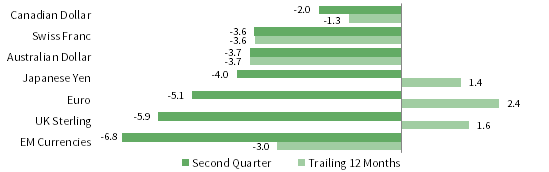
The euro was mixed last quarter, depreciating against the US dollar, Canadian dollar, Swiss franc, AU dollar, and Japanese yen amid heightened political risks in Italy; it appreciated relative to UK sterling and our EM currency basket. Despite recent weakness, the common currency enjoyed broad strength over the past year.

VERSUS THE EURO
Total Return (%)
UK sterling declined against all major developed markets counterparts in second quarter (as BOE Governor Carney suggested further rate hikes are not a foregone conclusion), but gained versus our EM currency basket and remains up over the past 12 months against all but the euro.
VERSUS THE POUND STERLING
Total Return (%)
Note: EM currencies is an equal-weighted basket of 20 currencies.
USD Market Performance as of June 30, 2018
Real assets outperformed in second quarter with US REITs and commodities the top performers. US equities outpaced other DM equities, led by US small caps. US high-yield bonds and US Treasuries advanced, but US investment-grade corporates declined. EM assets sold off, hurt in part by dollar strength and trade concerns.
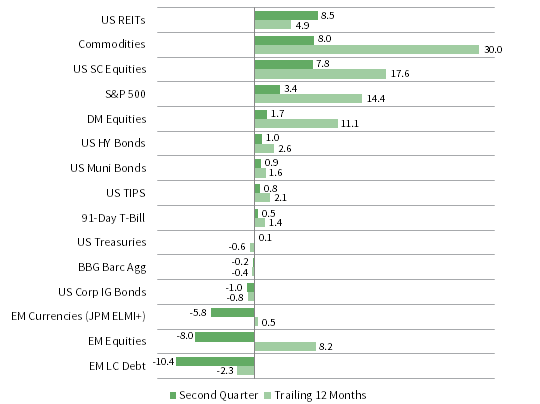
INDEX PERFORMANCE (US$)
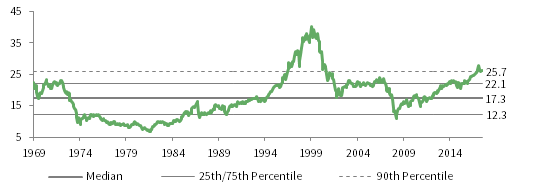
COMPOSITE NORMALIZED P/E: MSCI US
December 31, 1969 – June 30, 2018
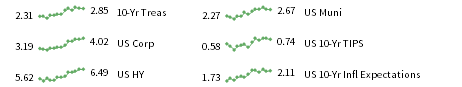
FIXED INCOME YIELDS
June 2017 – June 2018
Sources: Barclays, Bloomberg L.P., BofA Merill Lynch, FTSE International Limited, Frank Russell Company, J.P. Morgan Securities, Inc., MSCI Inc., National Association of Real Estate Investment Trusts, Standard & Poor’s, and Thomson Reuters Datastream. MSCI data provided “as is” without any express or implied warranties.
Euro Market Performance as of June 30, 2018
Real assets and DM equities rallied in second quarter as commodities, developed ex EMU stocks, and Europe ex UK REITs led gains. European small caps advanced more than large caps, while European bonds declined amid political turmoil across the Continent. EM assets fell the most, hit by global trade fears.
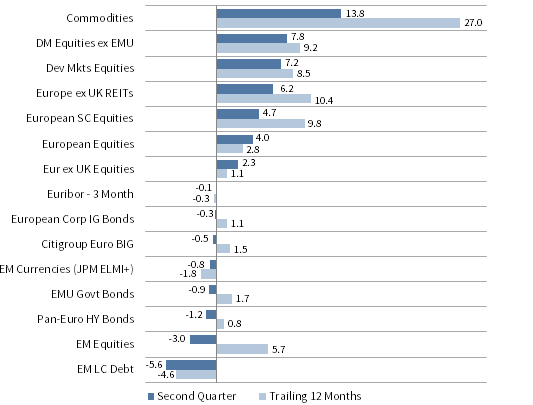
INDEX PERFORMANCE (€)

COMPOSITE NORMALIZED P/E: MSCI EUROPE EX UK
December 31, 1969 – June 30, 2018

FIXED INCOME YIELDS
June 2017 – June 2018
Sources: Barclays, Bloomberg L.P., Citigroup Global Markets, EPRA, FTSE International Limited, J.P. Morgan Securities, Inc., MSCI Inc., National Association of Real Estate Investment Trusts, Standard & Poor’s, and Thomson Reuters Datastream. MSCI data provided “as is” without any express or implied warranties.
GBP Market Performance as of June 30, 2018
Commodities and DM equities led gains in second quarter. Large-cap UK stocks bested DM ex UK peers and domestic bonds, which experienced mixed results as UK high-yield bonds and gilts eked out gains and UK investment-grade corporates and linkers retreated. EM assets lost the most amid a global flight to safety.
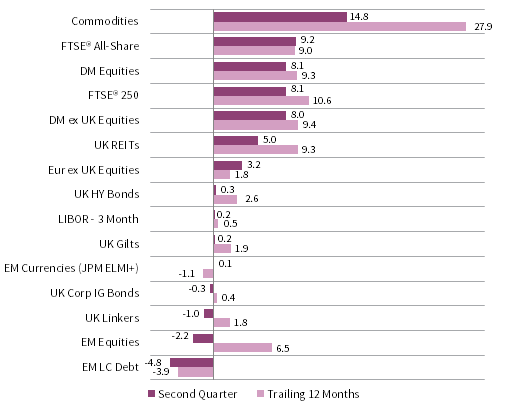
INDEX PERFORMANCE (₤)
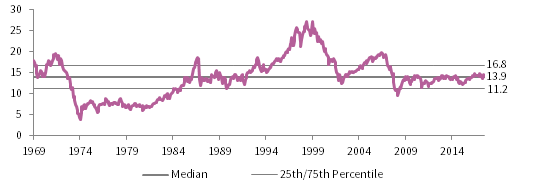
COMPOSITE NORMALIZED P/E: MSCI UK
December 31, 1969 – June 30, 2018
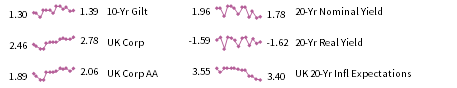
FIXED INCOME YIELDS
June 2017 – June 2018
Sources: Barclays, Bloomberg L.P., BofA Merill Lynch, EPRA, FTSE International Limited, J.P. Morgan Securities, Inc., MSCI Inc., National Association of Real Estate Investment Trusts, Standard & Poor’s, and Thomson Reuters Datastream. MSCI data provided “as is” without any express or implied warranties.
Exhibit Notes
Performance Exhibits
Total return data for all MSCI indexes are net of dividend taxes.
US dollar index performance chart includes performance for the Bloomberg Barclays Aggregate Bond, Bloomberg Barclays Corporate Investment Grade, Bloomberg Barclays High-Yield Bond, Bloomberg Barclays Municipal Bond, Bloomberg Barclays US TIPS, Bloomberg Barclays US Treasuries, BofA Merrill Lynch 91-Day Treasury Bills, FTSE® NAREIT All Equity REITs, J.P. Morgan ELMI+, J.P. Morgan GBI-EM Global Diversified, MSCI Emerging Markets, MSCI World, Russell 2000®, S&P 500, and S&P GSCI™ indexes.
Euro index performance chart includes performance for the Bloomberg Barclays Euro-Aggregate: Corporate, Bloomberg Barclays Pan-Euro High Yield, Citigroup EMU Govt Bonds, Citigroup Euro Broad Investment-Grade Bonds, Euribor 3-month, FTSE® EPRA/NAREIT Europe ex UK, J.P. Morgan ELMI+, J.P. Morgan GBI-EM Global Diversified, MSCI Emerging Markets, MSCI Europe, MSCI Europe ex UK, MSCI Europe Small-Cap, MSCI World ex EMU, MSCI World, and S&P GSCI™ indexes.
UK sterling index performance chart includes performance for the Bloomberg Barclays Sterling Aggregate: Corporate Bond, BofA Merrill Lynch Sterling High Yield, FTSE® 250, FTSE® All-Share, FTSE® British Government All Stocks, FTSE® British Government Index-Linked All Stocks, FTSE® EPRA/NAREIT UK RE, J.P. Morgan ELMI+, J.P. Morgan GBI-EM Global Diversified, LIBOR 3M GBP, MSCI Emerging Markets, MSCI Europe ex UK, MSCI World, MSCI World ex UK, and S&P GSCI™ indexes.
Valuation Exhibits
The composite normalized P/E ratio is calculated by dividing the inflation-adjusted index price by the simple average of three normalized earnings metrics: ten-year average real earnings (i.e., Shiller earnings), trend-line earnings, and return on equity–adjusted earnings. We have removed the bubble years 1998–2000 from our mean and standard deviation calculations. All data are monthly.
Fixed Income Yields
US fixed income yields reflect Bloomberg Barclays Municipal Bond Index, Bloomberg Barclays US Corporate High Yield Bond Index, Bloomberg Barclays US Corporate Investment-Grade Bond Index, and the ten-year Treasury.
European fixed income yields reflect the BofA Merrill Lynch Euro Corporate AA Bond Index, BofA Merrill Lynch Euro Corporate Bond Index, Bloomberg Barclays Pan-European Aggregate High Yield Bond Index, Bloomberg Twenty-Year European Government Bond Index (nominal), ten-year German bund, 20-year European Inflation Swaps (inflation expectations), and the real yield calculated as the difference between the inflation expectation and nominal yield.
UK sterling fixed income yields reflect the BofA Merrill Lynch Sterling Corporate AA Bond Index, BofA Merrill Lynch Sterling Corporate Bond Index, UK ten-year gilts, Bank of England 20-year nominal yields, and Bloomberg Generic UK 20-year inflation-linked (real) yields. Current UK 20-yr nominal yield data are as of June 29, 2018.