Second quarter saw a continuation of many first quarter themes. Global equities rallied further, led by emerging markets, while US stocks underperformed developed counterparts in USD terms despite hitting all-time highs. Underperformers in 2016 continued to outperform in 2017 as global growth stocks topped value shares and large caps bested small caps. Fixed income returns were muted and yield curves flattened. Real asset performance was mostly negative as oil prices touched their lowest levels in almost a year, taking energy-related assets along for the ride. The US dollar continued its slide, reaching a new 2017 low, and the euro and UK sterling strengthened.
The first half of the year was characterized by a supportive environment for risk assets, particularly equities. A moderate, but gradually improving, global economic growth outlook contrasted in second quarter with a drop in inflation and declining inflation expectations, partly as a result of the renewed fall in some commodity prices. Some have called this a “Goldilocks” scenario for markets, as major central banks have largely maintained accommodative policy stances despite the growth pickup. However, some crosscurrents appeared to emerge as the quarter ended—investors interpreted late June public comments by central bankers in Canada, the Eurozone, and the United Kingdom as more hawkish than expected and as potentially signaling reductions in stimulus starting later this year. The result was a jump in global bond yields, a further rally in some currencies versus the US dollar, and some equity market weakness amid strong sector and factor rotations as the quarter closed out.
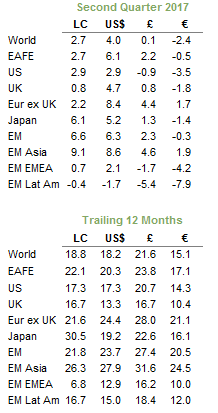
Total Return for MSCI Indexes (%)
US equities (3.1% for the S&P 500) benefitted from the strongest reported earnings growth in over five years—14% year-over-year in first quarter, above market expectations and representing the third consecutive quarter of positive earnings growth. Implied volatility remained near record lows, trailing only fourth quarter 2006. The S&P 500 recorded another all-time high as the market shrugged off the (widely expected) 25 basis point increase in the Federal Funds rate announced in June. Growth (4.7%) outperformed value (1.3%), and large caps (3.1%) outperformed small caps (2.5%)—in both cases for the second quarter in a row. The dollar’s continued decline reduced headwinds for US companies operating overseas. Health care (7.1%) and industrial (4.7%) stocks led the way among sectors. Energy was the strongest contributor to earnings growth in the first quarter, yet deteriorating sentiment resulting from the sharp drop in crude oil prices following the OPEC meeting in late May meant the sector (-6.4%) was among the worst performing, second only to telecommunications (-7.0%).
European equities (1.8%) advanced for the fifth straight quarter and are now up 20.2% in the past year. Europe ex UK (2.2%) stocks outperformed UK (1.4% for the FTSE® All-Share) and Eurozone (1.3%) equities; all gave up some gains in the final week of trading after comments by European central bankers that were perceived to be more hawkish than expected. For most of the quarter, Europe ex UK and Eurozone equities outpaced other global equity markets, reflecting several positive trends, including European companies reporting the strongest earnings growth in nearly seven years. Political risks for the Eurozone subsided following Emmanuel Macron’s win over anti-EU candidate Marine Le Pen in France’s presidential election and his new pro-EU party’s victory in parliamentary elections. Economic risks to the region have also fallen after Eurozone, Greek, and IMF officials reached a deal allowing Greece to avoid defaulting on €7 billion in debt repayments due in July and following positive steps by Italian and Spanish authorities to address their countries’ banking issues. Strong economic data also contributed to positive market sentiment, as Eurozone unemployment fell to its lowest level since 2009. In contrast, the UK outlook now appears less constructive following losses for Prime Minister Theresa May’s party in the British snap election, which weakened the UK government’s hand in “Brexit” talks, while first quarter GDP growth disappointed and inflation ticked up near a four-year high.
Japanese equities (6.1%) outperformed, with the yen largely stable against the US dollar; the previously strong negative correlation between the equity market and the currency appears to have faded somewhat in recent months. Earnings growth was significantly higher than expected in first quarter as the materials, information technology, and industrials sectors reported strong year-over-year earnings growth. Earnings growth was supported by positive top-line sales growth following several quarters of declines as domestic GDP grew for the fifth straight quarter, global growth accelerated, and the yen weakened. In June, GDP growth was revised downward to 1.0% from an initial 2.2% estimate, and Bank of Japan Governor Haruhiko Kuroda reminded market participants that “there is still a long way to go” until the decades-long near-zero inflation rate reaches the 2% target.
Emerging markets equities (6.3% in USD, 2.3% in GBP, and -0.3% in EUR) continued their outperformance of developed markets counterparts as USD weakness and falling global bond yields for most of the quarter supported positive sentiment. By region, emerging Asia outperformed for the second quarter in a row, while Latin America and emerging Europe, the Middle East & Africa lagged the broader index. Heavily weighted Chinese equities were among the best performers, driven by strong gains for the large information technology sector and despite Moody’s decision to downgrade the country’s credit rating (the first time since 1989), based on concerns about rising debt and slowing growth. In June, MSCI announced that it will include domestic China A-Shares in its Emerging Markets and All Country World indexes (with initial weights of 0.7% and 0.1%, respectively) starting in June 2018. In addition, Pakistan was upgraded from the Frontier Markets Index to the Emerging Markets Index on June 1 with an initial weight of 0.1%. Latin America took a hit from Brazil, as equities sold off following the news of President Michel Temer’s alleged bribery, for which he was formally charged in late June.
Real assets underperformed in the second quarter, with most categories suffering losses. Commodity futures declined (-3.0% for the Bloomberg Commodity TR Index and -5.5% for the energy-heavy S&P GSCI™) with losses in the energy, precious metals, and industrial metals categories. Crude oil prices ($47.92 and $46.04 for Brent and WTI, respectively) settled at their lowest month-end levels since August 2016, despite OPEC’s May 25 announcement to extend its current oil production limit for nine months. Commodity price declines also drove losses in global natural resources equities (-4.3% for the MSCI World Natural Resources Index in USD terms) and energy MLPs (-6.4%). Gold was flat (-0.3%), ending the quarter at $1,243.47/troy ounce, and has returned 7.4% year-to-date following a sharp decline in fourth quarter 2016. Global developed REITs (3.0% in USD terms) were the exception to the declines, led by strong gains in Europe ex UK REITs (6.3%); UK REITs (2.3%) and US REITs (2.3%) lagged global peers.
Global developed markets bonds (2.6%) advanced in aggregate in second quarter, with dispersion among regions and sectors. US Treasuries (1.2%) outperformed EMU government bonds (0.5%) and UK gilts (-1.3%). The US yield curve continued to flatten in the second quarter as longer-maturity US Treasury yields reached new post-election lows before gaining back some ground in the final days of the quarter, while the yields on two-year Treasuries approached post-election highs following three rate hikes by the Federal Reserve in the past six months. Five- and ten-year US Treasury yields finished at 1.89% and 2.31%, respectively, after gaining back much of the declines seen earlier in the quarter. Five- and ten-year gilt yields finished at 0.64% and 1.19%, respectively—both highs for the quarter. US tax-exempt bonds (2.0%) outperformed Treasuries. Corporate credit spreads continued to tighten as US investment-grade corporate bonds (2.5%) and US high-yield bonds (2.2%) also outperformed. Inflation-linked bonds underperformed nominal equivalents; US TIPS (-0.4%) and UK linkers (-2.3%) declined.
The trade-weighted US dollar index reached a nine-month low in June as the greenback retreated against the Australian dollar, Canadian dollar, euro, Swiss franc, UK sterling, and our basket of EM currencies. The dollar strengthened vis-à-vis the Japanese yen, which weakened against all major developed country currencies. The euro strengthened across the board as political risk waned. The common currency reached a one-year high at the end of June after remarks by Mario Draghi, European Central Bank (ECB) president, that the market interpreted as hawkish before pulling back after a clarification was released by the ECB. UK sterling strengthened versus the Australian dollar, Canadian dollar, Japanese yen, US dollar, and our basket of EM currencies—the strongest quarter for pound recovery since the Brexit vote.
Market Exhibits
Quarterly S&P 500 Implied Volatility Sorted in Ascending Order
US equity market volatility was exceptionally low for the first half of the year, with first and second quarter marking the lowest implied volatility since 1990, save fourth quarter 2006
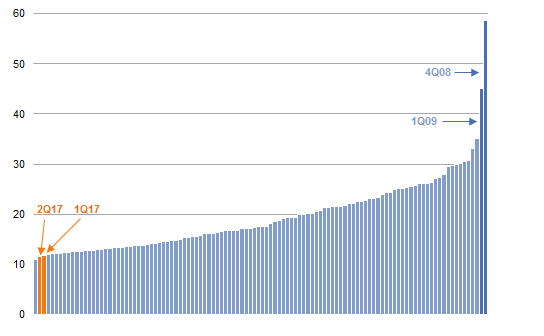
Quarterly S&P 500 Implied Volatility Sorted in Ascending Order
First Quarter 1990 – Second Quarter 2017
Sources: Bloomberg L.P., Chicago Board Options Exchange, and Standard & Poor’s.
Notes: The Chicago Board Options Exchange Volatility Index (“VIX”) reflects a market estimate of future volatility, based on the weighted average of the implied volatilites for a wide range of strikes. Exhibit calculates average VIX observed for each quarter based on daily closes.
US Fed Funds Rate Expectations
The Fed announced a widely anticipated additional 25 bp rate hike in June, in line with recent FOMC projections, but the market continues to price in a far more gradual pace of rate hikes going forward
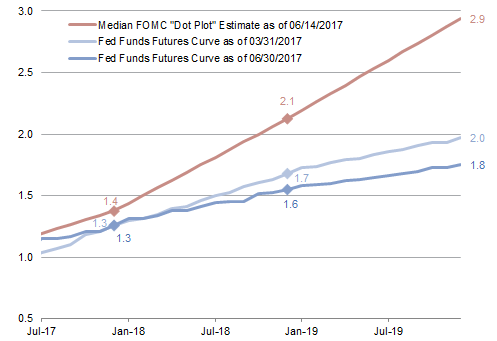
US Fed Funds Rate Expectations
Percent (%)
Sources: Bloomberg L.P., Federal Reserve, and Thomson Reuters Datastream.
Note: All data are through December 2019.
Forecasted Calendar Year 2017 EPS Growth
Earnings per share (EPS) growth expectations for 2017 remained quite strong across regions but have slightly declined in the United States and United Kingdom, while EPS growth forecasts in the Eurozone and emerging markets have been upgraded
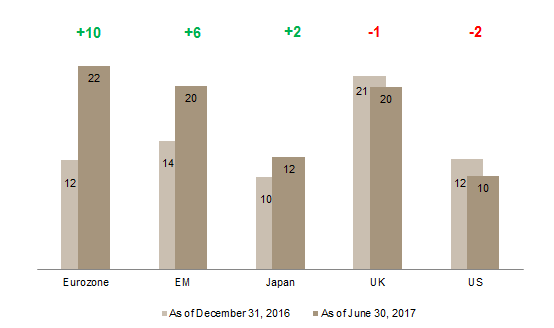
Forecasted Calendar Year 2017 EPS Growth
As of June 30, 2017 • Year-over-Year Percent Change (%)
Sources: I/B/E/S, MSCI Inc., and Thomson Reuters Datastream. MSCI data provided “as is” without any express or implied warranties.
Notes: All data are in local currency terms except EM, which is in USD terms. Data for Japan represents the fiscal year ending March 31 of the subsequent year.
Cumulative Wealth of MSCI ACWI Growth to Value
Growth stocks outperformed value counterparts, continuing the first quarter trend and driven by strong earnings growth and lower global bond yields. Following their year-to-date rally, growth stocks have reversed nearly all of their late 2016 underperformance
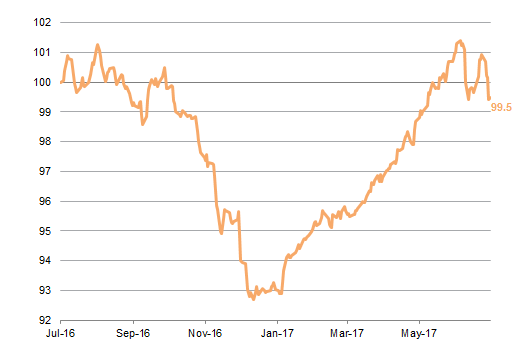
Cumulative Wealth of MSCI ACWI Growth to Value
July 1, 2016 – June 30, 2017 • US Dollar • July 1, 2016 = 100
Sources: MSCI Inc., and Thomson Reuters Datastream. MSCI data provided “as is” without any express or implied warranties.
Notes: Cumulative wealth data are daily. Total return data for all MSCI indexes are net of dividend taxes.
Currency Performance
The US dollar continued to weaken in the second quarter as the DXY Index reached a nine-month low. The greenback fell vis-à-vis the Australian dollar, Canadian dollar, euro, Swiss franc, UK sterling, and our EM currency basket, but slightly strengthened against the Japanese yen
The euro strengthened against all major currencies as political risk abated following French presidential and parliamentary victories for Macron and his pro-EU party. Over the past 12 months, the euro has strengthened against all major currencies, except for the Australian dollar, which was flat
The UK sterling strengthened against all major currencies outside Europe following disappointing snap election results for Prime Minister Theresa May’s Conservative party, which lost its outright majority. The pound remains down sharply against nearly all major currencies since the Brexit vote just over one year ago
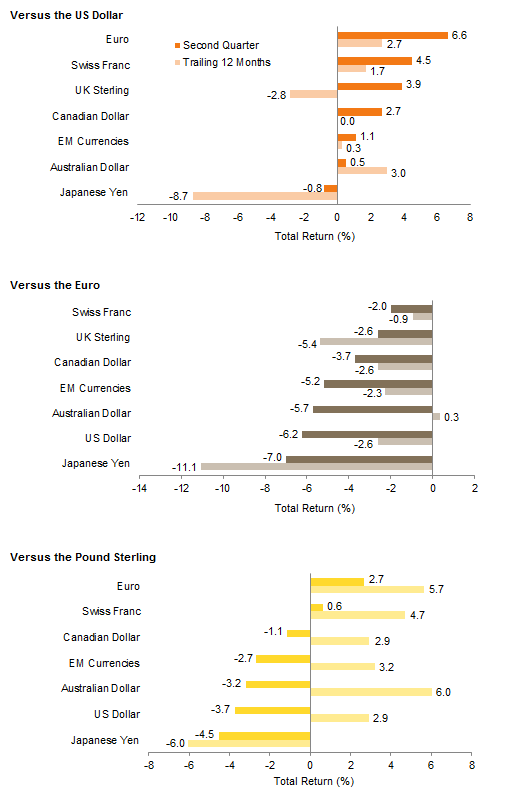
Currency Performance
As of June 30, 2017
Sources: MSCI Inc. and Thomson Reuters Datastream. MSCI data provided “as is” without any express or implied warranties.
Note: EM currencies is an equal-weighted basket of 20 currencies.
Index Performance (US$)
First quarter 2017 themes continued as a weaker US dollar helped emerging markets assets and developed markets equities outperform US stocks. US equities still notched decent gains, with large-cap stocks besting small caps, and outpaced domestic bonds. Commodities fell for the quarter and are now down over the past 12 months
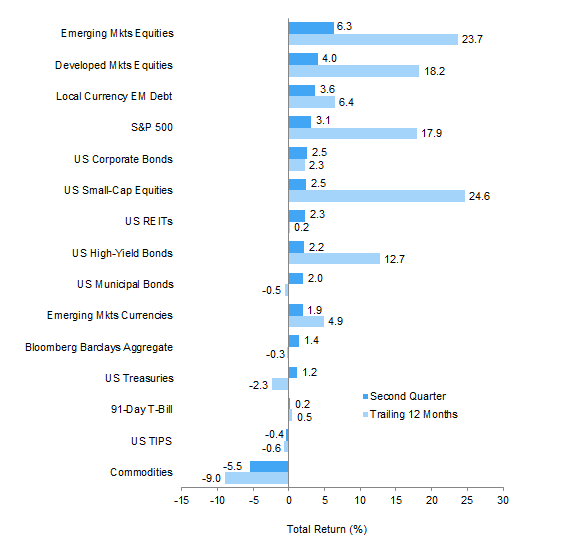
Index Performance (US$)
As of June 30, 2017
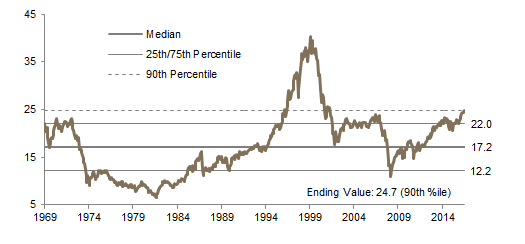
MSCI US Composite Normalized P/E
December 31, 1969 – June 30, 2017
Sources: Barclays, Bloomberg L.P., BofA Merill Lynch, FTSE International Limited, Frank Russell Company, J.P. Morgan Securities, Inc., MSCI Inc., National Association of Real Estate Investment Trusts, Standard & Poor’s, and Thomson Reuters Datastream. MSCI data provided “as is” without any express or implied warranties.

Fixed Income Yields
June 2016 – June 2017
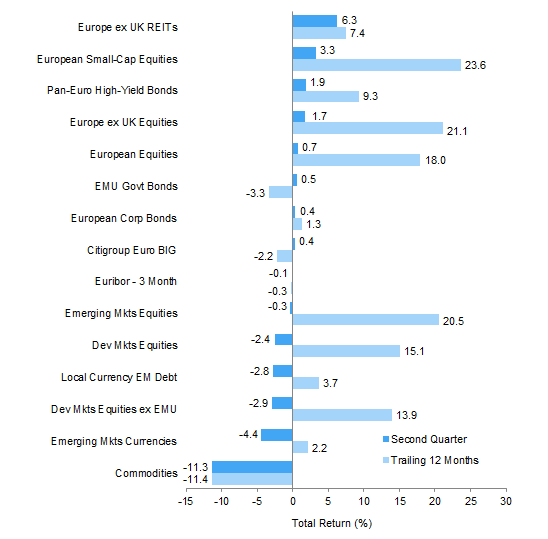
Index Performance (€)
Europe ex UK REITs and European small-cap equities outperformed both European bonds and equities. Continued euro strength was a headwind to returns from outside the region with developed markets equities and emerging markets assets declining. European small-cap equities are now the best performing asset class over the past 12 months
Index Performance (€)
As of June 30, 2017
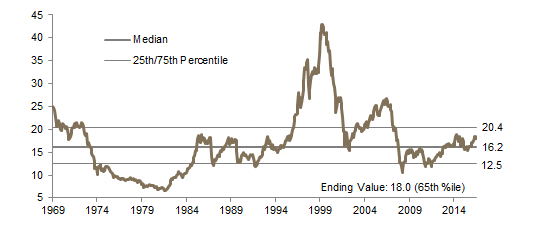
MSCI Europe ex UK Composite Normalized P/E
December 31, 1969 – June 30, 2017
Sources: Barclays, Bloomberg L.P., Citigroup Global Markets, EPRA, FTSE International Limited, J.P. Morgan Securities, Inc., MSCI Inc., National Association of Real Estate Investment Trusts, Standard & Poor’s, and Thomson Reuters Datastream. MSCI data provided “as is” without any express or implied warranties.
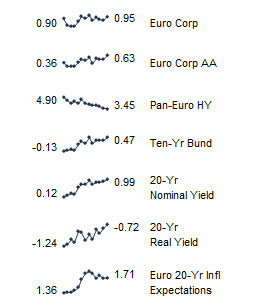
Fixed Income Yields
June 2016 – June 2017
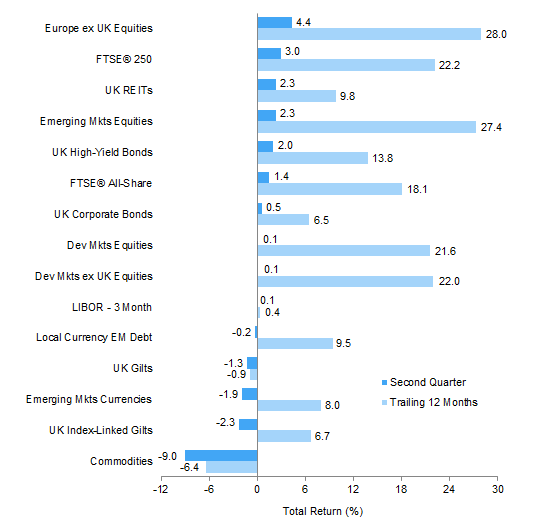
Index Performance (£)
For sterling investors, Europe ex UK equities led the way on euro strength, while UK mid-cap stocks, UK REITs, and emerging markets equities also posted decent gains. UK high-yield bonds outpaced UK equities and UK investment-grade bonds. UK gilts outperformed UK linkers, but both declined
Index Performance (£)
As of June 30, 2017
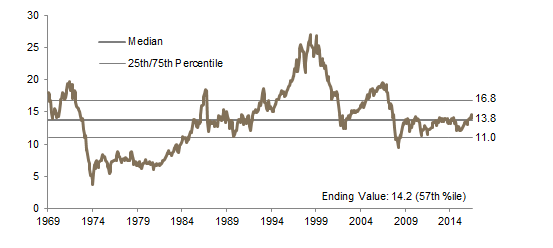
MSCI UK Composite Normalized P/E
December 31, 1969 – June 30, 2017
Sources: Barclays, Bloomberg L.P., BofA Merill Lynch, EPRA, FTSE International Limited, J.P. Morgan Securities, Inc., MSCI Inc., National Association of Real Estate Investment Trusts, Standard & Poor’s, and Thomson Reuters Datastream. MSCI data provided “as is” without any express or implied warranties.
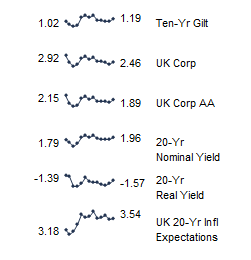
Fixed Income Yields
June 2016 – June 2017
Exhibit Notes
Performance Exhibits
Total return data for all MSCI indexes are net of dividend taxes.
US dollar index performance chart includes performance for the Bloomberg Barclays Aggregate Bond, Bloomberg Barclays Corporate Investment Grade, Bloomberg Barclays High-Yield Bond, Bloomberg Barclays Municipal Bond, Bloomberg Barclays US TIPS, Bloomberg Barclays US Treasuries, BofA Merrill Lynch 91-Day Treasury Bills, FTSE® NAREIT All Equity REITs, J.P. Morgan ELMI+, J.P. Morgan GBI-EM Global Diversified, MSCI Emerging Markets, MSCI World, Russell 2000®, S&P 500, and S&P GSCI™ indexes.
Euro index performance chart includes performance for the Bloomberg Barclays Euro-Aggregate: Corporate, Bloomberg Barclays Pan-Euro High Yield, Citigroup EMU Govt Bonds, Citigroup Euro Broad Investment-Grade Bonds, EURIBOR 3M, FTSE® EPRA/NAREIT Europe ex UK, J.P. Morgan ELMI+, J.P. Morgan GBI-EM Global Diversified, MSCI Emerging Markets, MSCI Europe, MSCI Europe ex UK, MSCI Europe Small-Cap, MSCI World ex EMU, MSCI World, and S&P GSCI™ indexes.
UK sterling index performance chart includes performance for the Bloomberg Barclays Sterling Aggregate: Corporate Bond, BofA Merrill Lynch Sterling High Yield, FTSE® 250, FTSE® All-Share, FTSE® British Government All Stocks, FTSE® British Government Index-Linked All Stocks, FTSE® EPRA/NAREIT UK RE, J.P. Morgan ELMI+, J.P. Morgan GBI-EM Global Diversified, LIBOR 3M GBP, MSCI Emerging Markets, MSCI Europe ex UK, MSCI World, MSCI World ex UK, and S&P GSCI™ indexes.
Valuation Exhibits
The composite normalized P/E ratio is calculated by dividing the inflation-adjusted index price by the simple average of three normalized earnings metrics: ten-year average real earnings (i.e., Shiller earnings), trend-line earnings, and return on equity–adjusted earnings. We have removed the bubble years 1998–2000 from our mean and standard deviation calculations. All data are monthly.
Fixed Income Yields
US fixed income yields reflect Bloomberg Barclays Municipal Bond Index, Bloomberg Barclays US Corporate High-Yield Bond Index, Bloomberg Barclays US Corporate Investment-Grade Bond Index, and the ten-year Treasury.
European fixed income yields reflect the BofA Merrill Lynch Euro Corporate AA Bond Index, BofA Merrill Lynch Euro Corporate Bond Index, Barclays Pan-European Aggregate High Yield Bond Index, Bloomberg Twenty-Year European Government Bond Index (nominal), ten-year German bund, 20-year European Inflation Swaps (inflation expectations), and the real yield calculated as the difference between the inflation expectation and nominal yield.
UK sterling fixed income yields reflect the BofA Merrill Lynch Sterling Corporate AA Bond Index, BofA Merrill Lynch Sterling Corporate Bond Index, UK ten-year gilts, Bank of England 20-year nominal yields, and Bloomberg Generic UK 20-year inflation-linked (real) yields.