Second quarter ended on a volatile note for global capital markets as the uncertainty triggered by the United Kingdom’s vote on June 23 to exit the European Union weighed on the outlook. Risk assets rallied after the initial downdraft to recover most, if not all, of their post-referendum losses. High-quality government bonds continued their rally, outperforming global equities in aggregate as investors seeking safe havens pushed yields toward record lows. While returns for global equities were modestly positive overall, considerable dispersion occurred across regions; gains in UK, US, and emerging markets stocks were offset by losses for Europe ex UK and Japanese equities. That being said, record currency volatility resulted in decidedly different outcomes depending on base currency. Inflation-sensitive assets enjoyed the strongest performance, with commodity-related categories notching double-digit gains on the back of both the oil price recovery and the rally in gold and other precious metals.
Against a still-fragile global economic backdrop, the run-up to the UK referendum and its result dominated headlines and helped drive financial markets, as did the words and actions of central bankers both before and after the historic vote. The vote’s outcome and its immediate aftermath appear to have reinforced the view that global growth and interest rates will remain “lower for longer.” Central bankers in the United Kingdom, the Eurozone, and Japan have since called for and pledged coordinated monetary support, with further stimulus now anticipated from multiple sources in the weeks ahead. Uncertainty regarding how the vote would unfold may have also contributed to the US Federal Open Market Committee’s (FOMC) June 14 decision to keep its benchmark rate unchanged, with members downgrading their expectations for the future path of interest rates, although the median member still called for two hikes this year. For its part, the futures market has concluded that the Federal Reserve will be on hold for the foreseeable future, as Fed Funds futures now push out the next rate hike until 2018. All of these reactions certainly contributed to the strong recovery in risk assets into quarter end, but they also reinforce expectations for a low return environment going forward.
US equities (2.5%) outperformed developed and emerging markets equivalents in second quarter as investors preferred the perceived relative safety of US stocks despite their considerably richer valuations. Economic data releases over the quarter sent mixed signals, though current estimates for second quarter growth sit at 2.6%, an improvement over the 1.1% growth in first quarter. The oil price recovery and more stable US dollar have certainly helped the situation, though they continue to weigh on the near-term outlook for US corporate earnings, with second quarter consensus estimates remaining negative on a year-over-year basis. Analysts still forecast an earnings recovery starting in the second half and through 2017, and this continues to be what the market is pricing in.
UK equities (6.7%) were the best-performing developed market in second quarter, though the plunge in the British pound meant that foreign investors suffered losses on their UK stock exposures. The United Kingdom’s outperformance was driven by a strong rally in UK large caps following the EU referendum result, as the weaker currency boosted the outlook for the exporters and multinationals that dominate that segment of the market. In contrast, UK mid caps (-2.9%) declined given their more domestic orientation and due to expectations that the UK economy could fall into recession as a result of the uncertainty caused by the country’s decision to leave the EU. Among sectors in the FTSE® All-Share Index, only consumer services and financials experienced declines.
Europe ex UK (-1.1%), EMU (-2.9%), and Japanese (-7.8%) equities underperformed for the quarter. Financials and consumer discretionary stocks were particularly hard hit. Eurozone and Japanese banks sold off, with many now trading at just about half of book value amid concerns that negative rates are here to stay and could go even lower, despite a growing consensus that they have been largely ineffective at stimulating demand. As a result, valuations for Eurozone and Japanese equities overall now sit at extremely low levels relative to US equivalents.
Emerging markets equities (0.8%) slightly underperformed developed markets equivalents for the quarter but remain comfortably ahead on a year-to-date basis. Emerging markets small caps edged large caps in the quarter. Growth stocks outperformed their value counterparts, unlike in developed markets, driven by the strong performance of the consumer staples and IT sectors. Among the major regions, Latin America (2.2%) and emerging Asia (1.2%) gained, while emerging Europe, the Middle East & Africa (-1.5%) declined. The top-performing countries included Peru (18.2%), the Philippines (8.2%), and India (5.7%). The latter topped recent headlines as the Modi government passed additional reforms, opening further sectors to foreign investment, while the respected central bank governor Raghuram Rajan announced his decision to step down at the end of his term. Emerging European markets Poland (-12.0%), Greece (-11.7%), and Turkey (-5.7%) declined the most.
Inflation-sensitive asset performance was particularly strong in second quarter as commodity prices recovered and the increasingly uncertain outlook and market volatility prompted investors to favor assets offering value and income. Energy master limited partnerships (19.7%) set a blistering pace, and commodity futures (12.8% for the Bloomberg Commodity TR Index and 12.7% for the energy-heavy S&P GSCI®) and natural resources equities (12.6%) also enjoyed double-digit gains. Crude oil prices ended the quarter 25% higher, near $50/barrel, and gold rallied 7% to close at $1321.07/troy ounce. US REITs (7.4%) outperformed international equivalents as the EU referendum result weighed on the outlook for UK REITs (-6.9%) given expectations for falling demand and prices if the country proceeds with a “Brexit.” UK linkers (9.8%) significantly outperformed nominal bonds as the plummeting pound sterling created some concern that inflation could spike in the future. US TIPS (1.7%) saw more muted gains, trailing nominal Treasuries.
Global government bonds (2.8%) experienced strong gains amid rising economic uncertainty and have outperformed global equities for both the quarter and the year-to-date period. Government bond yields approached, and in some cases reached, record low levels. Yield curves also flattened as investors extended duration with growth and inflation expectations having been ratcheted down. UK gilts (6.2%) proved a powerful hedge against the United Kingdom’s “Leave” decision, with record low gilt yields hardly a sign from markets that the United Kingdom will be better off outside the EU. Investors also sought refuge in US Treasuries (2.1%) and EMU sovereigns (2.2%). US tax-exempt bonds (2.6%) similarly benefitted from safe haven flows. US high-yield bonds (5.5%) outperformed due in part to the oil price recovery.
Safe haven currencies dominated amid record volatility. The Japanese yen was near universally strong, rallying below 100 per US dollar before the Bank of Japan intervened to halt its appreciation. The trade-weighted dollar advanced as the British pound and Mexican peso each depreciated roughly 7% versus the greenback; the euro and Chinse yuan each weakened over 2%. The British pound briefly touched $1.31, a level not seen in 30 years, after experiencing its largest single day drop on record. The euro was also generally weaker but strengthened against the UK pound, Mexican peso, and Polish zloty. Emerging markets currencies generally proved fairly resilient amid the turmoil, though with wide dispersion across countries. The Mexican peso, the most liquid emerging markets currency and a proxy for emerging markets risk, was particularly hard hit, as were some Eastern European currencies given their trade ties with the United Kingdom and Eurozone. Oil exporter currencies like the Brazilian real and Russian ruble were notable outperformers.
Market Exhibits
Performance of Global Equities in 2016
After generally enjoying a positive quarter through late June, global equities fell sharply in the two days following the UK’s surprise vote on June 23 to leave the EU; however, many markets rallied to recover most, if not all, of their initial losses. Eurozone and Japanese equities were the notable exceptions

Performance of Global Equities in 2016
As of June 30, 2016 • Local Currency • Percent (%)
Sources: MSCI Inc. and Thomson Reuters Datastream. MSCI data provided “as is” without any express or implied warranties.
Notes: Global represents the return of MSCI All Country World Index and DM, the MSCI World Index; remaining returns are for the MSCI indexes. Pre-“Brexit” return represents April 1 to June 23; “Brexit,” June 24 to June 27. Total returns for MSCI developed markets indexes are net of dividend taxes. Total returns for MSCI emerging markets indexes are gross of dividend taxes.
Cumulative Wealth of Various UK Assets in 2016
UK assets were most impacted by the “Brexit” decision, though outcomes across asset classes were quite varied. Pound sterling and domestic-oriented assets like smaller-cap equities and REITs were hit hardest, while UK gilts and linkers rallied sharply and offshore-oriented UK large caps benefitted from the weaker currency
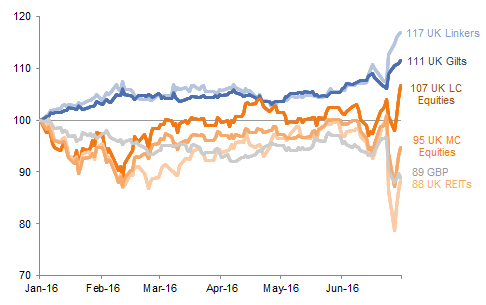
Cumulative Wealth of Various UK Assets in 2016
January 1, 2016 – June 30, 2016 • January 1, 2016 = £100
Sources: Bank of England, Barclays, FTSE International Limited, and Thomson Reuters Datastream.
Notes: Data are daily. Performance reflects total returns, except for GBP, which is the change in trade-weighted exchange rate, represented by the Bank of England Pound Sterling Effective Exchange Rate Index. UK Large Cap equities are represented by the FTSE® 100 Index; UK Mid Cap equities, the FTSE® 250 Index; UK gilts, the FTSE® British Government All Stocks Bond Index; UK linkers, Barclays UK Gilts Inflation Linked Index; and UK REITs, the FTSE® All-Share Real Estate Investment Trust Index.
Cumulative Wealth of Regional MSCI Bank Indexes in 2016
Developed markets bank stocks have been hurt by negative interest rates and flattening yield curves, among other challenges. Eurozone and Japanese banks have underperformed the most given the outsized headwinds they face; US and UK banks are better positioned to weather the “lower for longer” environment but have not been immune to negative investor sentiment

Cumulative Wealth of Regional MSCI Bank Indexes in 2016
January 1, 2016 – June 30, 2016 • Local Currency • January 1, 2016 = 100
Sources: MSCI Inc. and Thomson Reuters Datastream. MSCI data provided “as is” without any express or implied warranties.
Notes: Cumulative wealth data are based on total returns net of dividend taxes. All data are daily.
US Fed Funds Rate Expectations
The disappointing May jobs report and concerns regarding the looming UK referendum likely contributed to the Fed’s decision to remain on hold at its June 14 policy meeting. FOMC members downgraded their expectations for the future path of interest rates but still guided toward two hikes in 2016, while the futures markets has now priced out any rate increase this year
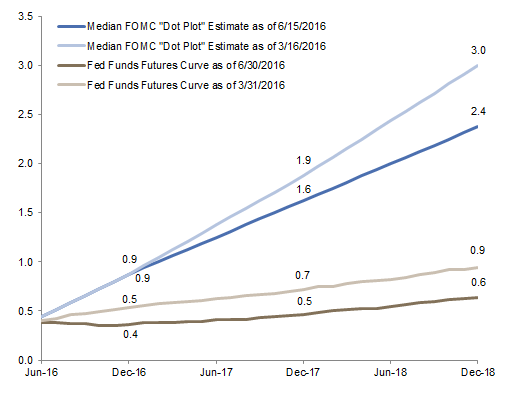
US Fed Funds Rate Expectations
Percent (%)
Sources: Bloomberg L.P. and Federal Reserve.
Currency Performance
Investors sought refuge in the US dollar and, particularly, the Japanese yen after the UK referendum result. The greenback finished the quarter having appreciated on a trade-weighted basis, with the British pound and the Mexican peso the weakest performers vs the dollar
The euro weakened relative to the US dollar and Japanese yen, strengthened against the British pound, and was relatively flat vs the Swiss franc. Over the last 12 months, the euro has strengthened vs the UK pound and Swiss franc and has been effectively flat against the US dollar
The pound sterling has depreciated sharply over the past year, particularly in second quarter, owing to the “Brexit” decision and amid heightened concern regarding the UK’s ability to fund its sizeable current account deficit going forward. The pound touched historic lows vs the US dollar immediately following the former’s largest single day drop on record
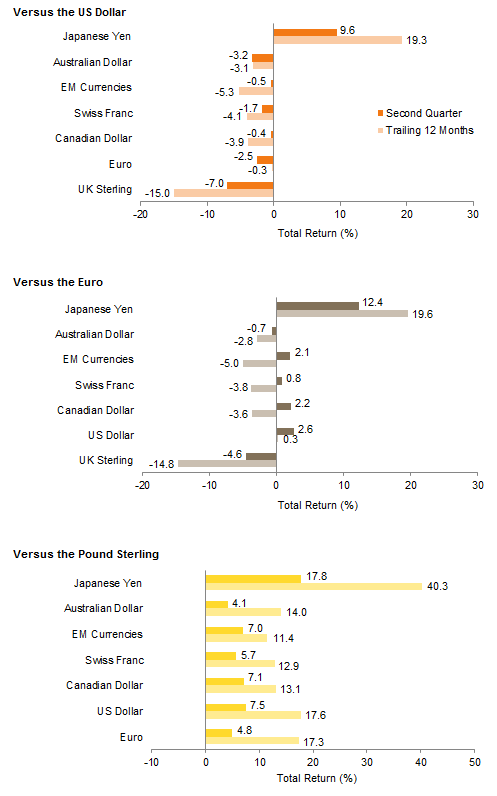
Currency Performance
As of June 30, 2016
Sources: MSCI Inc. and Thomson Reuters Datastream. MSCI data provided “as is” without any express or implied warranties.
Note: EM currencies is an equal-weighted basket of 20 currencies.
Index Performance (US$)
Most liquid asset classes generated positive returns for USD investors in second quarter, with USD strength contributing to the outperformance of US equities relative to developed and emerging markets stocks. Commodity futures were particularly strong performers as oil recovered and gold rallied. US REITs, US high-yield bonds, US small caps, and US tax-exempt bonds all outperformed US large caps, which in turn edged out US Treasuries despite decent gains for the quarter

Index Performance (US$)
As of June 30, 2016

MSCI US Composite Normalized P/E
December 31, 1969 – June 30, 2016
Sources: Barclays, BofA Merill Lynch, FTSE International Limited, Frank Russell Company, J.P. Morgan Securities, Inc., MSCI Inc., National Association of Real Estate Investment Trusts, Standard & Poor’s, and Thomson Reuters Datastream. MSCI data provided “as is” without any express or implied warranties.

Fixed Income Yields
June 2015 – June 2016
Index Performance (€)
Commodity futures, foreign bonds, and international equities outperformed European assets in euro terms in second quarter. European bonds and REITs enjoyed positive returns and outperformed European equities, which suffered declines and are among the worst performers over the last 12 months, along with emerging markets equities and commodities
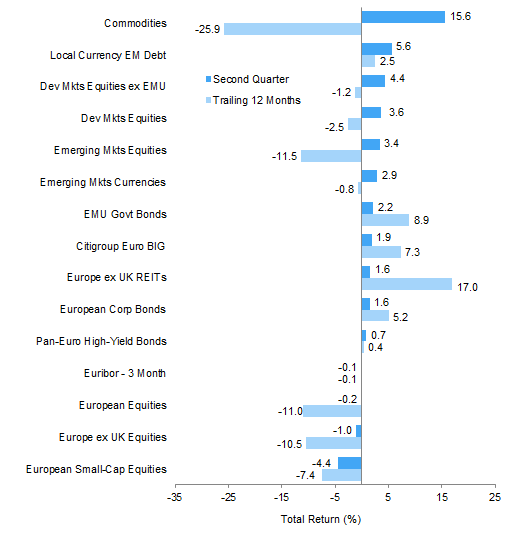
Index Performance (€)
As of June 30, 2016
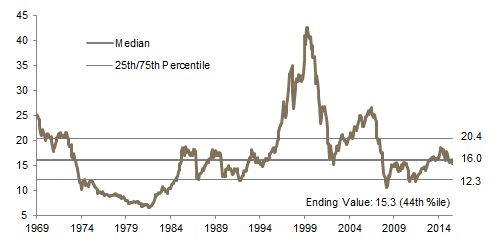
MSCI Europe ex UK Composite Normalized P/E
December 31, 1969 – June 30, 2016
Sources: Barclays, Citigroup Global Markets, EPRA, FTSE International Limited, J.P. Morgan Securities, Inc., MSCI Inc., National Association of Real Estate Investment Trusts, Standard & Poor’s, and Thomson Reuters Datastream. MSCI data provided “as is” without any express or implied warranties.
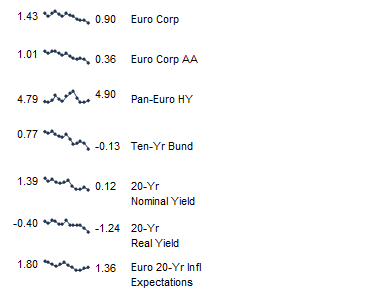
Fixed Income Yields
June 2015 – June 2016
Index Performance (₤)
Pound sterling weakness and an uncertain outlook for the UK economy following the “Brexit” vote contributed to the outperformance of commodities, developed ex UK equities and debt, and UK government bonds over UK equities. UK large caps still generated respectable gains as currency weakness boosted the outlook for the exporters and multinationals that feature prominently in that segment of the market, while more domestic-oriented UK mid caps and UK REITs experienced losses

Index Performance (₤)
As of June 30, 2016

MSCI UK Composite Normalized P/E
December 31, 1969 – June 30, 2016
Sources: Barclays, BofA Merrill Lynch, EPRA, FTSE International Limited, J.P. Morgan Securities, Inc., MSCI Inc., National Association of Real Estate Investment Trusts, Standard & Poor’s, and Thomson Reuters Datastream. MSCI data provided “as is” without any express or implied warranties.

Fixed Income Yields
June 2015 – June 2016
Exhibit Notes
Performance Exhibits
Total returns for MSCI developed markets indexes are net of dividend taxes. Total returns for MSCI emerging markets indexes are gross of dividend taxes.
US dollar index performance chart includes performance for the Barclays Corporate Investment Grade, Barclays High Yield Bond, Barclays Municipal Bond, Barclays US TIPS, Barclays US Treasuries, BofA Merrill Lynch 91-Day Treasury Bills, FTSE® NAREIT All Equity REITs, J.P. Morgan ELMI+, J.P. Morgan GBI-EM Global Diversified, MSCI Emerging Markets, MSCI World, Russell 2000®, and S&P GSCI™ indexes.
Euro index performance chart includes performance for the Barclays Euro-Aggregate: Corporate, Barclays Pan-Euro High Yield, Citigroup EMU Govt Bonds, FTSE® EPRA/NAREIT Europe ex UK, J.P. Morgan ELMI+, J.P. Morgan GBI-EM Global Diversified, MSCI Emerging Markets, MSCI Europe, MSCI Europe ex UK, MSCI Europe Small Cap, MSCI World ex EMU, MSCI World, and S&P GSCI™ indexes.
UK sterling index performance chart includes performance for the Barclays Sterling Agg Corps, BofA Merrill Lynch Sterling High Yield, FTSE® British Government All Stocks, FTSE® British Government Index-Linked All Stocks, FTSE® EPRA/NAREIT UK RE, FTSE® 250, J.P. Morgan ELMI+, J.P. Morgan GBI-EM Global Diversified, MSCI Emerging Markets, MSCI Europe ex UK, MSCI World, MSCI World ex UK, and S&P GSCI™ indexes.
Valuation Exhibits
The composite normalized P/E ratio is calculated by dividing the inflation-adjusted index price by the simple average of three normalized earnings metrics: ten-year average real earnings (i.e., Shiller earnings), trend-line earnings, and return on equity–adjusted earnings. We have removed the bubble years 1998–2000 from our mean and standard deviation calculations. All data are monthly.
Fixed Income Yields
US fixed income yields reflect Barclays Municipal Bond Index, Barclays US Corporate High Yield Bond Index, Barclays US Corporate Investment-Grade Bond Index, and the ten-year Treasury.
European fixed income yields reflect the BofA Merrill Lynch Euro Corporate AA Bond Index, BofA Merrill Lynch Euro Corporate Bond Index, Barclays Pan-European Aggregate High Yield Bond Index, Bloomberg Twenty-Year European Government Bond Index (nominal), ten-year German bund, 20-year European Inflation Swaps (inflation expectations), and the real yield calculated as the difference between the inflation expectation and nominal yield.
UK sterling fixed income yields reflect the BofA Merrill Lynch Sterling Corporate AA Bond Index, BofA Merrill Lynch Sterling Corporate Bond Index, UK ten-year gilts, and Bank of England 20-year nominal, real, and zero coupon (inflation expectations) yields.