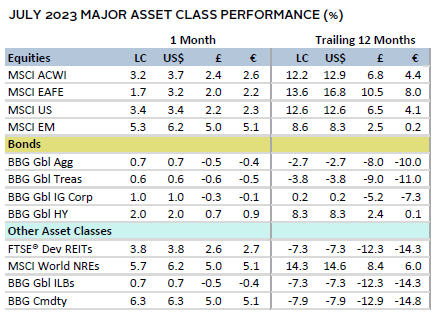
Risk assets rallied in July as slowing inflation and pockets of economic resilience supported performance. Global equities advanced, as the recent gains driven by artificial intelligence (AI) and mega-cap stocks broadened amid better-than-expected earnings results. Indeed, value edged growth, and small caps topped large caps. Emerging stocks outperformed developed peers, as Chinese equities soared on signs of economic support measures. Corporate bonds bested government peers, with spreads continuing their tightening trend over the last year. Real assets surged across the board, highlighted by rebounding energy and industrial metals prices. The US dollar broadly weakened, whereas the euro and UK sterling were mixed.
Sources: Bloomberg Index Services Limited, Bloomberg L.P., EPRA, FTSE International Limited, MSCI Inc., National Association of Real Estate Investment Trusts, and Thomson Reuters Datastream. MSCI data provided “as is” without any express or implied warranties.
Note: Local currency returns for the Bloomberg fixed income indexes, the Bloomberg Commodity Index, and the FTSE® Developed REITs are in USD terms.
The Macro Picture
Risk appetite was supported in July by continued inflation moderation. Softer-than-expected prints in the United States and United Kingdom were the primary catalysts, although core (ex food and energy) rates remained elevated. The Federal Reserve and European Central Bank (ECB) both raised policy rates by 25 basis points (bps), as expected, and left the door open to additional hikes. However, policy guidance was generally less hawkish, which led markets to price in higher odds that the tightening cycle could be nearing its end. The Bank of Japan (BOJ) adhered to a more dovish stance, but unexpectedly tweaked its yield curve control (YCC) policy to offer more flexibility for ten-year government bond yields to rise further than previously allowed. The move sent a jolt through global markets on concerns of tighter liquidity and contributed to upward pressure on bond yields.
Resilient economic data also supported sentiment. The US economy highlighted this theme, with GDP growth unexpectedly accelerating in the second quarter to 2.4% annualized. Still, outcomes in other regions diverged, and forward-looking indicators softened. GDP growth in Germany stagnated in the second quarter, while China’s 6.3% year-over-year (YOY) expansion underwhelmed by a wide margin, leading economists to lower their full-year 2023 expectations. Although the International Monetary Fund modestly upgraded their 2023 global growth outlook, they flagged that risks are tilted to the downside. Indeed, purchasing manager index (PMI) data in July generally came in softer than anticipated, with data for Europe suggesting overall activity contracted for a second straight month. In addition, Fed and ECB reports pointed to further tightening in bank lending conditions, putting the outlook on tenuous footing.
Equities
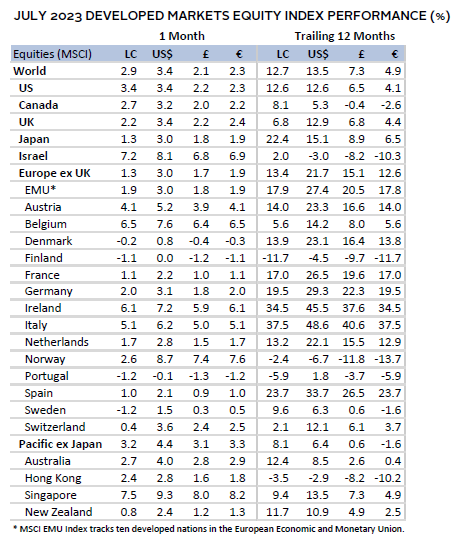
US equities bested their developed markets (DM) ex US counterparts, with July’s performance bringing year-to-date (YTD) gains to more than 20%. Notably, recent AI and mega-cap tech driven performance broadened, as the equal-weighted index outperformed, and value edged growth. Energy and financials—both value-oriented sectors—were top performers along with communication services. Small caps outperformed large caps for a second straight month but remain 6 percentage points (ppts) behind YTD. Roughly halfway through second quarter earnings season, results generally beat expectations. Still, analysts expect S&P 500 earnings declined more than 7% YOY, the third straight quarter of negative YOY growth rates, as profit margins have come under pressure.
Economic data in July appeared to challenge the outlook for a US recession. Headline inflation slowed for a 12th straight month to 3.0% YOY in June, its lowest rate since March 2021. The Fed’s preferred core inflation gauge also decelerated more than expected to 4.1% YOY. Although ongoing labor market strength suggested continued inflationary pressure, it has nonetheless supported consumer confidence and spending, which was the top contributor to GDP growth in the second quarter. An acceleration in business investment also bolstered the GDP print, and durable goods orders in June topped expectations. Indeed, Fed Chair Jerome Powell noted that while Fed staff expect a slowdown, they no longer forecast a US recession, but the risk of higher inflation remains. However, several cracks emerged in more forward-looking data. The rejection rate for new loan applicants jumped to the highest level in five years, leading economic indicators fell for a 15th straight month, and composite PMI data came in below expectations in July as manufacturing activity remained in contraction.
European equities advanced, slightly trailing broader DM ex US. UK stocks outperformed Europe ex UK shares (euro area stocks were more on par with UK peers), with the latter dragged down by declines from several Nordic countries.
The Eurozone macro picture was largely mixed. The economy returned to growth in the second quarter, with GDP expanding 0.3% quarter-over-quarter (QOQ). However, the German economy stagnated following two quarters of contraction, as weak industrial activity offset a rebound in household spending. Inflation moderated to 5.3% YOY in July, but core inflation proved stickier than expected, holding steady at 5.5%. PMI data suggested that activity contracted for a second straight month in July, with German manufacturing at a nearly 40-month low. ECB lending data showed material tightening in credit conditions, as business loan demand fell to the weakest on record since 2003. Still, the ECB lifted its deposit facility rate to 3.75%, but shifted to a more “data-dependent” approach, implying a less hawkish stance.
UK markets rallied as headline inflation slowed to 7.9% YOY in June versus 8.7% in May. While core inflation also moderated to just under 7%, it remained near a three-decade high. Markets repriced peak Bank of England (BOE) rate expectations lower by 75 bps to around 5.75%, and raised the odds of a slower, 25-bp hike at the early August meeting. Despite the progress on inflation, wage growth accelerated at its fastest pace outside of the pandemic period and unemployment continued increasing, muddying the BOE’s policy calculus. Moreover, economic momentum slowed as July’s PMI data underwhelmed and consumer confidence dropped by the most in more than a year.
Japanese equities lagged broader DM following strong outperformance in local currency terms in the second quarter. The surprise policy adjustment by the BOJ contributed to the Japanese yen rallying nearly 2% versus the US dollar, which weighed on equity markets. Specifically, as part of its YCC policy, the central bank effectively increased its upper limit on ten-year government bond yields from 0.5% to 1.0%, sending yields to their highest levels since 2014. While the market viewed this action as tightening, the BOJ maintained it was an effort to improve market functioning. Still, the move likely presages further adjustment, coming just a few months into Governor Kazuo Ueda’s term. Japanese inflation rates generally pushed higher, with one measure of core inflation topping 4% YOY for the first time in more than 40 years.
Pacific ex Japan equities rallied, outperforming broader DM for the first time this year. Performance was boosted by Singapore, where second quarter GDP growth accelerated more than expected and sentiment improved on China’s policy support announcements. New Zealand shares lagged as inflation proved stickier than expected at 6.0% YOY in the second quarter, with price pressures in the services sector remaining elevated. Still, amid largely stagnant economic growth, the Reserve Bank of New Zealand opted to hold rates steady for the first time in nearly two years at 5.5%, expecting the current rate to persist well into 2024. The Reserve Bank of Australia also held rates steady at 4.1%, as retail sales declined in June, inflation slowed more than anticipated in the second quarter, and business activity contracted in July. Consumer sentiment remains challenged in Australia and New Zealand, as a wave of mortgage resets to higher rates are expected in the coming months.
Sources: MSCI Inc. and Thomson Reuters Datastream. MSCI data provided “as is” without any express or implied warranties.
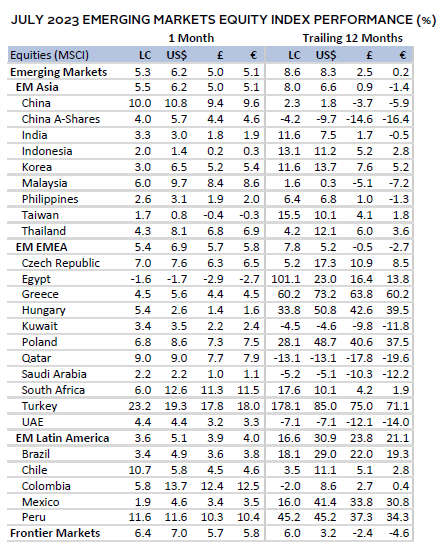
Emerging markets equities bested developed peers for the first time in six months, boosted by Chinese equities and a softer US dollar. Still, emerging markets (EM) continues to lag DM by over 7 ppts YTD. Among major emerging regions, Asia and Europe, the Middle East & Africa edged the broader index, and Latin America lagged. Korea, India, and Taiwan balanced some of China’s gains, underperforming the broader index. Korean exports fell 16.5% YOY in July, with protracted weakness in semiconductors and shipments to China. The Taiwanese economy returned to growth in the second quarter on strong domestic demand, but export data remained weak. Brazil remains among the top performers over the trailing 12 months but lagged in July. GDP contracted in May and inflation slowed to 3.2% YOY, raising the prospect of central bank cuts in early August. The Chilean central bank cut rates by 100 bps, marking one of the first EMs to start easing. Although stocks surged in local terms, the peso plunged against major DM peers.
Chinese equities accounted for half of the broader index return as optimism around policy support measures grew. Indeed, economic data remained weak in July: GDP growth in the second quarter slowed to just 0.8% QOQ, property sector investment slumped further, retail sales missed expectations, exports (-12.4% YOY) fell the most since the beginning of the pandemic, and manufacturing activity remained in contractionary territory. Against this backdrop, authorities announced a slew of targeted measures to boost consumption and eased restrictions on home buying. Although policymakers have been reticent to roll out broader fiscal and monetary stimulus as in prior cycles, the consistent message in July—coupled with oversold conditions, low valuations, and a still-healthy fundamental backdrop—supported the rally.
Sources: MSCI Inc. and Thomson Reuters Datastream. MSCI data provided “as is” without any express or implied warranties.
Fixed Income
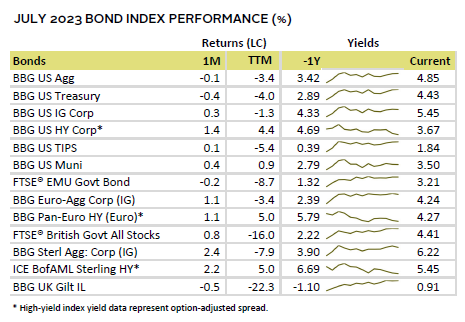
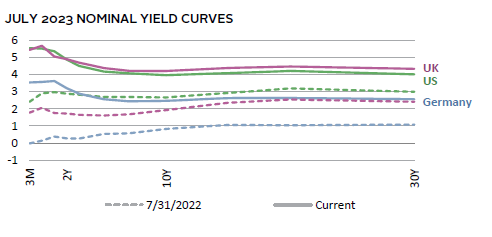
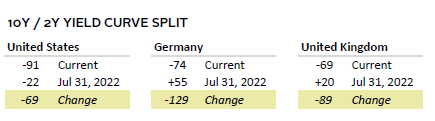
US fixed income performance reflected the risk-on mood, with high-yield and investment-grade corporate bonds outperforming Treasuries. High-yield credit spreads tightened roughly 20 bps in July and have narrowed over 100 bps YTD. At roughly 370 bps, spread levels are now more than 20% below median, pricing in an optimistic economic outlook even as default rates have picked up. Treasury yields generally rose across the curve, with the ten-year up 16 bps to 3.97%, ending slightly lower than the intra-month high of 4.06%. While markets largely expect the Fed will keep policy rates at the current 5.25%–5.50% range through year end, resilient growth data and reverberation from the BOJ policy shift pushed yields higher. The yield curve remained deeply inverted, and the bond market’s pricing of inflation expectations inched up to near 2.4% as ten-year real yields held steady.
Euro- and sterling-denominated corporate bonds also outperformed their government counterparts. However, UK gilts gained nearly 1% as inflation slowed more than expected and BOE rate expectations repriced lower. The ten-year gilt yield fell just 7 bps to 4.21%; however, the decline in yields was most pronounced at the short end, with two- and five-year yields down 36 bps and 29 bps to 4.91% and 4.39%, respectively. Ten-year German bund yields more closely tracked their US peers, up 7 bps to 2.47%.
Sources: Bank of England, Bloomberg Index Services Limited, Federal Reserve, FTSE Fixed Income LLC, FTSE International Limited, Intercontinental Exchange, Inc., and Thomson Reuters Datastream.
Real Assets
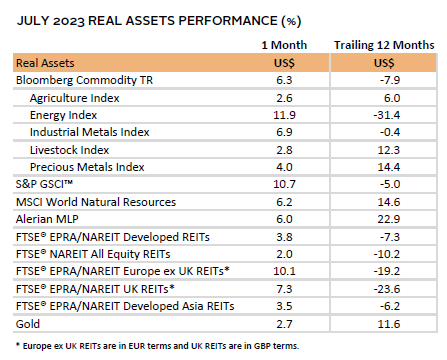
Real assets rallied in July. Momentum for certain categories had become depressed in recent months, with July’s performance reversing some YTD and trailing 12-month losses. Commodity futures excelled, boosted by energy and industrial metals prices, which remain among the year’s biggest laggards in terms of performance.
Oil prices ($85.56 for Brent and $81.80 for WTI) posted their strongest gains since January 2022, as Saudi Arabia extended a unilateral production cut and supply/demand dynamics are expected to turn to a deficit. The International Energy Agency expects a 2 million barrel/day deficit in third and fourth quarter 2023, with demand growth this year and next set to outstrip supply growth. US crude output has filled the gap somewhat and is on pace to hit record production this year at 12.6 million barrels/day.
Natural resources equities followed oil prices higher, out-performing broader equities. Still, recent commodity price malaise has weighed on earnings, with the energy and materials sectors reporting steep earnings per share declines for the second quarter.
REITs advanced but remain deeply in the red over the last 12 months. Europe ex UK REITs posted a double-digit return, while UK REITs also outperformed. These two regions have been among the most impacted by affordability concerns.
Gold prices advanced to $1,968.40/troy ounce. The yellow metal was supported by US dollar weakness and the potential for nearing a peak in central bank policy rates. The World Gold Council reported that gold demand rose 7% YOY in the second quarter.
Sources: Alerian, Bloomberg L.P., EPRA, FTSE International Limited, Intercontinental Exchange, Inc., MSCI Inc., National Association of Real Estate Investment Trusts, Standard & Poor’s, and Thomson Reuters Datastream. MSCI data provided “as is” without any express or implied warranties.
Note: Gold performance based on spot price return.
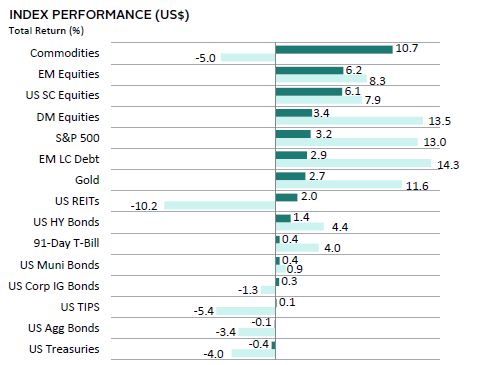
USD-Based Investors
Most asset classes rallied in July, reflecting a decidedly risk-on mood. EM and US small caps outperformed among equity markets, with the former boosted by a rebound in Chinese shares. High-yield corporate bonds outperformed other domestic fixed income assets, as credit spreads tightened to more than 20% below median levels. US Treasuries declined as the Fed raised rates once again and economic data exceeded expectations, pushing yields higher. Real assets rebounded, particularly commodities, as energy and industrial metals prices bounced from recent lows.
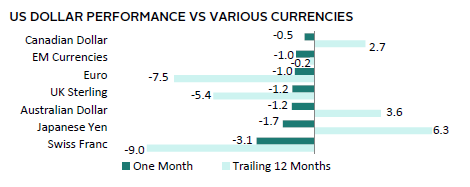
The US dollar was broadly weaker, falling the most versus the Swiss franc and Japanese yen, as the softer US inflation report and monetary policy dynamics raised the prospects for narrowing rate differentials. The greenback was more mixed over the past year, gaining versus commodity-linked DM currencies and the yen.
Economic data in July appeared to challenge the outlook for a US recession. GDP growth unexpectedly accelerated in the second quarter to 2.4% annualized, driven by consumer spending and an acceleration in business investment. Headline inflation slowed for a 12th straight month to 3.0% YOY in June, its lowest rate since March 2021. The Fed’s preferred core inflation gauge also decelerated more than expected to 4.1% YOY. Indeed, Fed Chair Powell noted that while Fed staff expect a slowdown, they no longer forecast a US recession, but the risk of higher inflation remains. However, several cracks emerged in more forward-looking data. The rejection rate for new loan applicants jumped to the highest level in five years, leading economic indicators fell for a 15th straight month, and composite PMI data came in below expectations in July as manufacturing activity remained in contraction.
Sources: Bloomberg Index Services Limited, FTSE International Limited, Frank Russell Company, Intercontinental Exchange, Inc., J.P. Morgan Securities, Inc., MSCI Inc., National Association of Real Estate Investment Trusts, Standard & Poor’s, and Thomson Reuters Datastream. MSCI data provided “as is” without any express or implied warranties.
EUR-Based Investors
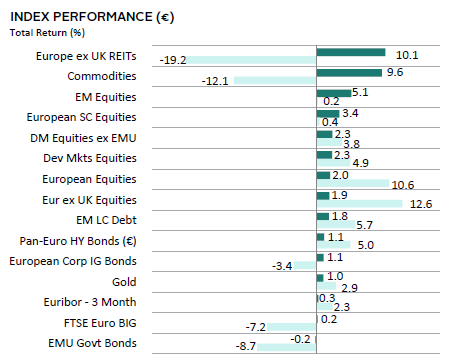
Most asset classes rallied in July, reflecting a decidedly risk-on mood. EM and European small caps outperformed among equity markets, with the former boosted by a rebound in Chinese shares. European shares trailed the broader developed index. High-yield and investment-grade corporate bonds outperformed government peers, as credit spreads tightened further. EMU government bonds declined as the ECB raised rates once again and core inflation held steady, pushing benchmark German bund yields higher across most tenors. Real assets rebounded, particularly REITs and commodities, as performance bounced from recent lows.
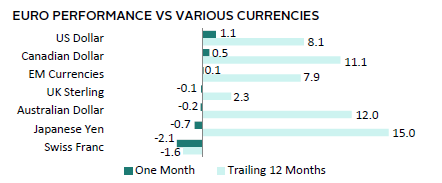
Euro performance was mixed, gaining the most versus the US and Canadian dollars, but declining the most versus the Swiss franc and Japanese yen. Still, the common currency broadly advanced over the past year as the ECB hiked rates, declining in value only versus the Swiss franc.
The Eurozone macro picture was largely mixed. The economy returned to growth in the second quarter, with GDP expanding 0.3% QOQ. However, the German economy stagnated following two quarters of contraction, as weak industrial activity offset a rebound in household spending. Inflation moderated to 5.3% YOY in July, but core inflation proved stickier than expected, holding steady at 5.5%. PMI data suggested that activity contracted for a second straight month in July, with German manufacturing at a nearly 40-month low. ECB lending data showed material tightening in credit conditions, as business loan demand fell to the weakest on record since 2003. Still, the ECB lifted its deposit facility rate to 3.75%, but shifted to a more “data-dependent” approach, implying a less hawkish stance.
Sources: Bloomberg Index Services Limited, EPRA, European Banking Federation, FTSE Fixed Income LLC, FTSE International Limited, Intercontinental Exchange, Inc., J.P. Morgan Securities, Inc., MSCI Inc., National Association of Real Estate Investment Trusts, Standard & Poor’s, and Thomson Reuters Datastream. MSCI data provided “as is” without any express or implied warranties.
GBP-Based Investors
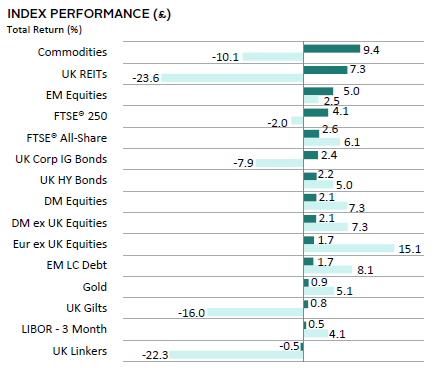
Most asset classes rallied in July, reflecting a decidedly risk-on mood. EM and UK mid caps outperformed among equity markets, with the former boosted by a rebound in Chinese shares. UK shares outperformed the broader DM index as slowing inflation lifted sentiment. Investment-grade and high-yield corporate bonds outperformed gilts and credit spreads tightened. Gilts still managed gains as the softer inflation print led to steeply lower BOE rate expectations. Real assets rebounded, particularly REITs and commodities, as performance bounced from recent lows.
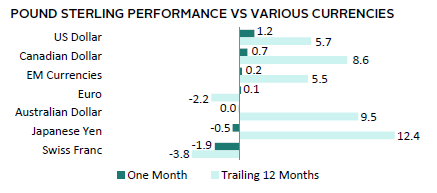
UK sterling performance was mixed, gaining the most versus their North American counterparts, but declining the most versus the safe-haven Swiss franc and Japanese yen. Still, the pound generally appreciated over the past year as the BOE tightened policy, declining versus only the Swiss franc and euro.
UK markets rallied as headline inflation slowed to 7.9% YOY in June versus 8.7% in May. While core inflation also moderated to just under 7%, it remained near a three-decade high. Markets repriced peak BOE rate expectations lower by 75 bps to around 5.75%, and raised the odds of a slower, 25-bp hike at the early August meeting. Despite the progress on inflation, wage growth accelerated at its fastest pace outside of the pandemic period and unemployment continued increasing, muddying the BOE’s policy calculus. Moreover, economic momentum slowed as July’s PMI data underwhelmed and consumer confidence dropped by the most in more than a year.
Sources: Bloomberg Index Services Limited, EPRA, FTSE International Limited, Intercontinental Exchange, Inc., J.P. Morgan Securities, Inc., MSCI Inc., National Association of Real Estate Investment Trusts, Standard & Poor’s, and Thomson Reuters Datastream. MSCI data provided “as is” without any express or implied warranties.
Performance Exhibits
All data are total returns unless otherwise noted. Total return data for all MSCI indexes are net of dividend taxes.
USD-Based Investors index performance chart includes performance for the Bloomberg US Aggregate Bond, Bloomberg US Corporate Investment Grade, Bloomberg US High Yield Bond, Bloomberg Municipal Bond, Bloomberg US TIPS, Bloomberg US Treasuries, ICE BofAML 91-Day Treasury Bills, FTSE® NAREIT All Equity REITs, J.P. Morgan GBI-EM Global Diversified, LBMA Gold Price, MSCI Emerging Markets, MSCI World, Russell 2000®, S&P 500, and S&P GSCI™ indexes.
EUR-Based Investors index performance chart includes performance for the Bloomberg Euro-Aggregate: Corporate, Bloomberg Pan-Euro High Yield (Euro), EURIBOR 3M, FTSE EMU Govt Bonds, FTSE Euro Broad Investment-Grade Bonds, FTSE® EPRA/NAREIT Europe ex UK RE, J.P. Morgan GBI-EM Global Diversified, LBMA Gold Price AM, MSCI Emerging Markets, MSCI Europe, MSCI Europe ex UK, MSCI Europe Small-Cap, MSCI World ex EMU, MSCI World, and S&P GSCI™ indexes.
GBP-Based Investors index performance chart includes performance for the Bloomberg Sterling Aggregate: Corporate Bond, Bloomberg Sterling Index-Linked Gilts, ICE BofAML Sterling High Yield, FTSE® 250, FTSE® All-Share, FTSE® British Government All Stocks, FTSE® EPRA/NAREIT UK RE, J.P. Morgan GBI-EM Global Diversified, LBMA Gold Price AM, LIBOR 3M GBP, MSCI Emerging Markets, MSCI Europe ex UK, MSCI World, MSCI World ex UK, and S&P GSCI™ indexes.
EM currencies is an equal-weighted basket of 20 emerging markets currencies.
Fixed Income Performance Table
Performance data for US TIPS reflect the Bloomberg US TIPS Index, with yields represented by the Bloomberg Global Inflation Linked Bond Index: US.