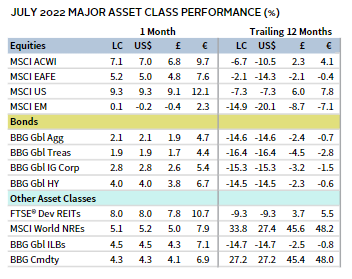
Risk assets rebounded in July as stocks rallied off recent bear market lows and bond yields ticked lower. Developed markets equities topped emerging markets peers by the widest margin since 1998. Growth trounced value, while small caps edged large caps. Global bonds gained the most in two years but remain deep in the red year-to-date; corporates topped government equivalents and riskier high-yield bonds returned the most. Real assets also gained, led by REITs. Among major currencies, the euro broadly sank, the US dollar mostly declined, and UK sterling was mixed.
Sources: Bloomberg Index Services Limited, Bloomberg L.P., EPRA, FTSE International Limited, MSCI Inc., National Association of Real Estate Investment Trusts, and Thomson Reuters Datastream. MSCI data provided “as is” without any express or implied warranties.
Note: Local currency returns for the Bloomberg fixed income indexes, the Bloomberg Commodity Index, and the FTSE® Developed REITs are in USD terms.
The Macro Picture
July’s market rebound was boosted by better-than-expected second quarter earnings results and signs that the Federal Reserve could slow the pace of interest rate increases sooner than anticipated. But the rally came against a backdrop of unabating inflation and slowing economic growth, as investors contend with deteriorating earnings forecasts and growing fears of a global recession.
Central banks ramped up monetary policy activity during the month as inflation readings in the US, Eurozone, and UK all reached the highest levels in at least several decades. The Fed hiked rates by another 75 basis points (bps), the European Central Bank (ECB) raised its benchmark policy rates for the first time since 2011, and the Bank of England (BOE) hinted at a potential half percentage point rate hike at its upcoming meeting.
The global economic growth outlook continues to worsen. The IMF slashed its growth forecasts across nearly all major developed regions and emerging markets for 2022 and 2023, emphasizing risks are overwhelmingly tilted to the downside. Indeed, the US has now experienced two consecutive quarters of negative GDP growth, which meets one common definition of an economic recession. Still, broader measures of economic activity, such as job growth and consumer spending, remained strong. In the Eurozone, GDP unexpectedly accelerated in second quarter, but a growing number of economists project the bloc will fall into a recession later this year.
Equities
US equities rallied in July, outperforming developed ex US counterparts for just the second time this year. Small caps bested large caps, and growth stocks outpaced value peers by the widest margin in 22 years, boosted by declining bond yields and better-than-expected consumer data. These dynamics were reflected in the underlying sector performance as growth-oriented sectors consumer discretionary and information technology were top performers, while value sectors such as consumer staples and healthcare gained the least; still, all 11 S&P 500 sectors advanced. Just over half of S&P 500 companies reported earnings results, indicating that blended second quarter corporate earnings per share grew at a rate of 6.0% year-over-year, topping estimates. However, when excluding the energy sector, EPS declined 4.2% year-over-year. Looking forward, analysts have lowered their third quarter earnings expectations during the first month of the quarter by more than the five-, ten-, 15-, and 20-year averages.
The US economy fell into a technical recession in second quarter as real GDP declined at a 0.9% annualized rate, according to the first official preliminary reading. Consumer spending—which makes up approximately 70% of the US economy—expanded, with spending on services more than offsetting weaker outlays on goods. Data released in July broadly supported this underlying strength as nominal retail sales advanced faster than expected, consumer sentiment surprised to the upside, and unemployment remained near generational lows. Still, risks abound as consumer and producer price inflation continued to accelerate, the services sector unexpectedly contracted in July, the housing market showed signs of cooling, and multiple regional Fed indexes indicated declining economic activity.
European equities advanced but trailed broad developed markets, due to US outperformance. Europe ex UK bested the UK for the first time this year. However, over the last 12 months the UK has outperformed by more than 20 percentage points and topped all major developed markets while Europe ex UK has lagged the most.
Eurozone GDP growth accelerated in second quarter according to preliminary data. But economic releases in July painted a bleaker picture, as retail sales growth slowed more than forecast, manufacturing unexpectedly contracted, and business and consumer surveys disappointed. In Germany, the Eurozone’s largest economy, retail sales declined by the largest year-over-year rate on record since 1994. Eurozone inflation reached a new all-time high as food and energy prices continued to soar due to the fallout from Russia’s invasion of Ukraine and COVID-19–related supply chain disruptions. Further exacerbating the situation, Russia halved natural gas deliveries to Europe via Nord Stream 1 to 20% capacity, prompting European Union members to reach a limited agreement to curtail gas demand. Rising price pressures influenced the ECB to discard its policy of forward guidance on rate hikes and raise benchmark interest rates by 50 bps—its first hike in over a decade.
UK inflation continued to tick higher as input prices rose faster than anticipated. BOE Governor Andrew Bailey noted that the central bank would consider a half percentage point rate hike in its August meeting, which would mark its largest increase since 1995. Economic data released in July were better than feared, as industrial production unexpectedly grew, retail sales outperformed expectations, and manufacturing and services sector PMIs remained firmly in expansionary territory.
Japanese equities gained in July but trailed broad developed markets. Japanese stocks are one of the top-performing major developed markets over the last 12 months in local currency terms, but in major currency terms the index is a bottom performer due to the yen’s historic weakness. The yen dipped further to a 24-year low against the US dollar amid the Bank of Japan’s (BOJ) ongoing ultra-loose monetary policy stance and has lost about 20% of its value vis-à-vis the US dollar over the past year. The BOJ announced in its July meeting that it would keep its benchmark interest rate steady and maintain its ultra-loose policy stance because underlying demand is too weak to tighten. The BOJ also updated its economic forecasts for the current fiscal year, which ends March 2023, lowering GDP and raising inflation estimates.
Pacific ex Japan equities advanced but were the bottom-performing region among major developed markets. New Zealand, Singapore, and Australia outperformed, while Hong Kong—the only developed market to decline in July—lagged. Hong Kong businesses and consumers faced headwinds from the central government’s tight COVID-19–related restrictions, leading the special administrative region to slip into its second recession in three years, as retail sales and exports struggled to rebound. In Australia, the unemployment rate declined more than expected to a nearly 50-year low, and the labor force participation rate jumped to a record high, amplifying the country’s labor shortage. Central banks for all four MSCI Pacific ex Japan markets tightened policy in July. Notably the Reserve Bank of New Zealand, which has generally been ahead of other central banks in hiking rates this cycle, raised rates by 50 bps for a third consecutive meeting following three consecutive quarter-point raises.
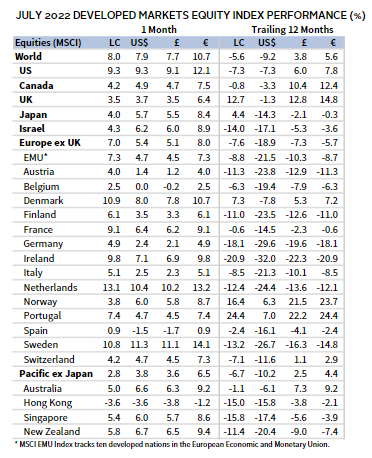
Sources: MSCI Inc. and Thomson Reuters Datastream. MSCI data provided “as is” without any express or implied warranties.
Emerging markets equities were effectively flat in July, trailing developed counterparts and most other asset classes. The broad market return was buffeted by China, which was the only country in the index to decline and is the bottom performer over the last 12 months. China’s large weight in the emerging Asia region caused the sub-index to lag, while emerging Europe, the Middle East & Africa (EMEA) and Latin America outpaced the broader index. All other major emerging markets countries outperformed, led by India, Saudi Arabia, and Korea. However, broad emerging markets stocks and bonds faced a fifth straight month of foreign investor outflows—a record since data began in 2005. The outflows mark a sharp reversal of late 2021 and early 2022 investor sentiment for a strong recovery from EM countries. But rising fears of a global recession, tightening central bank policy, fallout from untamed inflation, and China’s zero-COVID policy have curbed investor expectations.
China narrowly avoided negative year-over-year GDP growth, but the official 0.4% clip was much less than estimated as President Xi Jinping’s zero-COVID policy weighed on economic activity. However, on a quarter-on-quarter basis—similar to how other countries calculate GDP growth—the Chinese economy contracted in second quarter for the first time since the beginning of the pandemic. The People’s Bank of China held benchmark interest rates steady in July and announced a $148 billion loan program to support the beleaguered real estate industry. Authorities were pressured to act quickly to quell a growing mortgage payment revolt across the mainland and avoid social unrest.
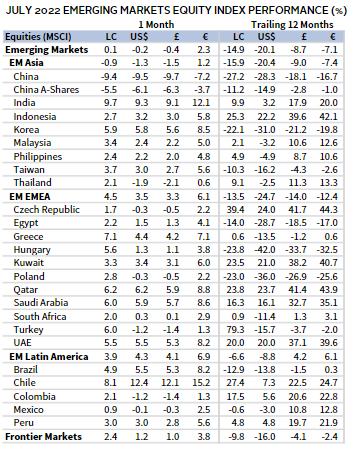
Sources: MSCI Inc. and Thomson Reuters Datastream. MSCI data provided “as is” without any express or implied warranties.
Fixed Income
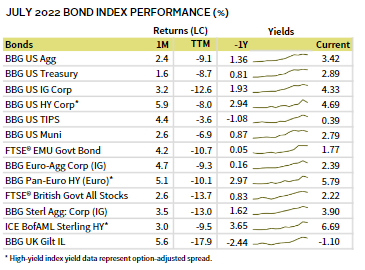
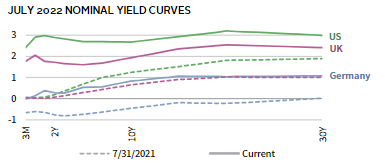
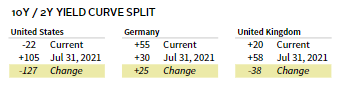
US fixed income securities broadly gained in July as bond yields declined and credit spreads tightened. High-yield corporates bested investment-grade equivalents, and Treasuries lagged but advanced. All three categories remain down steeply year-to-date. Five- and ten-year Treasury yields fell 31 bps each to 2.70% and 2.67%, respectively. The 10-year/2-year yield curve inverted early in the month and remained negative through the end of the month where it was at its deepest negative level since late 2000. US TIPS outperformed nominal Treasuries, as the ten-year real yield fell 51 bps to 0.14%—its largest decline since early 2009. Tax-exempt municipal bonds edged broad US investment-grade bonds.
Relative performance among euro-denominated bond categories was similar to that of their US counterparts. The ECB introduced a new policy instrument designed to avert a potential eurozone debt crisis by minimizing spreads between member-countries’ borrowing costs. Officials were rushed to finalize the new tool after Italy’s steep bond sell-off, which intensified after Prime Minister Mario Draghi resigned late in the month. Sterling-denominated bonds also gained across the board, as corporate investment-grade bonds topped high-yield corporate peers and gilts trailed. Five- and ten-year gilt yields fell 32 bps and 37 bps to 1.61% and 1.93%, respectively. Ten-year German bund yields fell 54 bps to 0.83%.
Real Assets
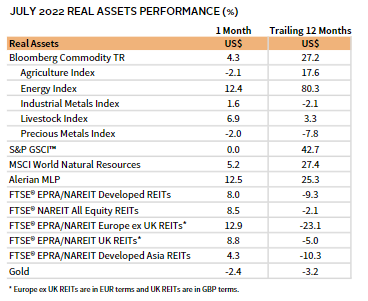
Energy commodities were mixed in July as differences in composition led to divergent performance among the major commodity futures benchmarks. According to the Bloomberg Commodity Index, energy once again outperformed, while precious metals and agriculture declined. Energy returns were buoyed by natural gas, which gained more than 50% and was the only underlying energy commodity to post a positive return.
Oil prices ($110.01 for Brent and $98.62 for WTI) fell for a second consecutive month on fears of a global economic slowdown, despite supply issues mounting from an embargo on most Russian oil imports. Manufacturing data from factories across Asia and Europe indicated slowing global demand for goods and thus weakening demand for oil.
Global natural resources equities and energy MLPs gained alongside broader stock markets. Several major international oil companies reported record windfall profits from the spike in energy prices in their second quarter earnings reports released in July. Blended earnings data for the S&P 500 energy sector showed a nearly 300% rise in profit and 70% increase in revenue year-over-year.
Global REITs also posted strong gains as government bond yields fell. Europe ex UK REITs advanced the most, UK REITs and US REITs also topped the broad index, and developed Asia REITs lagged.
Gold prices continued to tumble, ending the month at $1,764.24/troy ounce and are now down over the trailing 12-month period.
Sources: Alerian, Bloomberg L.P., EPRA, FTSE International Limited, Intercontinental Exchange, Inc., MSCI Inc., National Association of Real Estate Investment Trusts, Standard & Poor’s, and Thomson Reuters Datastream. MSCI data provided “as is” without any express or implied warranties.
Note: Gold performance based on spot price return.
USD-Based Investors
Nearly all asset classes advanced in July, as bond yields declined, and the economic outlook deteriorated. Equities were top performers, as US small caps outpaced large caps, and developed stocks bested emerging markets peers by more than 800 bps. US high-yield corporate bonds bested investment-grade equivalents, while nominal Treasuries lagged TIPS and municipals. US REITs rebounded and are one of the best-performing asset classes over the last 12 months. Gold was the bottom-performing asset class.
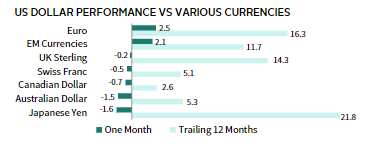
The US dollar mostly weakened, declining the most versus the beleaguered Japanese yen, and the Australian and Canadian dollars, and gaining only vis-à-vis the euro and our basket of EM currencies. Over the last 12 months, the greenback broadly appreciated, gaining the most versus the Japanese yen, euro, and UK sterling.
Just over half of S&P 500 companies reported earnings results, indicating that blended second quarter corporate EPS grew by 6.0% year-over-year, topping estimates. However, when excluding the energy sector, EPS declined 4.2% year-over-year. The US economy fell into a technical recession in second quarter as real GDP declined at a 0.9% annualized rate according to the first official preliminary reading. Consumer spending—which makes up approximately 70% of the US economy—expanded, with spending on services more than offsetting weaker outlays on goods. Data released in July broadly supported this underlying strength as nominal retail sales advanced faster than expected, consumer sentiment surprised to the upside, and unemployment remained near generational lows. Still, risks abound as consumer and producer price inflation continued to accelerate, the services sector unexpectedly contracted in July, the housing market showed signs of cooling, and multiple regional Fed indexes indicated declining economic activity.

Sources: Bloomberg Index Services Limited, FTSE International Limited, Frank Russell Company, Intercontinental Exchange, Inc., J.P. Morgan Securities, Inc., MSCI Inc., National Association of Real Estate Investment Trusts, Standard & Poor’s, and Thomson Reuters Datastream. MSCI data provided “as is” without any express or implied warranties.
EUR-Based Investors
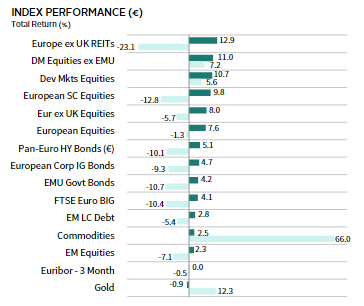
Nearly all asset classes advanced in July, as bond yields declined, and the economic outlook deteriorated. Equities were top performers, as developed ex EMU stocks outpaced European peers, and developed equities bested emerging markets peers by more than 800 bps. Pan-Euro high-yield corporate bonds edged investment-grade equivalents, while EMU government bonds lagged. Europe ex UK REITs were the top asset class this month but were the bottom performer over the trailing 12-month period. Gold was the only major asset class to decline.
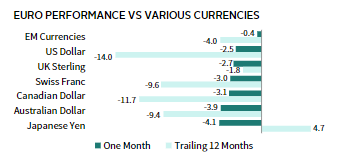
The euro broadly declined in July as the Eurozone reported economic weakness impacted by a worsening energy crisis. The euro devalued the most vis-à-vis the Japanese yen and the Australian and Canadian dollars and fell the least versus our basket of EM currencies, the US dollar, and UK sterling. The euro mostly declined over the trailing 12-month period, falling the most against the US and Canadian dollars and the Swiss franc, and gaining only vis-à-vis the Japanese yen.
Eurozone GDP growth accelerated in second quarter, but economic releases in July painted a bleaker picture, as retail sales growth slowed more than forecast, manufacturing unexpectedly contracted, and business and consumer surveys disappointed. Eurozone inflation reached a new all-time high as food and energy prices continued to soar. Further exacerbating the situation, Russia halved natural gas deliveries to Europe via Nord Stream 1 to 20% capacity, prompting European Union members to reach a limited agreement to curtail gas demand. Rising price pressures influenced the ECB to discard its policy of forward guidance on rate hikes and raise benchmark interest rates by 50 bps—its first hike in over a decade.
Bloomberg Index Services Limited, EPRA, European Banking Federation, FTSE Fixed Income LLC, FTSE International Limited, Intercontinental Exchange, Inc., J.P. Morgan Securities, Inc., MSCI Inc., National Association of Real Estate Investment Trusts, Standard & Poor’s, and Thomson Reuters Datastream. MSCI data provided “as is” without any express or implied warranties.
GBP-Based Investors
Nearly all asset classes advanced in July, as bond yields declined, and the economic outlook deteriorated. Equities were top performers, as UK mid caps outgained large caps, and developed stocks outpaced emerging markets peers by more than 800 bps. UK investment-grade bonds edged high-yield equivalents, while nominal gilts lagged linkers. UK REITs were the top asset class this month. Gold was the bottom performer this month, and commodities also declined on weaker economic outlook.
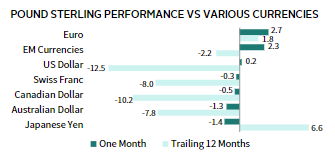
UK sterling mostly weakened, falling the most vis-à-vis the Japanese yen and Australian and Canadian dollars, and gaining versus the euro, our basket of EM currencies, and (marginally) the US dollar. Over the trailing 12-month period, sterling was mostly weaker, declining the most versus the US and Canadian dollars and the Swiss franc, while gaining only vis-à-vis the Japanese yen and euro.
UK inflation continued to tick higher as input prices rose faster than anticipated. BOE Governor Andrew Bailey noted that the central bank would consider a half percentage point rate hike in its August meeting, which would mark its largest increase since 1995. Economic data released in July were better than feared, as industrial production unexpectedly grew, retail sales outperformed expectations, and manufacturing and services sector PMIs remained firmly in expansionary territory. Former Prime Minister Boris Johnson resigned from his post in early July after heavy pressure from lawmakers over recent controversies. The ruling Conservative Party sent ballots to its members late in the month; the winner is expected to be announced on September 5.

Sources: Bloomberg Index Services Limited, EPRA, FTSE International Limited, Intercontinental Exchange, Inc., J.P. Morgan Securities, Inc., MSCI Inc., National Association of Real Estate Investment Trusts, Standard & Poor’s, and Thomson Reuters Datastream. MSCI data provided “as is” without any express or implied warranties.
Performance Exhibits
All data are total returns unless otherwise noted. Total return data for all MSCI indexes are net of dividend taxes.
USD-Based Investors index performance chart includes performance for the Bloomberg US Aggregate Bond, Bloomberg US Corporate Investment Grade, Bloomberg US High Yield Bond, Bloomberg Municipal Bond, Bloomberg US TIPS, Bloomberg US Treasuries, ICE BofAML 91-Day Treasury Bills, FTSE® NAREIT All Equity REITs, J.P. Morgan GBI-EM Global Diversified, LBMA Gold Price, MSCI Emerging Markets, MSCI World, Russell 2000®, S&P 500, and S&P GSCI™ indexes.
EUR-Based Investors index performance chart includes performance for the Bloomberg Euro-Aggregate: Corporate, Bloomberg Pan-Euro High Yield (Euro), EURIBOR 3M, FTSE EMU Govt Bonds, FTSE Euro Broad Investment-Grade Bonds, FTSE® EPRA/NAREIT Europe ex UK RE, J.P. Morgan GBI-EM Global Diversified, LBMA Gold Price AM, MSCI Emerging Markets, MSCI Europe, MSCI Europe ex UK, MSCI Europe Small-Cap, MSCI World ex EMU, MSCI World, and S&P GSCI™ indexes.
GBP-Based Investors index performance chart includes performance for the Bloomberg Sterling Aggregate: Corporate Bond, Bloomberg Sterling Index-Linked Gilts, ICE BofAML Sterling High Yield, FTSE® 250, FTSE® All-Share, FTSE® British Government All Stocks, FTSE® EPRA/NAREIT UK RE, J.P. Morgan GBI-EM Global Diversified, LBMA Gold Price AM, LIBOR 3M GBP, MSCI Emerging Markets, MSCI Europe ex UK, MSCI World, MSCI World ex UK, and S&P GSCI™ indexes.
EM currencies is an equal-weighted basket of 20 emerging markets currencies.
Fixed Income Performance Table
Performance data for US TIPS reflect the Bloomberg US TIPS Index, with yields represented by the Bloomberg Global Inflation Linked Bond Index: US.