Defensive and interest rate–sensitive assets generally outperformed in July as cracks in the global economic recovery emerged, driven in part by increasing Delta variant case counts. Still, global equities posted modest gains, advancing for the sixth consecutive month and reaching new all-time highs during the month; developed shares outperformed emerging equivalents on steep declines in China. Growth topped value, while large caps bested small caps for the fifth consecutive month. Fixed income assets advanced despite rising inflation, led by nominal government and inflation-linked bonds. Real assets were mostly positive as REITs and commodities outperformed. UK sterling topped the US dollar and the euro, but all three were mixed, depreciating versus safe-haven currencies and advancing vis-à-vis commodity-based currencies.
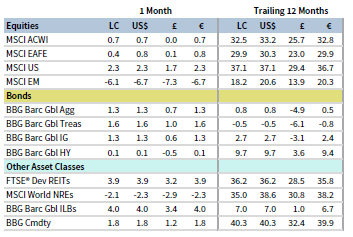
JULY 2021 MAJOR ASSET CLASS PERFORMANCE (%)
Sources: Bloomberg Index Services Limited, Bloomberg L.P., FTSE International Limited, MSCI Inc., and Thomson Reuters Datastream. MSCI data provided “as is” without any express or implied warranties.
Note: Local currency returns for the Bloomberg Barclays indexes, the Bloomberg Commodity Index, and the FTSE® Developed REITs are in USD terms.
The Macro Picture
Global equities posted modest gains in in July, but performance varied by region. While US and European equities churned higher, Chinese equities experienced a steep sell-off stemming from Beijing’s new regulatory tightening. Investors also grappled with ongoing uncertainty about the rapid rise of the contagious Delta variant. These challenges have sparked new questions about whether economic and earnings growth have already peaked and whether the pace of the recovery could moderate in forthcoming quarters.
Chinese regulators ramped up oversight across multiple sectors, including technology and private education. Major tech giants such as Alibaba and Tencent suffered sharp drawdowns, and a crackdown on the private education sector sent US-listed Chinese education stocks reeling. Regulators allayed fears somewhat by month-end, emphasizing that the measures were targeted for domestic issues and were not intended to sever ties with the US and global markets.
The spread of the Delta variant continues to cast a shadow over the economic recovery, particularly in regions where vaccination rates are lower, raising concerns that the economic recovery may abate. Even as equities reached new all-time highs, investors continued to flock to safe-haven bonds, sending US Treasury bond yields back to multi-month lows.
On the other side of the coin, inflationary pressures have revived concerns about the risk of economic overheating. Indeed, the recent pick-up in inflation above consensus forecasts has some economists questioning whether higher price increases will persist for longer than expected. But central banks continue to view the spike as temporary—and if not, they are prepared to step in to prevent runaway inflation.
Equities
US equities advanced for the sixth straight month, outperforming their developed ex US and emerging markets equivalents, and reaching new all-time highs. Nine of 11 S&P 500 Index sectors gained, led by the defensive and interest rate–sensitive health care, real estate, and utilities sectors, while energy and financials declined. Growth topped value, and large caps bested small caps for the fifth consecutive month; large caps now lead small caps year-to-date. Of S&P 500 companies, 59% have reported second quarter earnings, indicating a year-over-year earnings-per-share (EPS) growth rate of 85%—more than 20 percentage points (ppts) above expectations on June 30. Analysts have upgraded already-lofty calendar year 2021 earnings growth expectations to 41% as the percentage of companies beating EPS expectations (88%) is on pace to top the record set in first quarter.
Most major US economic data releases remained strong, as retail sales unexpectedly grew, non-farm payrolls rose more than expected, and private sector optimism reached its highest level in seven years. However, some economic data, though positive, failed to meet elevated expectations, raising fears that the speed of the economic expansion may have reached its peak. The first official GDP estimate for second quarter was much lower than expected at 6.5% annualized quarter-on-quarter, but reflected a slight acceleration from first quarter’s growth. Manufacturing PMI moved higher, but services PMI unexpectedly declined; however, both remained firmly in expansionary territory. Inflation continued its upward trend, raising concerns that rising prices may not be as transitory as the US Federal Reserve predicts. Still, at the end of its July meeting, the Fed unanimously approved a statement that the economy is continuing to strengthen and that progress has been made towards its employment and inflation goals.
European equities gained but underperformed broader developed markets due to US outperformance; European shares bested the developed ex US equity index. Europe ex UK topped UK counterparts for fifth time in the last six months. European corporate earnings growth accelerated 65% year-over-year based on just over half of the STOXX Europe 600 Index companies having reported. The large print is skewed higher by the energy sector, which has reported a more 300% EPS increase; excluding energy, STOXX Europe 600 Index company earnings grew 41%, less than half the growth seen in the United States.
Eurozone economic data continued to indicate a robust economic rebound. Composite PMIs rose further into expansionary territory, unemployment ticked down more than expected, and industrial confidence reached its highest level since data began in 1980. First quarter GDP rose at 2.0% quarter-on-quarter, higher than the consensus estimate. However, consumer confidence declined for the first time since January—as COVID-19 cases rose across the Continent—but remains near pre-pandemic levels. Inflation ticked up to 2.2% in July—the first time it has surpassed the European Central Bank’s (ECB) newly set 2.0% target (previously, the ECB had used the wording “below but close to 2%”) in almost three years—as the central bank vowed to persist with negative interest rates until the Eurozone economy breaks free from its pattern of sluggish inflation.
In the United Kingdom, manufacturing and services PMIs declined in July—but remain firmly expansionary—and retail sales increased in June after a decline in May. Price inflation accelerated in June, touching its highest level in nearly three years as Bank of England (BOE) officials debated how to mitigate the risk of runaway inflation without cutting off the recovery.
Japanese equities declined and trailed broader developed stocks for the third time in the last four months. Japanese stocks have returned the least year-to-date among major developed regions. The Olympic games opened in Tokyo to no crowds as rising Delta variant cases across the country led government authorities to expand state of emergency restrictions. The Bank of Japan (BOJ) cut its current fiscal year growth outlook slightly to 3.8%, but maintained its view that the economy was headed for a moderate recovery. The BOJ kept its benchmark overnight interest rate at -0.1%, and announced plans to introduce a climate support scheme later this year in which it will offer zero-interest loans and reduce the amount of reserves subject to negative rates for banks that provide loans for carbon emission reduction over other projects.
Pacific ex Japan equities were flat in July, trailing broader developed markets for the fifth time in the last six months. Declines in Hong Kong and New Zealand were mostly offset by gains in Australia and Singapore. Increasing fissures between the United States and China weighed on the special administrative region’s performance as US President Joe Biden’s administration warned that US businesses operating in Hong Kong face significant and rising risks from mainland China’s increasing control over the city. Australia advanced despite Sydney, the country’s largest economic engine, extending the late-June lockdown throughout the full month of July to quell an outbreak of the Delta variant. As a result, some Australian banks slashed economic growth expectations for third quarter and are now predicting negative GDP growth.
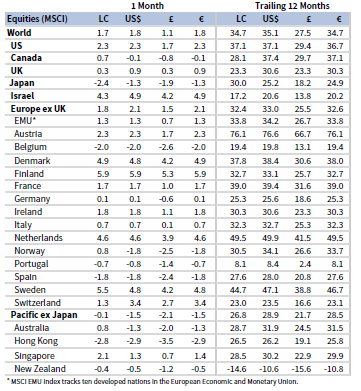
JULY 2021 DEVELOPED MARKETS EQUITY INDEX PERFORMANCE (%)
Sources: MSCI Inc. and Thomson Reuters Datastream. MSCI data provided “as is” without any express or implied warranties.
Emerging markets equities declined and trailed developed markets peers for the fifth time since January, bringing year-to-date underperformance to 14.7 ppts. Chinese stocks weighed on the market, as the MSCI China Index experienced its worst monthly decline since 2011. The double-digit fall stemmed from both actual and perceived threats to Chinese tech firms from the central government. Early in the month, China’s internet regulator announced an investigation into Didi Chuxing just days after its IPO on the New York Stock Exchange that prevented the firm’s popular ride-hailing app from expanding its customer base. Later in the month, authorities released guidance affecting Chinese education companies and after-school tutoring services, which effectively prevents such firms from making a profit. The massive sell-off that ensued was felt across all industries, as investors considered political risks from China’s growing assertiveness over domestic firms large and small alike. Given the rising issues, the US Securities and Exchange Commission temporarily halted IPOs of Chinese companies in the United States, which had risen dramatically in recent years.
Emerging Europe, the Middle East & Africa advanced, while Latin America and emerging Asia declined; however, in major currency terms, all three regions either declined or were flat. Among major emerging countries, India and South Africa advanced; Taiwan, Korea, and Brazil declined but outperformed the broad index; and China trailed and declined the most. South Korea’s economy grew at its fastest year-over-year rate in a decade in second quarter. Samsung Electronics, which makes up about a third of the MSCI Korea Index and is the world’s second-largest semiconductor foundry, reported strong demand amid the global chip shortage. Still, a jump in COVID-19 cases in July (significantly above previous highs set at the end of last year) weighed on the country’s outlook.
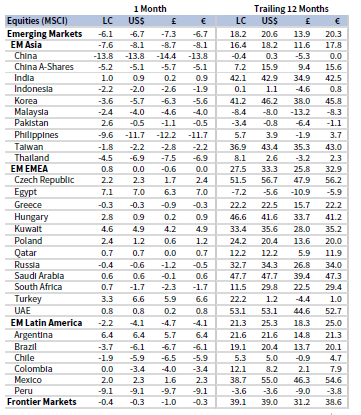
JULY 2021 EMERGING MARKETS EQUITY INDEX PERFORMANCE (%)
Sources: MSCI Inc. and Thomson Reuters Datastream. MSCI data provided “as is” without any express or implied warranties.
Fixed Income
US fixed income broadly gained in July as yields declined despite accelerating price inflation. Investment-grade bonds outperformed high-yield equivalents, as Treasuries and investment-grade corporates experienced equivalent returns. Five- and ten-year Treasury yields declined 18 basis points (bps) and 21 bps to 0.69% and 1.24%, respectively. Longer-term 30-year Treasury yields declined 17 bps to dip below 2.00% for the first time since January. The ten-year/two-year Treasury yield curve spread fell below 100 bps during the month for the first time since the beginning of February, while ten-year real yields declined to their lowest level on record. TIPS topped nominal Treasuries and ten-year breakeven inflation rose 8 bps to 2.40%. Tax-exempt municipal bonds advanced but trailed domestic Treasuries.
UK and Eurozone bonds followed a similar pattern as the United States, with investment-grade bonds besting high-yield peers; however, government bonds topped investment-grade corporates in both the United Kingdom and the Eurozone. UK linkers gained the most among fixed income categories. Five- and ten-year Gilt yields declined 8 bps and 17 bps to 0.29% and 0.65%, respectively. Ten-year German bund yields fell 26 bps to -0.46%, while peripheral yields also declined, continuing a reversal from mid-May.
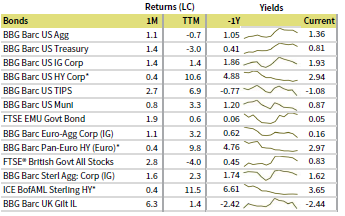
JULY 2021 BOND INDEX PERFORMANCE (%)
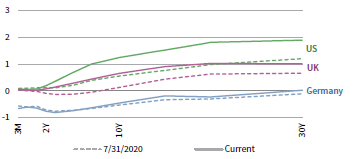
JULY 2021 NOMINAL YIELD CURVES
10Y/2Y YIELD CURVE SPLIT
* High-yield index yield data represent option-adjusted spread.
Sources: Bank of England, Bloomberg Index Services Limited, BofA Merrill Lynch, Federal Reserve, FTSE Fixed Income LLC, FTSE International Limited, Intercontinental Exchange, Inc., and Thomson Reuters Datastream.
Real Assets
Commodity futures advanced in July, led by energy and industrial metals. Among industrial metals, copper remained below all-time highs hit in May, but tin prices reached a new record on bets that Delta variant–related disruptions in southeast Asia could create new shortages for the malleable metal.
Oil prices ($76.33 for Brent and $73.95 for WTI) each advanced modestly to their highest levels in about three years. Oil prices have climbed roughly 50% year-to-date through July, the best seven-month calendar year performance since 2008. The price increases came even as OPEC+ members announced plans boost output by 400,000 barrels a day per month, committing to restore all of the deep cuts made at the start of the pandemic gradually through late 2022. Analysts expect that price levels could continue to rise as increased demand is likely to continue to outpace the gradual nature of the output boost.
Global natural resources equities and MLPs fell, with the latter experiencing its first monthly decline in almost a year. Despite the decline, both remain firmly positive over the last year, with the Alerian MLP Index leading all real assets with a return of nearly 60% over the last 12 months.
Global developed REITs topped the broader equity market in July, led by UK REITs, Europe ex UK REITs, and US REITs; developed Asia REITs declined.
Gold prices rose to $1,823.24/troy ounce amid signs of risk-off sentiment. Still, the yellow metal’s performance remains negative over the trailing 12-month period.
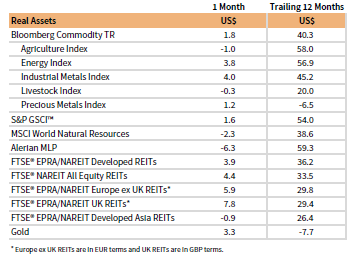
JULY 2021 REAL ASSETS PERFORMANCE (%)
Sources: Alerian, Bloomberg L.P., EPRA, FTSE International Limited, Intercontinental Exchange, Inc., MSCI Inc., National Association of Real Estate Investment Trusts, Standard & Poor’s, and Thomson Reuters Datastream. MSCI data provided “as is” without any express or implied warranties.
Notes: Total return data for all MSCI indexes are net of dividend taxes. Gold performance based on spot price return.
USD-Based Investors
Defensive and interest rate–sensitive assets generally outperformed in July as cracks in the global economic recovery emerged, driven in part by increasing Delta variant case counts. Real assets topped performance, led by US REITs. Gold was also a top performer on the month but declined the most over the past 12 months. US large caps bested all other major equity categories, while US small caps and emerging markets stocks underperformed. Still, small caps were one of the top performers over the past year, trailing only commodities on a trailing 12-month basis. Corporate investment-grade bonds and nominal Treasuries bested high-yield equivalents. TIPS outgained other fixed income assets, reflecting the risk-off and inflationary environment as real yields touched all-time lows.
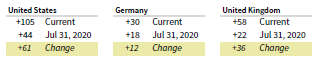
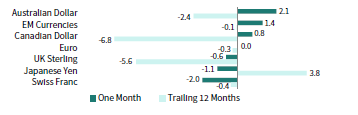
The US dollar was mixed in July, advancing the most versus commodity-linked currencies Australian dollar, emerging markets currencies, and Canadian dollar, and falling the most vis-à-vis safe-haven currencies Swiss franc and Japanese yen. The greenback generally weakened over the past year, declining the most against the Canadian dollar, UK sterling, and Australian dollar, and gaining versus only the Japanese yen.
Most major US economic data releases remained strong. While most economic data were positive, some failed to meet lofty expectations, raising fears that the speed of the economic expansion may have reached its peak. Inflation continued its upward trend, prompting concerns that rising prices may not be as transitory as the Fed predicts. The first official GDP estimate for second quarter was much lower than expected at 6.5% annualized quarter-on-quarter, but it reflected a slight acceleration from first quarter’s growth. Manu-facturing PMI moved higher, but services PMIs unexpectedly declined; however, both remained firmly in expansionary territory.
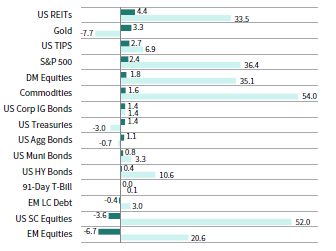
INDEX PERFORMANCE (US$)
US DOLLAR PERFORMANCE VS VARIOUS CURRENCIES
Sources: Bloomberg Index Services Limited, FTSE International Limited, Frank Russell Company, Intercontinental Exchange, Inc., J.P. Morgan Securities, Inc., MSCI Inc., National Association of Real Estate Investment Trusts, Standard & Poor’s, and Thomson Reuters Datastream. MSCI data provided “as is” without any express or implied warranties.
EUR-Based Investors
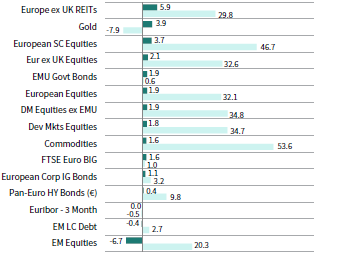
Defensive and interest rate–sensitive assets generally outperformed in July as cracks in the global economic recovery emerged, driven in part by increasing Delta variant case counts. Real assets topped performance, led by Europe ex UK REITs. Gold was also a top performer on the month, but declined the most over the past 12 months. European small caps bested all other major equity categories, while Europe ex UK equities topped broad developed markets equivalents. Emerging markets stocks were the bottom performers and now trail developed markets peers by 14.4 ppts over the past 12 months. EMU government bonds and corporate investment-grade bonds bested high-yield equivalents.
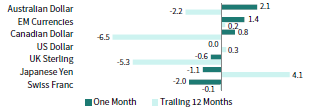
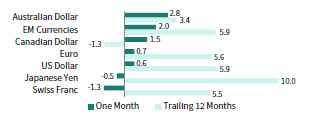
The euro was mixed in July, advancing the most versus commodity-linked currencies Australian dollar, EM currencies, and Canadian dollar, and falling the most vis-à-vis safe-haven currencies Swiss franc and Japanese yen. The common currency was also mixed over the past year but experienced more significant changes to the downside than upside, declining significantly versus the Canadian dollar, UK sterling, and Australian dollar, while gaining significantly vis-à-vis only the Japanese yen.
Eurozone economic data continued to indicate a robust economic rebound. Composite PMIs expanded further into expansionary territory, unemployment ticked down more than expected, and industrial confidence reached its highest level since data began in 1980. First quarter GDP rose 2.0% quarter-on-quarter, higher than the consensus estimate. However, consumer confidence declined for the first time since January—as COVID-19 cases rose across the Continent—but remains near pre-pandemic levels. Inflation ticked up to 2.2% in July—the first time it has surpassed the ECB’s 2.0% target in almost three years—as the central bank vowed to persist with negative interest rates until the Eurozone economy breaks free from its pattern of sluggish inflation.
INDEX PERFORMANCE (€)
EURO PERFROMANCE VS VARIOUS CURRENCIES
Sources: Bloomberg Index Services Limited, EPRA, European Banking Federation, FTSE Fixed Income LLC, FTSE International Limited, ICE Benchmark Administration Ltd., J.P. Morgan Securities, Inc., MSCI Inc., National Association of Real Estate Investment Trusts, Standard & Poor’s, and Thomson Reuters Datastream.
GBP-Based Investors
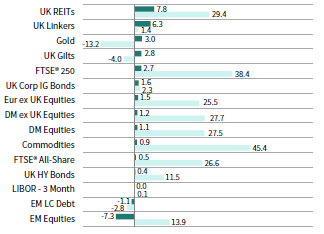
Defensive and interest rate–sensitive assets generally outperformed in July as cracks in the global economic recovery emerged, driven in part by increasing Delta variant case counts. Real assets topped performance, led by UK REITs. Gold was also a top performer on the month but declined the most over the past 12 months. UK mid caps bested all other major equity categories, while UK large caps trailed developed markets peers. Emerging markets stocks were the bottom performers, and now trail developed markets peers by 13.6 ppts over the past 12 months. Nominal gilts and corporate investment-grade bonds bested high-yield equivalents. UK Linkers outgained other fixed income assets, reflecting the risk-off and inflationary environment.
UK sterling was mostly positive in July, falling versus only safe-haven currencies Swiss franc and Japanese yen; sterling rose the most vis-à-vis commodity-linked currencies Australian dollar, EM currencies, and Canadian dollar. Over the past 12 months, sterling is mostly positive, declining only versus the Canadian dollar.
Manufacturing and services PMIs declined in July—but remain firmly expansionary—and retail sales unexpectedly increased in June after a decline in May. Price inflation accelerated in June, touching its highest level in nearly three years as BOE officials debated how to mitigate the risk of runaway inflation without cutting off the recovery.
INDEX PERFORMANCE (£)
POUND STERLING PERFORMANCE VS VARIOUS CURRENCIES
Sources: Bloomberg Index Services Limited, EPRA, FTSE International Limited, Intercontinental Exchange, Inc., ICE Benchmark Administration Ltd., J.P. Morgan Securities, Inc., MSCI Inc., National Association of Real Estate Investment Trusts, Standard & Poor’s, and Thomson Reuters Datastream.
Performance Exhibits
All data are total returns unless otherwise noted. Total return data for all MSCI indexes are net of dividend taxes.
USD-Based Investors index performance chart includes performance for the Bloomberg Barclays US Aggregate Bond, Bloomberg Barclays US Corporate Investment Grade, Bloomberg Barclays US High Yield Bond, Bloomberg Barclays Municipal Bond, Bloomberg Barclays US TIPS, Bloomberg Barclays US Treasuries, ICE BofAML 91-Day Treasury Bills, FTSE® NAREIT All Equity REITs, J.P. Morgan GBI-EM Global Diversified, LBMA Gold Price, MSCI Emerging Markets, MSCI World, Russell 2000®, S&P 500, and S&P GSCI™ indexes.
EUR-Based Investors index performance chart includes performance for the Bloomberg Barclays Euro-Aggregate: Corporate, Bloomberg Barclays Pan-Euro High Yield (Euro), EURIBOR 3M, FTSE EMU Govt Bonds, FTSE Euro Broad Investment-Grade Bonds, FTSE® EPRA/NAREIT Europe ex UK RE, J.P. Morgan GBI-EM Global Diversified, LBMA Gold Price AM, MSCI Emerging Markets, MSCI Europe, MSCI Europe ex UK, MSCI Europe Small-Cap, MSCI World ex EMU, MSCI World, and S&P GSCI™ indexes.
GBP-Based Investors index performance chart includes performance for the Bloomberg Barclays Sterling Aggregate: Corporate Bond, Bloomberg Barclays Sterling Index-Linked Gilts, ICE BofAML Sterling High Yield, FTSE® 250, FTSE® All-Share, FTSE® British Government All Stocks, FTSE® EPRA/NAREIT UK RE, J.P. Morgan GBI-EM Global Diversified, LBMA Gold Price AM, LIBOR 3M GBP, MSCI Emerging Markets, MSCI Europe ex UK, MSCI World, MSCI World ex UK, and S&P GSCI™ indexes.
EM currencies is an equal-weighted basket of 20 emerging markets currencies.
Fixed Income Performance Table
Performance data for US TIPS reflect the Bloomberg Barclays US TIPS Index, with yields represented by the Bloomberg Barclays Global Inflation Linked Bond Index: US.