Global risk assets advanced in July, extending the prolonged market rally that began in late March. Emerging markets equities surged and outperformed developed markets equivalents. Global growth stocks trounced value, while large caps outpaced small caps. High-yield and investment-grade corporate bonds continued to outperform sovereigns. Real assets mostly advanced; oil prices ticked higher and precious metals surged, as gold reached all-time highs. The US dollar steeply declined in its worst month since 2010, while the euro and UK sterling broadly appreciated.

JULY 2020 MAJOR ASSET CLASS PERFORMANCE (%)
Sources: Bloomberg Index Services Limited, Bloomberg L.P., FTSE International Limited, MSCI Inc., and Thomson Reuters Datastream. MSCI data provided “as is” without any express or implied warranties.
Note: Local currency returns for the Bloomberg Barclays indexes, the Bloomberg Commodity Index, and the FTSE® Developed REITs are in USD terms.
The Macro Picture
Risk appetite remained strong during the month, despite a global resurgence in coronavirus cases. Investors shrugged off unprecedented second quarter GDP declines, focusing instead on the steadfast support from global central banks and governments, along with relatively “better-than-feared” earnings results. US real GDP collapsed 9.5% quarter-on-quarter, representing the worst decline in the postwar era. Eurozone and German GDP fared even worse, with 12.1% and 10.1% downturns, respectively. Despite these massive declines, investors have shifted focus to higher-frequency indicators for signs of nascent economic recovery. However, some data began to reflect the negative impact of the renewed spike in virus cases, dimming optimism for a V-shaped recovery.
The US Federal Reserve left rates unchanged and reaffirmed its commitment to supporting the economy. EU leaders agreed on a landmark €1.82 trillion budget and recovery package, representing an unprecedented step toward fiscal integration. Investors have now turned attention to US lawmakers, who continue to negotiate another round of fiscal stimulus, but the details of enhanced unemployment benefits remain a major sticking point for both parties.
Better-than-feared earnings results also helped drive equities higher in July. Nearly two-thirds of S&P 500 companies reported second quarter earnings, and a record number have surprised to the upside, albeit from deeply negative expectations. Big tech, including some of the largest companies in the world by market cap, trounced expectations as the pandemic accelerated reliance on technology for online shopping, working, socializing, and learning.
Equities
US equities outperformed their developed ex US counterparts and turned positive year-to-date. US stocks have retraced 90% of their peak-to-trough drawdown, gaining 46.2% since the March 23 low, and are just 3.4% below their all-time high reached on February 19. Ten of 11 S&P 500 sectors advanced, led by consumer discretionary, utilities, and materials; energy was the only sector to decline. Large caps topped small caps, while growth stocks’ dominance over value continued. Over the past year growth has outperformed value by nearly 40 percentage points, the widest margin since data began in 1975. The tech-heavy Nasdaq Composite Index reached new record highs in July, as leading tech firms reported strong second quarter earnings results. More broadly, with about two-thirds of S&P 500 companies reporting, blended second quarter US corporate earnings are estimated to have declined 36%, which would be the largest year-over-year fall since 2008. However, 84% of companies reported a positive earnings per share (EPS) surprise, the highest percentage since FactSet began tracking the metric in 2008.
US second quarter GDP declined at a 32.9% annualized rate, better than expected but the steepest decline on record. Weekly initial unemployment claims rose late in the month, reversing 15 consecutive weeks of declines since its March all-time high. US purchasing managers index (PMI) readings were mixed, as manufacturing PMI turned expansionary, but services data indicated an extended contraction due to lackluster demand and renewed lockdowns. The Fed left rates unchanged and reinforced its support for economic recovery. The Fed also extended its lending programs and dollar swap lines to various central banks through year end. Chairman Jerome Powell continued to emphasize the need for additional fiscal stimulus, although Congress remained deadlocked on terms of the next coronavirus relief bill.
European equities trailed broader developed markets stocks in July, as Europe ex UK bested UK shares. With about half of Stoxx 600 companies reporting, second quarter year-on-year EPS growth stands at -23%; excluding energy companies, the reading improves to -10%. The European Central Bank reported second quarter preliminary Eurozone GDP estimate at -12.1% (-40.3% annualized), by far the sharpest decline since data began in 1995 and slightly worse than anticipated. On a more positive note, the euro area recorded its first expansionary manufacturing PMI reading in 18 months in July, as demand and output continued to recover amid further easing of restrictions on economic activity.
EU leaders agreed to a new seven-year budget of nearly €1.1 trillion, along with a €750 billion COVID-19 recovery fund. While the size of the recovery fund (about 5.4% of GDP, to be disbursed over several years) is not massive in comparison to fiscal packages delivered in other major economies, or even at a domestic level in Europe, the proposed joint issuance of €750 billion worth of “Eurobonds” heralds the first meaningful breaking of the debt-mutualization taboo. Meanwhile, the EU’s chief Brexit negotiator, Michel Barnier, said that a new deal with Britain was still possible, even as the latest round of EU-UK negotiations concluded with Brussels saying an agreement with London was unlikely.
Japanese equities declined and trailed other major developed markets. Second quarter year-on-year Topix EPS growth sits at -16%, but only about one quarter of companies have reported. Despite Japan’s relatively low number of COVID-19 cases, a new resurgence at the end of July raised concerns that it may be in for another round of lockdowns. Moreover, economic data remains bleak as July manufacturing and services PMIs remained firmly in contractionary territory, hiring intentions weakened to their lowest level in eight years, and capital expenditure plans declined to lows last seen in 2009. The Bank of Japan kept monetary policy on hold with its benchmark overnight interest rate at -0.1% and ten-year bonds capped at around zero and noted it would “not hesitate to take additional easing measures if necessary.”
Emerging markets equities outperformed developed peers, supported by a weakening US dollar. Heavily weighted emerging Asia outgained the broader index, while Latin America and emerging Europe, the Middle East & Africa lagged; however, in major currency terms, Latin America was the top-performing region on the relative strength of the Brazilian real and Chilean peso. Among major EM markets, Taiwan, India, and China outperformed, while Brazil, Korea, and South Africa trailed. In USD terms, Brazil outperformed as the real gained 5.5% vis-à-vis the US dollar. Emerging markets experienced a second consecutive month of positive net investment inflows underpinned by a weaker dollar and loose US monetary policy. Frontier markets lagged developed and emerging counterparts as Kuwait and Vietnam, which constitute more than half of the index, both declined.
US-China tensions escalated throughout July. The United States imposed sanctions on several senior officials in China’s Xinjiang region related to human rights violations and then ordered China to close its consulate in Houston, alleging that the site was used as a base for intellectual property theft. China later ordered an American consulate in Chengdu to shutter in a retaliatory measure. The rising tensions further raised doubts regarding the Phase One trade deal, and lowered optimism for future cooperation. Despite these growing concerns, domestic China A-shares experienced strong gains as China continued its recovery from the COVID-19 induced economic crisis. Chinese economic data were mostly positive. Second quarter GDP (3.2% year-over-year) grew faster than expected, industrial output growth continued its recovery, and manufacturing and services PMIs firmed further into expansionary territory. However, domestic retail sales unexpectedly declined.
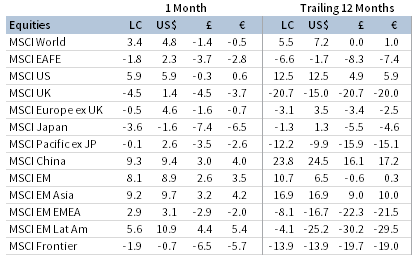
JULY 2020 EQUITY INDEX PERFORMANCE (%)
Sources: MSCI Inc. and Thomson Reuters Datastream. MSCI data provided “as is” without any express or implied warranties.
Fixed Income
Credits, led by high-yield corporates, outperformed sovereign counterparts in July as credit spreads narrowed amid improving corporate outlook, albeit from a low base. US Treasuries modestly advanced as yields fell to record (or near-record) lows across the entire yield curve; ten-year and five-year yields declined 11 bps and 8 bps to 0.55% and 0.21%, respectively. Two- and five-year Treasury yields finished the month at new all-time daily lows, and Treasury bond volatility (as measured by the ICE BofAML MOVE Index) fell to a record low as the Fed reaffirmed its intentions to keep its benchmark interest rate near-zero for the foreseeable future. The ten-year/two-year yield spread narrowed to 44 bps. TIPS outperformed nominal Treasuries, pushing real yields deeper into negative territory across the yield curve, with ten-year real yields reaching -1.00% by the end of the month. Tax-exempt municipal bonds continued their rebound, besting nominal US government bonds.
Relative performance for sterling- and euro-denominated bonds mirrored their US counterparts.Ten- and five-year gilt yields declined 7 bps apiece to 0.12% and -0.13%, respectively; ten-year German bund yields also declined 7 bps to -0.53%. The Italian/German ten-year bond spread declined to levels last observed prior to the COVID-19 driven economic crisis as governments continued to ease lockdown measures and economic activity improved. UK linkers edged nominal gilts.
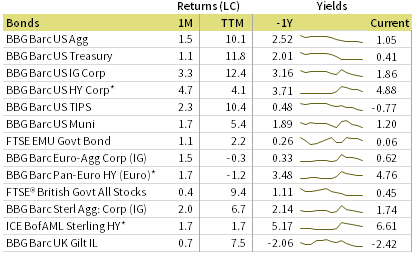
JULY 2020 BOND INDEX PERFORMANCE (%)

JULY 2020 NOMINAL YIELD CURVES

10Y/2Y YIELD CURVE SPLIT
* High-yield index yield data represent option-adjusted spread.
Sources: Bank of England, Bloomberg Index Services Limited, BofA Merrill Lynch, Federal Reserve, FTSE Fixed Income LLC, FTSE International Limited, Intercontinental Exchange, Inc., and Thomson Reuters Datastream.
Real Assets
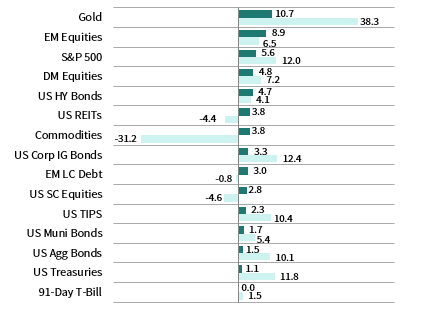
Commodity futures advanced, led by industrial and precious metals.
Oil prices ($43.30 for Brent and $40.27 for WTI) slightly advanced, touching their highest levels since March, but remain stuck near $40 per barrel, wedged between coronavirus fears and improving fundamentals. Price gains were curbed in July by lingering demand concerns and easing production cuts. OPEC output rose by more than one million barrels a day as gulf countries ended their voluntary extra supply cuts and some member states made limited progress on compliance with the earlier OPEC+ supply curb deal.
Global natural resources equities slightly gained, and MLPs declined as investors grappled with what low oil prices may mean for future pipeline activity.
Global developed REITs advanced, led by US REITs; UK REITs and Europe ex UK also gained, but underperformed the broader market, while Asia REITs declined.
Gold prices ($1,975.10 per troy ounce) surged, reaching all-time highs. The metal is the top-performing major asset this year as investment demand continues to surge, boosted by the weakening US dollar, negative real interest rates, and fears of rising inflation.

JULY 2020 REAL ASSETS PERFORMANCE (%)
* Europe ex UK REITs are in EUR terms and UK REITs in GBP terms.
Sources: Alerian, Bloomberg L.P., EPRA, FTSE International Limited, Intercontinental Exchange, Inc., MSCI Inc., National Association of Real Estate Investment Trusts, Standard & Poor’s, and Thomson Reuters Datastream. MSCI data provided “as is” without any express or implied warranties.
Notes: Total return data for all MSCI indexes are net of dividend taxes. Gold performance based on spot price return.
USD-Based Investors
Gold advanced to all-time nominal high prices in July. The yellow metal, widely seen as a safe-haven asset, has handily outperformed all major assets in the past 12 months.
Risk assets, led by equities and high-yield bonds, gained in July despite a resurgence in COVID-19 cases and reimplementation of tighter restrictions in many locations across the country.
Equities have continued to churn higher since March. In fact, the S&P 500 is now positive year-to-date, despite suffering a 34% decline from February’s all-time high to the market crash low reached in March. US equities bested developed ex US, and US large caps topped domestic small caps. However, emerging markets stocks were the top performer among equities in July, outpacing developed counterparts, and supported in part by a weaker US dollar. High-yield and investment-grade corporate bonds outperformed Treasuries as yields across the curve declined to record or near-record lows. The Fed reaffirmed its commitment to keep its benchmark lending rate near zero for the foreseeable future.
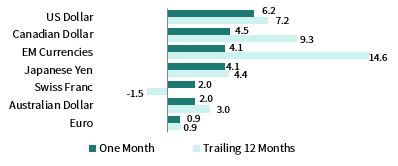
The US dollar experienced its worst monthly sell-off since 2010, falling the most versus UK sterling, the euro, and the Australian dollar. Reversing its recent strength, the US dollar has now depreciated versus most major currencies over the past year, appreciating only vis-à-vis an equal-weighted basket of emerging markets currencies and the Canadian dollar.
The Fed left rates unchanged and reinforced its support for economic recovery. It also extended its lending programs and dollar swap lines to various central banks through year-end.
INDEX PERFORMANCE (US$)

US DOLLAR PERFORMANCE VS VARIOUS CURRENCIES
Sources: Bloomberg Index Services Limited, FTSE International Limited, Frank Russell Company, Intercontinental Exchange, Inc., J.P. Morgan Securities, Inc., MSCI Inc., National Association of Real Estate Investment Trusts, Standard & Poor’s, and Thomson Reuters Datastream. MSCI data provided “as is” without any express or implied warranties.
EUR-Based Investors
Gold was the top-performing asset, although the recent euro strength has been a headwind for euro-based investors. Emerging markets equities and corporate bonds gained as European countries eased lockdown restrictions and economic activity shifted to expansionary territory in July.
Emerging markets equities outgained developed counterparts, and European small caps topped European equities, which declined. High-yield and investment-grade corporate bonds outpaced EMU government bonds despite mounting corporate financial stress. Commodities prices declined, weighed down by a weaker US dollar (commodities are priced in USD terms).
The euro broadly strengthened in July, appreciating the most versus the US dollar and Canadian dollars, an equal-weighted basket of emerging markets currencies, and the Japanese yen; the common currency declined only vis-à-vis UK sterling. Euro performance was similar over the past 12 months, declining only vis-à-vis the Swiss franc and UK sterling. Much of the euro’s recent strength versus the dollar can be attributed to the US’s difficulties dealing with the COVID-19 pandemic, as well as the breakthrough joint agreement on the European budget and recovery program.
EU leaders agreed to a new €1 trillion seven-year budget, along with a €750 billion COVID-19 recovery fund. While the size of the recovery fund (about 5.4% of GDP, to be disbursed over several years) is not massive in comparison to fiscal packages delivered in other major economies, or even at a domestic level in Europe, the proposed joint issuance of €750 billion worth of “Eurobonds” heralds the first meaningful breaking of the debt mutualization taboo.

INDEX PERFORMANCE (€)

EURO PERFROMANCE VS VARIOUS CURRENCIES
Sources: Bloomberg Index Services Limited, EPRA, European Banking Federation, FTSE Fixed Income LLC, FTSE International Limited, ICE Benchmark Administration Ltd., J.P. Morgan Securities, Inc., MSCI Inc., National Association of Real Estate Investment Trusts, Standard & Poor’s, and Thomson Reuters Datastream.
GBP-Based Investors
UK sterling saw an extraordinary rally in July, with the cable experiencing its best month in more than a decade. Gold was the top-performing asset and has trounced all other major asset classes in the last 12 months. Emerging markets equities topped developed market equivalents, and UK mid caps outperformed domestic large caps. Developed ex UK equities declined but bested UK stocks, which lagged all other major asset classes. Investment-grade and high-yield corporate bonds outperformed gilts and UK linkers edged nominal gilts as yields declined across the curve.
UK sterling’s advance was broad-based, gaining the most vis-à-vis the US and Canadian dollars, an equal-weighted basket of emerging markets currencies, and the Japanese yen. Over the past 12 months, UK sterling experienced similar gains, declining only versus the Swiss franc.
The EU’s chief Brexit negotiator, Michel Barnier, said that a new deal with Britain was still possible, even as the latest round of EU-UK negotiations concluded with Brussels saying an agreement with London was unlikely.

INDEX PERFORMANCE (£)
POUND STERLING PERFORMANCE VS VARIOUS CURRENCIES
Sources: Bloomberg Index Services Limited, EPRA, FTSE International Limited, Intercontinental Exchange, Inc., ICE Benchmark Administration Ltd., J.P. Morgan Securities, Inc., MSCI Inc., National Association of Real Estate Investment Trusts, Standard & Poor’s, and Thomson Reuters Datastream.
Performance Exhibits
All data are total returns unless otherwise noted. Total return data for all MSCI indexes are net of dividend taxes.
USD-Based Investors index performance chart includes performance for the Bloomberg Barclays US Aggregate Bond, Bloomberg Barclays US Corporate Investment Grade, Bloomberg Barclays US High Yield Bond, Bloomberg Barclays Municipal Bond, Bloomberg Barclays US TIPS, Bloomberg Barclays US Treasuries, ICE BofAML 91-Day Treasury Bills, FTSE® NAREIT All Equity REITs, J.P. Morgan GBI-EM Global Diversified, LBMA Gold Price, MSCI Emerging Markets, MSCI World, Russell 2000®, S&P 500, and S&P GSCI™ indexes.
EUR-Based Investors index performance chart includes performance for the Bloomberg Barclays Euro-Aggregate: Corporate, Bloomberg Barclays Pan-Euro High Yield (Euro), EURIBOR 3M, FTSE EMU Govt Bonds, FTSE Euro Broad Investment-Grade Bonds, FTSE® EPRA/NAREIT Europe ex UK RE, J.P. Morgan GBI-EM Global Diversified, LBMA Gold Price AM, MSCI Emerging Markets, MSCI Europe, MSCI Europe ex UK, MSCI Europe Small-Cap, MSCI World ex EMU, MSCI World, and S&P GSCI™ indexes.
GBP-Based Investors index performance chart includes performance for the Bloomberg Barclays Sterling Aggregate: Corporate Bond, Bloomberg Barclays Sterling Index-Linked Gilts, ICE BofAML Sterling High Yield, FTSE® 250, FTSE® All-Share, FTSE® British Government All Stocks, FTSE® EPRA/NAREIT UK RE, J.P. Morgan GBI-EM Global Diversified, LBMA Gold Price AM, LIBOR 3M GBP, MSCI Emerging Markets, MSCI Europe ex UK, MSCI World, MSCI World ex UK, and S&P GSCI™ indexes.
EM currencies is an equal-weighted basket of 20 emerging markets currencies.
Fixed Income Performance Table
Performance data for US TIPS reflect the Bloomberg Barclays US TIPS Index, with yields represented by the Bloomberg Barclays Global Inflation Linked Bond Index: US.