Global equities posted modest returns in July as central banks shifted to more accommodative policies. Developed markets equities outperformed emerging markets equivalents as the United States buoyed returns in major currency terms. Growth equities bested value stocks, and large caps performed in line with small caps. Global high-yield and investment-grade corporates outperformed government bonds as yields declined, but individual market trends varied. Among real assets, commodity futures and natural resources equities declined, while REITs and gold prices advanced. Of major currencies, the US dollar appreciated, while the UK sterling and euro weakened.
Central banks took center stage in July. All eyes were on the Federal Reserve, which cut its benchmark interest rate 25 basis points (bps) for the first time since 2008. Fed Chairman Jerome Powell did not explicitly commit to a series of further rate reductions, which appeared to disappoint investors and spark an equity sell-off. The European Central Bank (ECB) also signaled a forthcoming policy shift, implying that it could take stimulative action in September and consider an array of measures. The Bank of Japan (BOJ) left its negative short-term interest rate unchanged, but indicated that it would respond aggressively to economic weakness despite limited ammunition. Brexit hardliner Boris Johnson was elected Prime Minister in the United Kingdom, heightening concerns of a “no-deal” departure from the EU in October and sending the sterling tumbling, prompting the Bank of England (BOE) to soften its previously steadfast tone on future rate hikes. The overarching theme of central bank shifts toward more accommodative policy came amid weakening economic growth outlooks, particularly in Europe and China, where manufacturing and trade data continued to disappoint. Trade tensions still loom large over the global economy with no clear resolution in sight, as renewed trade talks between the United States and China ended with no visible progress in July, prompting Trump to move forward with new tariffs on $300 billion of Chinese goods after month-end. The IMF further reduced its global growth forecast, citing weak final demand, soft global trade, and subdued inflation, but raised its 2019 growth outlook for the United States after stronger-than-expected first quarter performance; still, risks to the forecast were mainly to the downside.

TOTAL RETURN FOR MSCI INDEXES (%)
US equities (1.4% for the S&P 500 Index) reached new all-time highs in July, outpacing broader developed markets. US stocks gained 20.2% year-to-date, outperforming all major equity regions. Seven of 11 sectors delivered positive returns, led by communication services, information technology, and consumer staples; energy and healthcare declined the most. Growth stocks outgained value equivalents and large caps bested small caps, widening year-to-date outperformance. Second quarter year-over-year earnings per share (EPS) growth for the S&P 500 stands at -1.3%, based on 76% of companies having reported. If the final earnings growth figure is negative, it will be the first time the United States has experienced two straight quarters of year-over-year EPS declines since first and second quarter 2016. However, reported EPS growth data have been less negative than expected, as 75% of companies have surprised to the upside. Healthcare—the only US sector with year-to-date returns less than 10%—experienced the largest increase in earnings, while materials saw earnings decline the most. Notably, EPS grew 3% for S&P 500 companies with at least half of revenues generated within the United States, but declined 14% for companies with less than half of revenues generated inside the United States, indicative of headwinds facing international firms due to a strong US dollar, softening global demand, and ongoing trade tensions. Second quarter US GDP growth slowed to 2.1%, but beat estimates and remained above the Fed’s long-run growth expectation. Consumer spending—the core driver of US GDP—grew at 4.3%, its second largest gain in five years, while declines in exports and business investments detracted from total growth. The Fed lowered interest rates 25 bps on the last day of the month as expected—its first rate cut since 2008. Fed Chairman Jerome Powell described the cut as a “mid-cycle adjustment to policy” rather than the start of an easing cycle, but did not rule out additional cuts if deemed necessary to maintain the current economic expansion. Still, market participants hoping for a more explicit plan for future rate cuts viewed this as more hawkish than expected, and equity markets sold off in response.
European equities (-1.9% is USD, 0.3% in EUR, 1.9% in GBP) underperformed amid ongoing economic weakness and declining growth outlook. UK equities outperformed their Europe ex UK counterparts in local currency terms. However, most of the outperformance disappeared in major currency terms as UK sterling weakened significantly, fueled by new Prime Minister Boris Johnson’s promise that the United Kingdom will leave the EU on October 31 “no matter what.” Economic data turned markedly weak for Eurozone powerhouse Germany as already below-target inflation slowed, while manufacturing and business sentiment fell further into contractionary territory, all disappointing expectations. This reflected the trend in the broader Eurozone, where a widely followed business climate measure turned negative for the first time since 2013. Outgoing ECB President Mario Draghi, whose term ends at the end of October, signaled that the ECB is preparing to cut benchmark interest rates and restart its bond-buying program at its next meeting in September to support the beleaguered Eurozone’s economic situation. European corporate earnings reported -1% year-on-year EPS growth with 65% of companies reporting. Pro-cyclical materials and energy EPS declined the most, while real estate, utilities, and information technology EPS grew the most. Eurozone second quarter GDP grew 1.1% from a year earlier, slowing from last quarter, but in line with expectations.
Japanese equities (0.1% in USD, 2.4% in EUR, 4.1% in GBP) advanced in July, underperforming the broader developed markets index, mainly due to relative strength in US equity performance, but lagged developed markets by 12 percentage points over the trailing 12 months in local currency terms. The BOJ kept benchmark interest rates steady at -0.1% and reaffirmed its pledge not to raise interest rates before at least spring 2020. BOJ Governor Haruhiko Kuroda strengthened the central bank’s commitment to pre-emptively addressing risks to the economy from abroad that threaten momentum toward its long-sought-after 2% inflation goal. Kuroda added that the central bank would “ease policy without hesitation” and cited declining exports and business sentiment resulting from slowing growth in Europe and China as key risks. Prime Minister Shinzo Abe’s Liberal Democratic Party (LDP) lost its super majority in July’s parliamentary elections; however, the LDP still maintains a significant majority and is expected to continue economic policies colloquially referred to as “Abenomics.” Japanese corporate earnings have shown a decline in the second calendar quarter to the tune of -8%, based on results from 44% of companies.
Emerging markets equities (-1.2% in USD, 1.0% in EUR, 2.7% in GBP) lagged developed markets counterparts for the sixth straight month in major currency terms. The strong dollar, ongoing trade tensions, and weaker growth outlooks contributed to their underperformance. All three regions declined in local currency terms, with emerging Europe, the Middle East & Africa the sole outperformer; Latin America performed on par with broader emerging markets and heavily weighted emerging Asia lagged. Among major emerging market countries, Taiwan and Brazil gained, while India, Korea, and South Africa underperformed; China, which constitutes about one-third of the index, declined, but outperformed the broader market. The IMF downgraded 2019 GDP growth expectations for all major emerging markets countries and regions. China reported second quarter GDP growth of 6.2%, as the effects of the trade spat continue to weigh on the economy. China’s imports and exports fell more than expected, and factory activity also suffered its third consecutive decline in July based on official measures. A political dispute between Korea and Japan escalated into a tit-for-tat trade row, as Japan introduced new export restrictions and removed Korea from its list of trusted trading partners and Korean unions organized boycotts of all goods made in Japan. Frontier markets equities (2.5% in USD, 4.8% in EUR, 6.5% in GBP) outperformed both developed and emerging markets stocks for only the second time this year. Kuwait and Vietnam, which represent half of the index by market capitalization after Argentina graduated to the MSCI Emerging Markets Index in May, both outperformed the broader index.
Real assets performance was mixed in July. Commodity futures (-0.7% for the Bloomberg Commodity TR Index and -0.2% for the energy-heavy S&P GSCI™ Index) declined as agricultural prices fell, but precious and industrial metals posted gains. Oil prices ($65.17 for Brent and $58.58 for WTI) were mixed and remained range-bound throughout most of the month. Global natural resources equities (-3.1% for the MSCI World Natural Resources Index in USD terms) underperformed broader equities on weak underlying earnings and softening global economic growth outlook, while energy MLPs (-0.2%) posted marginal losses. Global developed REITs (0.4%) advanced, buoyed by Europe ex UK REITs (2.5%) and US REITs (1.5%); Asia REITs (-0.9% in USD terms) and UK REITs (-2.7%) declined. Gold prices (1.1%) gained to $1,427.68 as global economic growth concerns deepened; the yellow metal has appreciated 16.8% over the past year, its largest 12-month gain since late 2016.
Global fixed income generally advanced last month amid central bank easing and worries that global economic growth could decelerate further. US high-yield (0.6%) and investment-grade corporate bonds (0.6%) outperformed Treasuries (-0.1%) as the Fed cut its benchmark interest rate by one-quarter of a percentage point. Five- and ten-year Treasury yields rose 8 and 2 basis points (bps) to 1.84% and 2.02%, respectively. The ten-year minus three-month yield curve flattened, but has remained inverted for 49 of the past 50 trading days. The benchmark ten-year minus two-year yield curve has yet to turn negative; however, it reached its lowest level (13 bps) since the December equity market correction. UK gilts (2.1%) gained, besting UK high-yield corporates (0.7%), but lagging UK investment-grade corporates (2.3%). Five- and ten-year gilt yields declined 23 bps and 21 bps to 0.38% and 0.68%, respectively. EMU government bonds (1.7%) underperformed global aggregate bonds in EUR terms as German ten-year bund yields fell 11 bps to -0.44%, reaching new all-time lows. Notably, Denmark became the first country ever to have its entire yield curve turn negative, but was joined by Switzerland late in the month after the Swiss 50-year government bond yield also turned negative. Total global negative yielding debt reached an all-time high of more than $13 trillion, and now includes some investment-grade corporates, high-yield corporates, and euro-denominated emerging market bonds. US TIPS (0.4%) and tax-exempt municipal bonds (0.8%) outperformed nominal Treasuries. UK linkers (3.6%) outgained nominal gilts.
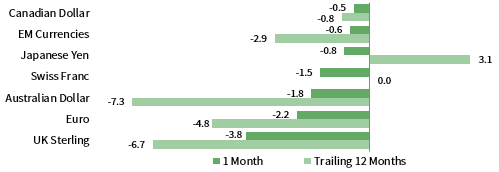
Among major currencies, the US dollar appreciated, while the euro and UK sterling broadly weakened. The greenback gained the most vis-à-vis UK sterling, the euro, the Australian dollar, and the Swiss franc, and experienced more muted appreciations versus the Japanese yen, Cambridge Associates’ (CA) equal-weighted basket of emerging markets currencies, and Canadian dollar. The euro and UK sterling declined the most vis-à-vis the US dollar, Canadian dollar, CA’s EM currency basket, and the Japanese yen. The euro gained versus UK sterling. Over the past 12 months, UK sterling and euro are broadly weaker, while the US dollar is mostly stronger.
Currency Performance as of July 31, 2019
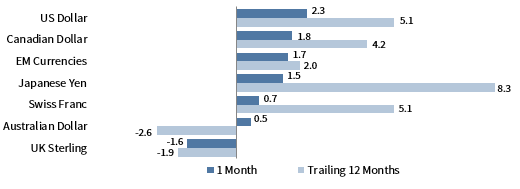
The US dollar appreciated versus major currencies in July, gaining the most versus UK sterling, the euro, Australian dollar, and Swiss franc. The greenback was broadly stronger over the trailing 12 months, weakening only relative to Japanese yen.
VERSUS THE US DOLLAR
Total Return (%)
The euro mostly depreciated over the past month, declining the most vis-à-vis the US and Canadian dollars, CA’s equal-weighted basket of EM currencies, and the Japanese yen, while gaining only against UK sterling. Over the past 12 months, the euro is weaker against all but UK sterling and Australian dollar.
VERSUS THE EURO
Total Return (%)
UK sterling was broadly weaker in July, depreciating the most against the US and Canadian dollars, CA’s EM currency basket, and Japanese yen. In the past twelve months, safe-haven currencies—Japanese yen, US dollar, and Swiss franc—have all gained at least 7% vis-à-vis UK sterling amid ongoing Brexit concerns.

VERSUS THE POUND STERLING
Total Return (%)
Note: EM currencies is an equal-weighted basket of 20 currencies.
USD Market Performance as of July 31, 2019
US REITs and gold were among top performers in July as the Fed cut rates by 25 bps. US equities outgained developed counterparts, and domestic large caps bested small caps. IG and HY corporates outperformed Treasuries. EM equities declined the most amid a strong US dollar and weaker commodity prices.

INDEX PERFORMANCE (US$)
COMPOSITE NORMALIZED P/E: MSCI US
December 31, 1969 – July 31, 2019

FIXED INCOME YIELDS
July 2018 – July 2019
Euro Market Performance as of July 31, 2019
Gold and EM local currency debt outgained other asset classes due to declining interest rates and euro weakness. EMU government bonds bested corporate IG and HY. European equities were bottom performers, outgained by developed and emerging equivalents.

INDEX PERFORMANCE (€)

COMPOSITE NORMALIZED P/E: MSCI EUROPE EX UK
December 31, 1969 – July 31, 2019

FIXED INCOME YIELDS
July 2018 – July 2019
Sources: Bloomberg Index Services Limited, EPRA, European Banking Federation, FTSE Fixed Income LLC, FTSE International Limited, ICE Benchmark Administration Ltd., J.P. Morgan Securities, Inc., MSCI Inc., National Association of Real Estate Investment Trusts, Standard & Poor’s, and Thomson Reuters Datastream. MSCI data provided “as is” without any express or implied warranties.
GBP Market Performance as of July 31, 2019
Gold was the top-performing asset class as fears of a “no-deal Brexit” spiked and sterling sold off. UK equities were bested by developed counterparts, and domestic large caps topped mid caps. UK REITs were the sole asset class to decline in pound sterling terms.
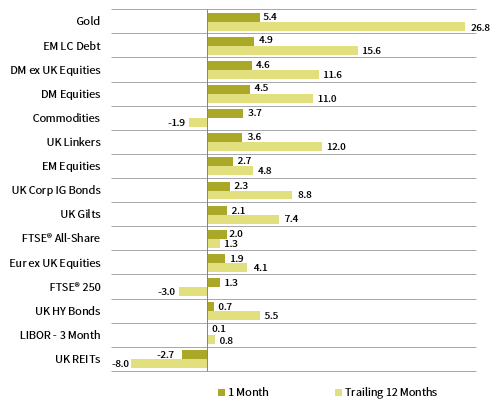
INDEX PERFORMANCE (₤)
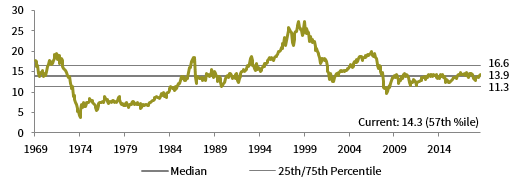
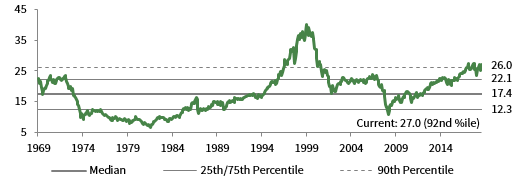
COMPOSITE NORMALIZED P/E: MSCI UK
December 31, 1969 – July 31, 2019
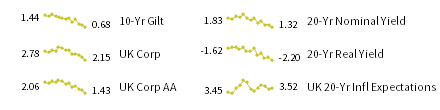
FIXED INCOME YIELDS
July 2018 – July 2019
Exhibit Notes
Performance Exhibits
Total return data for all MSCI indexes are net of dividend taxes.
US dollar index performance chart includes performance for the Bloomberg Barclays Aggregate Bond, Bloomberg Barclays Corporate Investment Grade, Bloomberg Barclays High-Yield Bond, Bloomberg Barclays Municipal Bond, Bloomberg Barclays US TIPS, Bloomberg Barclays US Treasuries, BofA Merrill Lynch 91-Day Treasury Bills, FTSE® NAREIT All Equity REITs, J.P. Morgan ELMI+, J.P. Morgan GBI-EM Global Diversified, MSCI Emerging Markets, MSCI World, Russell 2000®, S&P 500, and S&P GSCI™ indexes.
Euro index performance chart includes performance for the Bloomberg Barclays Euro-Aggregate: Corporate, Bloomberg Barclays Pan-Euro High Yield, Citigroup EMU Govt Bonds, Citigroup Euro Broad Investment-Grade Bonds, Euribor 3-month, FTSE® EPRA/NAREIT Europe ex UK, J.P. Morgan ELMI+, J.P. Morgan GBI-EM Global Diversified, MSCI Emerging Markets, MSCI Europe, MSCI Europe ex UK, MSCI Europe Small-Cap, MSCI World ex EMU, MSCI World, and S&P GSCI™ indexes.
UK sterling index performance chart includes performance for the Bloomberg Barclays Sterling Aggregate: Corporate Bond, BofA Merrill Lynch Sterling High Yield, FTSE® 250, FTSE® All-Share, FTSE® British Government All Stocks, FTSE® British Government Index-Linked All Stocks, FTSE® EPRA/NAREIT UK RE, J.P. Morgan ELMI+, J.P. Morgan GBI-EM Global Diversified, LIBOR 3M GBP, MSCI Emerging Markets, MSCI Europe ex UK, MSCI World, MSCI World ex UK, and S&P GSCI™ indexes.
Valuation Exhibits
The composite normalized P/E ratio is calculated by dividing the inflation-adjusted index price by the simple average of three normalized earnings metrics: ten-year average real earnings (i.e., Shiller earnings), trend-line earnings, and return on equity–adjusted earnings. We have removed the bubble years 1998–2000 from our mean and standard deviation calculations. All data are monthly.
Fixed Income Yields
US fixed income yields reflect Bloomberg Barclays Municipal Bond Index, Bloomberg Barclays US Corporate High Yield Bond Index, Bloomberg Barclays US Corporate Investment-Grade Bond Index, and the ten-year Treasury.
European fixed income yields reflect the BofA Merrill Lynch Euro Corporate AA Bond Index, BofA Merrill Lynch Euro Corporate Bond Index, Bloomberg Barclays Pan-European Aggregate High Yield Bond Index, Bloomberg Twenty-Year European Government Bond Index (nominal), ten-year German bund, 20-year European Inflation Swaps (inflation expectations), and the real yield calculated as the difference between the inflation expectation and nominal yield.
UK sterling fixed income yields reflect the ICE BofAML Sterling Corporate AA Bond Index, ICE BofAML Sterling Corporate Bond Index, UK ten-year gilts, Bank of England 20-year nominal yields, and Bloomberg Generic UK 20-year inflation-linked (real) yields.