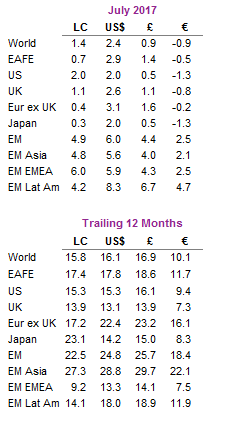
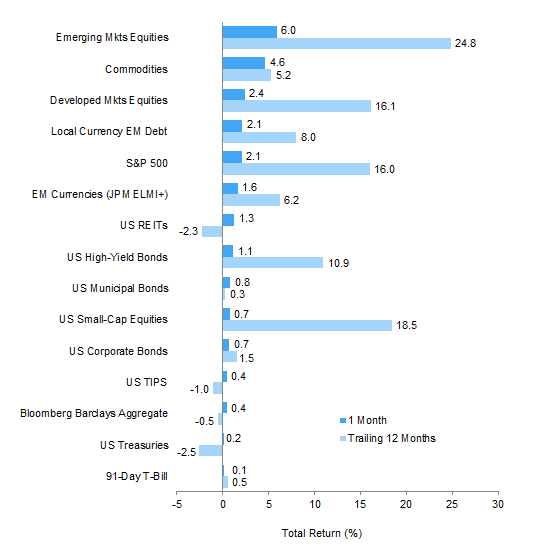
Capital markets performance was generally positive in July, bolstered by a weaker dollar and upbeat economic data. Several trends from the first half of the year continued as global equities advanced further, led again by growth stocks and emerging markets, which have outperformed developed markets equivalents every month this year in all major currencies. Global investment-grade bonds also gained but underperformed equities in most markets. After a challenging first half of the year, real assets reversed course and performance was mostly positive, with commodities and global natural resources equities outperforming global stocks. Among currencies, the US dollar continued to slide, while the euro strengthened, reaching highs against the US dollar not seen since early 2015.
The benign environment enjoyed by risk assets during the first half of 2017 continued in July, despite some turbulence observed in late second quarter following more hawkish than expected commentary from several leading central banks. Global stocks, as represented by the MSCI All Country World Index, set multiple new all-time highs in nominal terms during the month as global growth continued to improve, corporate earnings remained robust, oil prices rebounded, liquidity stayed plentiful, and the US dollar weakened further. Sovereign yields stabilized near the higher levels reached in late June as inflation continued to moderate and the European Central Bank (ECB) attempted to clarify that President Mario Draghi’s most recent remarks highlighting the strengthening recovery did not foreshadow an imminent end to quantitative easing, while strong corporate fundamentals helped credit spreads continue to tighten. Finally, energy and industrial metals prices rallied in response to improving supply pictures and were also supported by further US dollar weakness.
Currency moves have been an important component of capital markets performance in 2017, and the trend continued in July, with the US dollar falling almost 3% for the month. The dollar is now down nearly 10% since its December 2016 peak. As a result, relative currency performance has been either a tailwind or a headwind to year-to-date portfolio returns, depending on one’s home currency. USD investors have enjoyed robust outperformance from unhedged non-US exposures as the euro, British pound, and EM currencies notched strong gains vis-à-vis the US dollar. In contrast, the resurgent euro has weighed on returns for Eurozone-based investors, as foreign exchange losses have nearly negated healthy local currency gains in US, UK, and Japanese stocks, while cutting into the stellar performance of emerging markets equities.
US equities (2.1% for the S&P 500) advanced for the ninth consecutive month, benefitting from strong second quarter earnings growth. With a little over half of S&P 500 companies reporting, blended earnings growth for second quarter is estimated to be 9% according to FactSet, above earlier estimates. Earnings have benefited from a weaker US dollar and stronger global economic growth. US second quarter GDP rebounded to 2.6% annualized, following a downwardly revised 1.2% growth rate in first quarter. However, the IMF downgraded its full year 2017 and 2018 growth forecasts for the United States in July partially due to the assumption that fiscal policy will be less stimulative than previously assumed. The Federal Reserve’s statement following its July meeting contained few surprises; the FOMC left the policy rate unchanged while indicating the Fed will “relatively soon” start the process of unwinding its balance sheet, suggesting a September announcement is likely. Looking at sector performance, after underperforming in June, IT stocks resumed market leadership despite another wobble in the last few trading days of the month. Fundamentals remain strong for the sector and valuations, though elevated, are not nearly as stretched as they were during the dot com bubble. Notably, however, crowding in IT and internet-related stocks from hedge funds and actively managed mutual funds could translate into higher volatility going forward.
European equities (0.6%) underperformed developed markets peers in local currency terms but outperformed in EUR, GBP, and USD terms as the euro rallied to its highest levels against the US dollar in nearly two years despite Mario Draghi’s dovish remarks following the ECB’s July meeting. Europe ex UK and EMU stocks outperformed UK equivalents in EUR, GBP, and USD terms. The stronger euro is becoming a headwind to European earnings; with almost half of the Stoxx600 companies reporting, blended earnings growth for second quarter is estimated at 7%, below estimates from the start of April. In contrast, economic data in the Eurozone have been mostly positive as Eurozone unemployment fell to its lowest level in eight years, GDP growth accelerated to its highest level since 2011, and core inflation picked up to a four-year high. However, headline inflation remains below the central bank’s target rate of 2% with the stronger euro and weaker oil prices acting as deflationary forces in recent months.
Japanese equities (0.3%) were up slightly in July, with currency fluctuations pulling up returns in GBP and USD terms to 0.5% and 2.0%, respectively, but pushing down returns in EUR terms (-1.3%). It is still early in the earnings cycle for Japan, with less than a quarter of companies reporting, but early results have been strong. The Bank of Japan cut its inflation forecast during the July meeting and pushed back the timeframe for reaching its 2% inflation goal to 2020, citing low commodity prices and weaker-than-expected consumer spending. Despite this setback, Japanese household spending in June hit its highest level in two years and unemployment fell back to the 23-year low reached earlier this year.
Emerging markets equities (6.0% in USD, 4.4% in GBP, and 2.5% in EUR) continued to outperform developed markets counterparts, supported by lower Treasury yields and US dollar weakness. Relative to the broader index, Latin America outperformed; emerging Europe, the Middle East & Africa performed roughly in line; and emerging Asia lagged. Brazil was a primary driver of Latin America’s outperformance as the Brazilian Senate passed the government’s labor reform bill and former President Lula da Silva was convicted of corruption and money laundering, which seemed to demonstrate the government’s commitment to reforms and attracted a surge of non-resident equity inflows. Asia’s performance was driven by heavily weighted China, where stronger-than-expected economic data supported returns, and India, where the local Nifty 50 Index touched an all-time high late in the month and the country experienced the highest monthly net capital inflows in more than two years.
Real assets rebounded in July, with most categories experiencing gains. Commodity futures advanced (2.3% for the Bloomberg Commodity TR Index and 4.6% for the energy-heavy S&P GSCITM), led by gains in the energy and industrial metals sectors. Following price volatility mid-month, crude oil prices ended the month up ($52.65 and $50.17 for Brent and WTI, respectively), hitting a two-month high on the last trading day of the month. OPEC and non-OPEC producers are scheduled to meet in early August to discuss output-cut compliance. Among industrial metals, copper prices reached a two-year high, and iron ore prices advanced. Higher commodity prices also drove gains in global natural resources equities (5.0% for the MSCI World Natural Resources Index in USD terms) and energy MLPs (1.3%). Global REITs gained in July (1.9% in USD terms), led by UK REITs (3.1%) and Europe ex UK REITs (3.1%), whereas US REITs (1.3%) underperformed. Gold advanced 2.0% to $1,268.85/troy ounce, bringing year-to-date returns for the precious metal to 9.6%.
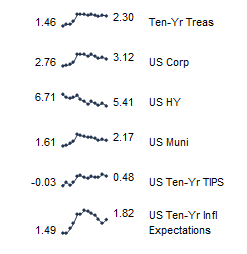
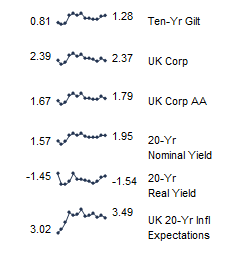
Global developed markets government bonds were relatively flat in July and underperformed global equities. UK gilts (0.3%) outperformed US Treasuries (0.2%) and EMU government bonds (0.2%). Yields for five- and ten-year Treasuries fell 5 basis points (bps) and 1 bp to 1.84% and 2.30%, respectively. The UK gilt yield curve also steepened as the five-year fell 9 bps, while the ten-year rose 9 bps to 0.47% and 1.28%, respectively. US tax-exempt bonds (0.8%) outperformed Treasuries. Corporate credit spreads tightened as US high-yield bonds (1.1%) and US investment-grade corporate bonds (0.7%) also outperformed. Among developed markets inflation-linked bonds, US TIPS (0.4%) outperformed nominal Treasuries; UK linkers (-1.4%) trailed nominal gilts in contrast.
US dollar weakness intensified in July. The trade-weighted US dollar reached a ten-month low during the month as the greenback retreated against the Australian dollar, Canadian dollar, euro, Japanese yen, UK sterling, and our basket of EM currencies. The lone exception to US dollar weakness was the Swiss franc, which weakened against all major developed country currencies we track. Euro strength was only outmatched by the Australian dollar and Canadian dollar, as the euro strengthened against the other major developed markets currencies we track, as well as our basket of EM currencies. UK sterling performance was more mixed; the British pound strengthened against our basket of EM currencies, the US dollar, and Swiss franc but weakened against the Australian dollar, Canadian dollar, euro, and Japanese yen.
Market Exhibits
Currency Performance
July saw the US dollar continue to weaken as the DXY Index reached a ten-month low. The greenback fell vis-à-vis the Australian dollar, Canadian dollar, euro, Japanese yen, UK sterling, and our EM currency basket but strengthened against the Swiss franc, which weakened against all major developed markets currencies
The euro strengthened against most currencies we track, with the exception of the Australian dollar and Canadian dollar, as the common currency continued to appreciate despite dovish comments by ECB President Mario Draghi. On a trailing 12-month basis, the euro has strengthened against all major currencies
The UK sterling was more mixed over the month, gaining against the Swiss franc, US dollar, and our basket of EM currencies but weakening versus the Australian dollar, Canadian dollar, euro, and Japanese yen
Sources: MSCI Inc. and Thomson Reuters Datastream. MSCI data provided “as is” without any express or implied warranties.
Note: EM currencies is an equal-weighted basket of 20 currencies.
Index Performance (US$)
A weaker US dollar helped emerging markets equities and developed markets stocks outperform US equivalents. US equities still notched decent gains and outpaced domestic bonds, with large-cap stocks besting small caps. Reversing course from the first half, commodities outperformed in July and are now up over the past 12 months
Sources: Barclays, Bloomberg L.P., BofA Merill Lynch, FTSE International Limited, Frank Russell Company, J.P. Morgan Securities, Inc., MSCI Inc., National Association of Real Estate Investment Trusts, Standard & Poor’s, and Thomson Reuters Datastream. MSCI data provided “as is” without any express or implied warranties.
Index Performance (€)
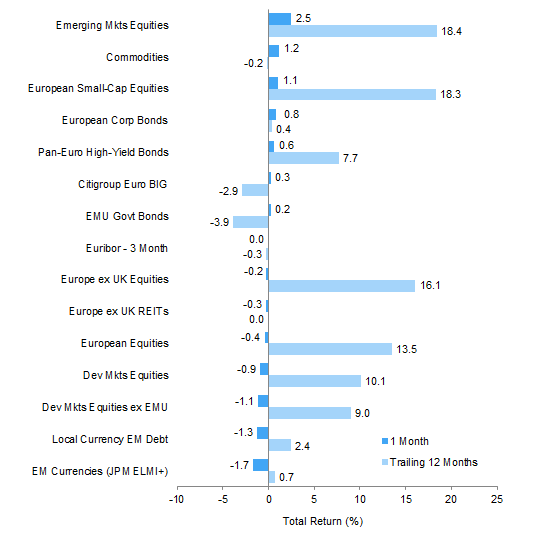
Emerging markets equities posted the best performance in July and over the past 12 months. European small-cap stocks also outperformed as the strong euro was a headwind to large caps, which trailed European corporate bonds and EMU government bonds. Commodities rebounded in July but continued to lag on a 12-month basis
Sources: Barclays, Bloomberg L.P., Citigroup Global Markets, EPRA, FTSE International Limited, J.P. Morgan Securities, Inc., MSCI Inc., National Association of Real Estate Investment Trusts, Standard & Poor’s, and Thomson Reuters Datastream. MSCI data provided “as is” without any express or implied warranties.
Index Performance (£)
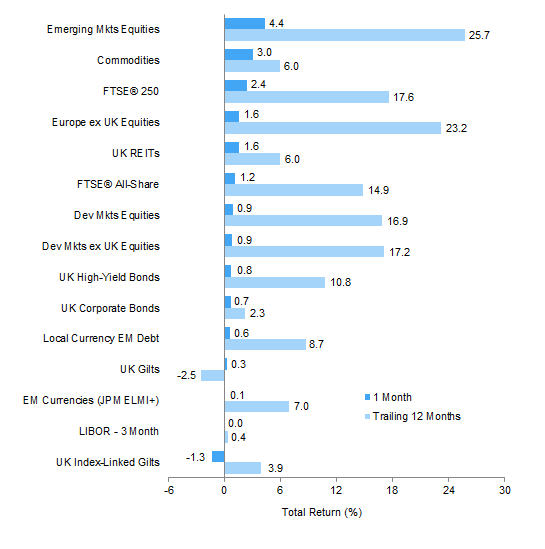
All asset categories advanced for the month, with the exception of UK linkers. Emerging markets equities, commodities, and UK mid caps gained the most, while returns for fixed income assets were more muted. UK gilts are the only asset class to have declined over the past 12 months
Sources: Barclays, Bloomberg L.P., BofA Merill Lynch, EPRA, FTSE International Limited, J.P. Morgan Securities, Inc., MSCI Inc., National Association of Real Estate Investment Trusts, Standard & Poor’s, and Thomson Reuters Datastream. MSCI data provided “as is” without any express or implied warranties.
Exhibit Notes
Performance Exhibits
Total return data for all MSCI indexes are net of dividend taxes.
US dollar index performance chart includes performance for the Bloomberg Barclays Aggregate Bond, Bloomberg Barclays Corporate Investment Grade, Bloomberg Barclays High-Yield Bond, Bloomberg Barclays Municipal Bond, Bloomberg Barclays US TIPS, Bloomberg Barclays US Treasuries, BofA Merrill Lynch 91-Day Treasury Bills, FTSE® NAREIT All Equity REITs, J.P. Morgan ELMI+, J.P. Morgan GBI-EM Global Diversified, MSCI Emerging Markets, MSCI World, Russell 2000®, S&P 500, and S&P GSCI™ indexes.
Euro index performance chart includes performance for the Bloomberg Barclays Euro-Aggregate: Corporate, Bloomberg Barclays Pan-Euro High Yield, Citigroup EMU Govt Bonds, Citigroup Euro Broad Investment-Grade Bonds, Euribor 3-month, FTSE® EPRA/NAREIT Europe ex UK, J.P. Morgan ELMI+, J.P. Morgan GBI-EM Global Diversified, MSCI Emerging Markets, MSCI Europe, MSCI Europe ex UK, MSCI Europe Small-Cap, MSCI World ex EMU, MSCI World, and S&P GSCI™ indexes.
UK sterling index performance chart includes performance for the Bloomberg Barclays Sterling Aggregate: Corporate Bond, BofA Merrill Lynch Sterling High Yield, FTSE® 250, FTSE® All-Share, FTSE® British Government All Stocks, FTSE® British Government Index-Linked All Stocks, FTSE® EPRA/NAREIT UK RE, J.P. Morgan ELMI+, J.P. Morgan GBI-EM Global Diversified, LIBOR 3M GBP, MSCI Emerging Markets, MSCI Europe ex UK, MSCI World, MSCI World ex UK, and S&P GSCI™ indexes.
Valuation Exhibits
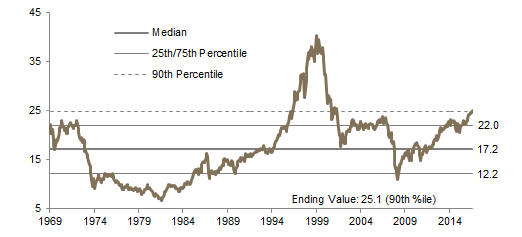
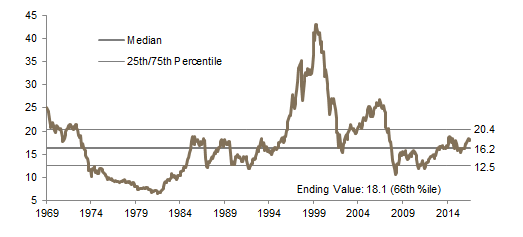
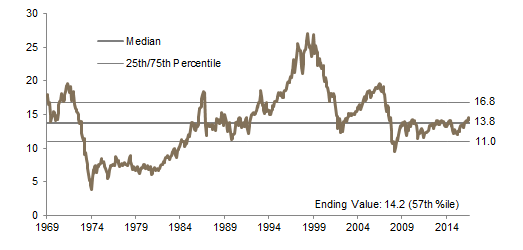
The composite normalized P/E ratio is calculated by dividing the inflation-adjusted index price by the simple average of three normalized earnings metrics: ten-year average real earnings (i.e., Shiller earnings), trend-line earnings, and return on equity–adjusted earnings. We have removed the bubble years 1998–2000 from our mean and standard deviation calculations. All data are monthly.
Fixed Income Yields
US fixed income yields reflect Bloomberg Barclays Municipal Bond Index, Bloomberg Barclays US Corporate High-Yield Bond Index, Bloomberg Barclays US Corporate Investment-Grade Bond Index, and the ten-year Treasury.
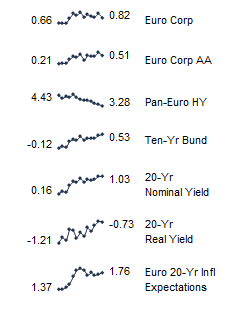
European fixed income yields reflect the BofA Merrill Lynch Euro Corporate AA Bond Index, BofA Merrill Lynch Euro Corporate Bond Index, Barclays Pan-European Aggregate High Yield Bond Index, Bloomberg Twenty-Year European Government Bond Index (nominal), ten-year German bund, 20-year European Inflation Swaps (inflation expectations), and the real yield calculated as the difference between the inflation expectation and nominal yield.
UK sterling fixed income yields reflect the BofA Merrill Lynch Sterling Corporate AA Bond Index, BofA Merrill Lynch Sterling Corporate Bond Index, UK ten-year gilts, Bank of England 20-year nominal yields, and Bloomberg Generic UK 20-year inflation-linked (real) yields. Current UK 20-year nominal yield data are as of July 28, 2017.
