July saw global equities continue to shrug off the historic UK referendum decision to leave the European Union and post their strongest performance since March. Emerging markets equities’ outperformance versus developed markets equivalents and continued strong performance from US high-yield bonds and emerging markets debt provided further evidence that risk appetite returned. Despite sovereign bond yields touching new record lows during the month they posted muted gains. A large decline in crude oil prices weighed on the performance of energy-related assets, while mining stocks and REITs outperformed broad equities. Currency volatility continued, though most major currencies ended the month near where they started.
Though “Brexit” dominated headlines into July, a number of developments over the course of the month caused initial concerns to recede and contributed to a more benign environment for risk assets. Financial markets are reported to have functioned smoothly in the immediate aftermath of the vote, with the Bank of England (BOE) leading the charge in providing emergency liquidity and signaling its intention to ease monetary policy. Initial economic data releases and forecasts suggest any Brexit-related damage will be largely contained to the United Kingdom and to a lesser extent the broader European economy. Though no action was taken in July, the BOE left open the possibility that it would cut rates in early August and expand its quantitative easing (QE) program. The European Central Bank (ECB) maintained its existing policy stance but again reiterated its willingness to do whatever necessary to support the Eurozone’s ongoing economic recovery. The US economy’s weak 1.2% annualized GDP growth estimate for the second quarter further supported market expectations that the US Federal Reserve will hold off hiking rates for the remainder of the year.
Sentiment was also boosted by a lessening of political uncertainty. The United Kingdom’s ruling Conservative party moved quickly to coalesce around a new leader, the well-regarded Theresa May, who expeditiously formed a new cabinet that appears to reflect her intention to honor the referendum result. She also reassured the country of her desire to keep the United Kingdom intact. The new prime minister stated that her government will take a deliberate approach toward Brexit and not rush to initiate exit negotiations with the EU, contributing to the market’s growing recognition that it will be a long, drawn-out process. Elsewhere in Europe, anti-EU parties failed to gain ground in the Spanish general election, alleviating concerns regarding an immediate domino effect across the Continent in the wake of the British vote. Italy’s October constitutional referendum, which could see the installation of an anti-EU party if it fails, will be an important event to keep an eye on.
US equities (3.8%) underperformed other major regions, though the S&P 500 (3.7%) ended the month just below an all-time high set on July 22. With nearly two-thirds of S&P 500 Index constituents having reported to date, second quarter financial results have been better than expected, but earnings per share are still forecast to decline on a year-over-year basis, extending the longest streak of consecutive quarters of negative earnings growth since the global financial crisis. The disappointing second quarter GDP estimate followed a downwardly revised 0.8% expansion in the prior quarter, as private investment remained depressed and businesses continued to reduce inventories amid an uncertain environment. Only consumer spending expanded at a healthy pace in the most recent quarter. Though the pace of job creation rebounded strongly in June from May’s anemic level, both figures involved some seasonal distortions; the upcoming July payrolls report will provide an important indicator of the overall state of the economy.
European equities (4.0%) were led by EMU markets (5.1%), with Germany (6.7%) outperforming. UK equities (3.5%) underperformed Europe ex UK (4.2%) equivalents, though UK mid-caps (6.4%) rallied to recover some of their substantial post-Brexit losses. Second quarter economic growth across the Continent was subdued but at least in line with expectations, and the United Kingdom’s decision to leave the EU is forecast to hurt growth going forward. Plunges in the Purchasing Managers’ Index (PMI) and a consumer confidence survey during July provided early indications that economic confidence in the United Kingdom has taken a hit. The results of the European Banking Authority’s latest round of stress tests were released after markets had closed on July 29. Given the amount of capital that has been raised in recent years, most banks were deemed to have sufficient capital levels even amid a severe economic downturn scenario, though one that did not involve Brexit as a baseline assumption. As expected, a handful of weaker institutions, primarily in peripheral countries, will need to do more to shore up balance sheets, with some announcing immediate plans to address capital deficiencies.
Japanese equities (6.4%) outperformed most other major markets as Prime Minister Shinzō Abe’s ruling coalition won a majority in Japan’s upper house of parliament, reinforcing support for his economic policies and paving the way for further fiscal and monetary stimulus announced later in the month. The Abe government previewed an economic package of more than ¥28 trillion ($274 billion), subsequently approved after month-end; however, the amount of direct spending for the current fiscal year was about ¥4 trillion, as expected. On July 29, the Bank of Japan announced just a small expansion of its QE program, modestly increasing its purchases of domestic stocks and REITs while keeping interest rates unchanged. The central bank also modified its approach to providing dollar liquidity to the market, an additional boon to the country’s financial institutions that may have also contributed to bank stocks leading an advance in Japanese equities on the day of the announcement despite a strong rally in the yen.
Emerging markets equities (4.3%) edged out developed markets equivalents as the former continued to benefit from a recently range-bound US dollar. Positive sentiment is suggested by recent estimates that non-resident portfolio flows into emerging markets equities surged during the first couple weeks of July to an extent not seen since the Fed’s September 2013 decision to delay tapering of its QE program. Among the major regions, Latin America (6.6%) outpaced emerging Asia (4.0%) and emerging Europe, the Middle East & Africa (3.8%).
Inflation-sensitive asset performance was mixed as falling crude oil prices caused energy-related assets to underperform other real asset categories. Commodity futures (-5.1% for the Bloomberg Commodity TR Index and -9.6% for the energy-heavy S&P GSCI™) were dragged lower by the 14% drop in WTI to $41.60/barrel amid a growing glut in gasoline inventories and signs that crude production declines are stabilizing. Prices for industrial metals and precious metals appreciated in contrast; the gold spot price rose 2.1% to close at $1,349.09/troy ounce. Natural resources equities (0.1%) treaded water as strong gains in metals and mining stocks were offset by declines in energy shares. Unit prices of energy master limited partnerships (0.6%) held up better; natural gas prices were roughly flat in July, which likely helped. US REITs (3.9%) continued their outperformance versus US equities, and UK REITs (5.2%) recovered some of their post-Brexit losses. Inflation-linked bonds also saw positive returns for US TIPS (0.9%) and UK linkers (1.4%).
Global government bonds (0.3%) experienced muted gains despite sovereign yields touching record lows intra-month and underperformed global equities after outperforming over the first half of the year. The US yield curve flattened modestly with the five-year yield rising 2 bps to 1.03% and the ten-year yield falling 3 bps to 1.46%. The UK yield curve also flattened as yields on longer maturities experienced large drops, e.g. 23 bps for the ten-year gilt. Despite their yield advantage, US Treasuries (0.4%) underperformed UK gilts (2.0%) and EMU sovereign bonds (0.8%). US tax-exempt bonds (0.1%) were effectively flat. US high-yield bonds (2.7%) continued to outperform investment-grade bonds despite falling oil prices in July.
The US dollar strengthened for much of the month before giving back all of its gains just before month-end as markets pushed back the expected timing of another US interest rate hike. The greenback finished the month modestly weaker versus the Australian dollar, euro, yen, and Swiss franc but stronger relative to the UK pound and Canadian dollar. The Australian dollar was supported by a rally in metals prices and despite consensus expectations that the central bank will cut rates at its next meeting in early August. The UK pound was weaker across the board relative to developed markets currencies and against emerging markets currencies in aggregate, which were roughly flat against the US dollar. Asian currencies were generally stronger; an exception was the Chinese yuan, which depreciated against the US dollar and the trade-weighted basket as the central bank continued to fix the exchange rate lower to support the country’s export competitiveness.
Market Exhibits
Change in Consensus GDP Growth Forecasts
Consensus GDP forecasts for this year and next suggest that the near-term economic fallout from the United Kingdom’s historic decision to leave the EU will be largely contained to European economies, with most of the pain felt by the UK economy itself
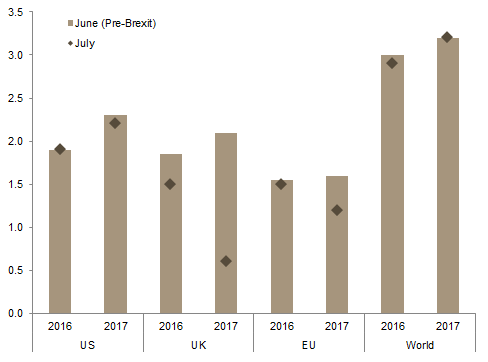
Change in Consensus GDP Growth Forecasts
As of July 31, 2016 • Percent (%)
Source: Bloomberg L.P.
Note: Consensus GDP figures are the median of analyst forecasts as calculated by Bloomberg.
Composite PMI
The plunge in the flash July composite PMI survey for the UK economy suggests that both services and manufacturing activity will contract in the wake of the Brexit vote, supporting expectations by economists that the UK economy will experience a mild recession beginning in the second half of this year

Composite PMI
August 31, 2013 – July 31, 2016
Sources: Markit Economics and Thomson Reuters Datastream.
Notes: Composite Purchasing Managers’ Index (PMI) represents a composite of the manufacturing and services PMI. For composite PMI, a reading above 50 implies expansion of activity, while a reading below 50 implies contraction in activity. July data represent flash estimates.
YTD Performance for Major Equity Regions
By the end of July, most of the major developed equity regions had recovered the losses suffered in the UK referendum’s immediate aftermath, with UK and US equities finishing squarely higher than their levels just prior to the vote. Only Eurozone equities had failed to recover their post-Brexit losses
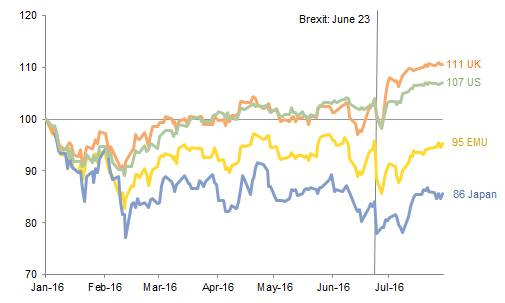
YTD Performance for Major Equity Regions
January 1, 2016 – July 31, 2016 • January 1, 2016 = 100
Sources: MSCI Inc. and Thomson Reuters Datastream. MSCI data provided “as is” without any express or implied warranties.
Notes: Data are daily. Performance reflects total returns in local currency. Total returns for developed markets are net of dividend taxes.
Ten-Year Government Bond Yields
Global sovereign bond yields plunged to record lows during July as investors sought safe havens amid heightened economic uncertainty and a growing sense among some investors that the world’s central banks are reaching the limits of what monetary policy can do to boost the real economy. Negative government bond yields in Europe and Japan are also pushing traditionally domestic-focused fixed income investors to search for yield overseas
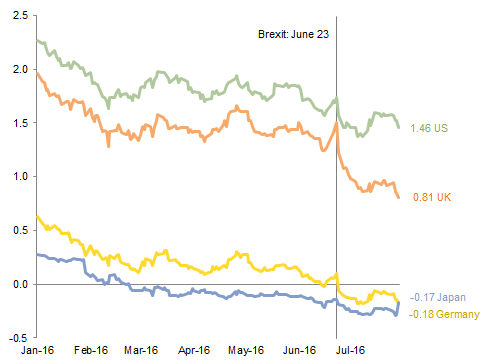
Ten-Year Government Bond Yields
January 1, 2016 – July 31, 2016 • Percent (%)
Sources: Federal Reserve and Thomson Reuters Datastream.
Note: Data are daily.
Currency Performance
The US Department of Commerce’s weak advance estimate of second quarter GDP took the wind out of the US dollar’s sails, with the greenback depreciating against the Australian dollar, Swiss Franc, euro, and Japanese yen after strengthening for most of the month
The euro was generally stronger as an estimate of Eurozone second quarter growth was in line with expectations, inflation improved, and the ECB refrained from further rate cuts at its July meeting
The pound sterling continued to weaken in July, though it traded in a much narrower range than it did the prior month. The Australian dollar, Swiss franc, and euro appreciated the most against the UK pound

Currency Performance
As of July 31, 2016
Sources: MSCI Inc. and Thomson Reuters Datastream. MSCI data provided “as is” without any express or implied warranties.
Note: EM currencies is an equal-weighted basket of 20 currencies.
Index Performance (USD)
US small-cap equities set the pace for US dollar investors, with emerging markets equities, developed markets equities, and US REITs outperforming US large caps despite the S&P 500 closing just below a record high set on July 22. US high-yield bonds and investment-grade US corporate bonds outperformed US Treasuries and US municipal bonds
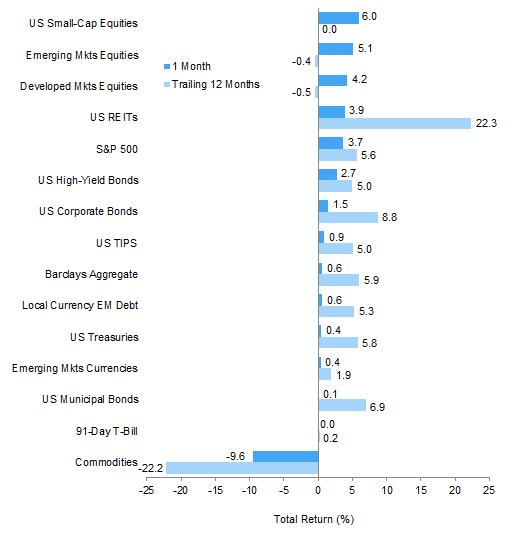
Index Performance (USD)
As of July 31, 2016

MSCI US Composite Normalized P/E
December 31, 1969 – July 31, 2016
Sources: Barclays, BofA Merill Lynch, FTSE International Limited, Frank Russell Company, J.P. Morgan Securities, Inc., MSCI Inc., National Association of Real Estate Investment Trusts, Standard & Poor’s, and Thomson Reuters Datastream. MSCI data provided “as is” without any express or implied warranties.

Fixed Income Yields
July 2015 – July 2016
Index Performance (€)
The risk-on environment was apparent in European markets, with Europe ex UK REITs and European small caps outperforming Europe ex UK large caps. EMU equities in particular enjoyed a strong rally, outperforming emerging markets equities. Eurozone investment-grade corporate bonds performed roughly in line with EMU sovereigns in the first full month of the ECB’s new purchasing program

Index Performance (€)
As of July 31, 2016

MSCI Europe ex UK Composite Normalized P/E
December 31, 1969 – July 31, 2016

Fixed Income Yields
July 2015 – July 2016
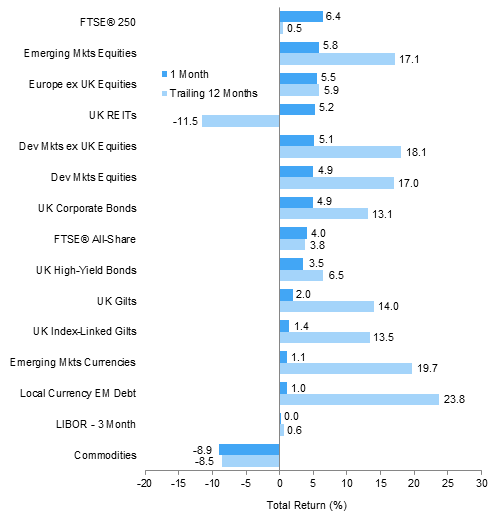
Index Performance (₤)
UK assets generally enjoyed strong performance during the first full month after the UK referendum on EU membership. Domestic-oriented UK mid-caps bounced back to recover some of their Brexit-related losses, outpacing the strong performance of emerging markets equities and developed ex UK large caps; UK REITs also rebounded following a difficult second quarter. UK investment-grade corporate bonds outperformed UK gilts and have also now generated double-digit returns over the last 12 months
Index Performance (₤)
As of July 31, 2016

MSCI UK Composite Normalized P/E
December 31, 1969 – July 31, 2016

Fixed Income Yields
July 2015 – July 2016
Exhibit Notes
Performance Exhibits
Total returns for MSCI developed markets indexes are net of dividend taxes. Total returns for MSCI emerging markets indexes are gross of dividend taxes.
US dollar index performance chart includes performance for the Barclays Corporate Investment Grade, Barclays High Yield Bond, Barclays Municipal Bond, Barclays US TIPS, Barclays US Treasuries, BofA Merrill Lynch 91-Day Treasury Bills, FTSE® NAREIT All Equity REITs, J.P. Morgan ELMI+, J.P. Morgan GBI-EM Global Diversified, MSCI Emerging Markets, MSCI World, Russell 2000®, and S&P GSCI™ indexes.
Euro index performance chart includes performance for the Barclays Euro-Aggregate: Corporate, Barclays Pan-Euro High Yield, Citigroup EMU Govt Bonds, FTSE® EPRA/NAREIT Europe ex UK, J.P. Morgan ELMI+, J.P. Morgan GBI-EM Global Diversified, MSCI Emerging Markets, MSCI Europe, MSCI Europe ex UK, MSCI Europe Small Cap, MSCI World ex EMU, MSCI World, and S&P GSCI™ indexes.
UK sterling index performance chart includes performance for the Barclays Sterling Agg Corps, BofA Merrill Lynch Sterling High Yield, FTSE® British Government All Stocks, FTSE® British Government Index-Linked All Stocks, FTSE® EPRA/NAREIT UK RE, FTSE® 250, J.P. Morgan ELMI+, J.P. Morgan GBI-EM Global Diversified, MSCI Emerging Markets, MSCI Europe ex UK, MSCI World, MSCI World ex UK, and S&P GSCI™ indexes.
Valuation Exhibits
The composite normalized P/E ratio is calculated by dividing the inflation-adjusted index price by the simple average of three normalized earnings metrics: ten-year average real earnings (i.e., Shiller earnings), trend-line earnings, and return on equity–adjusted earnings. We have removed the bubble years 1998–2000 from our mean and standard deviation calculations. All data are monthly.
Fixed Income Yields
US fixed income yields reflect Barclays Municipal Bond Index, Barclays US Corporate High Yield Bond Index, Barclays US Corporate Investment-Grade Bond Index, and the ten-year Treasury.
European fixed income yields reflect the BofA Merrill Lynch Euro Corporate AA Bond Index, BofA Merrill Lynch Euro Corporate Bond Index, Barclays Pan-European Aggregate High Yield Bond Index, Bloomberg Twenty-Year European Government Bond Index (nominal), ten-year German bund, 20-year European Inflation Swaps (inflation expectations), and the real yield calculated as the difference between the inflation expectation and nominal yield.
UK sterling fixed income yields reflect the BofA Merrill Lynch Sterling Corporate AA Bond Index, BofA Merrill Lynch Sterling Corporate Bond Index, UK ten-year gilts, and Bank of England 20-year nominal, real, and zero coupon (inflation expectations) yields.