July saw the release of second quarter earnings data compete for the market’s attention with the latest global macroeconomic and geopolitical developments. For now Greece has avoided a default, while in China policymakers continue their efforts to stem what has already been a 30%+ correction. Meanwhile, the developed world’s recovery from the global financial crisis continues, albeit sluggishly, and second quarter corporate financial results have thus far proven slightly stronger than subdued expectations. Against this backdrop, developed markets equities and bonds recovered some of their June losses, although dispersion rose and emerging markets assets were almost universally in the red. The return of US$ strength, a global supply glut amid record production, and a weaker Chinese growth outlook led commodities and commodity-related assets to suffer pronounced losses.
The global growth outlook remains tepid in aggregate, but growth trajectories continue to diverge across regions and countries, with important consequences for markets. Economic recoveries across developed economies remain mostly on track, albeit at rates slower than during past cycles in most cases. Recent data mostly point to mild improvements overall. Second quarter US growth figures suggested Americans are starting to save less and consume more, and similar trends could be seen in the United Kingdom and some continental European countries, perhaps reflecting somewhat tighter labor markets and improving consumer confidence. Developing economies, in the meantime, continue to decelerate, in part driven by China’s ongoing economic transition but also due to structural limitations such as stalled reforms and an overreliance on commodity exports. China’s falling raw materials demand and a growing supply glut mean the world’s largest commodity consumer is now exporting disinflation to the rest of the world. How central banks in economies like the United States and the United Kingdom respond remains to be seen; policymakers clearly would like to raise rates in some markets given the distortionary impacts of low rates on asset prices. However, in the current environment the greater risk is that of tightening too soon.
US equities (1.9%) were slightly behind developed markets equivalents in July as the market began to digest second quarter financial results. While results have been slightly better than subdued expectations, the S&P 500 (2.1% in July) is still expected to see quarterly earnings shrink for the first time since 2012. Growth outperformed value, and large caps outpaced small caps as new economy bellwethers like Amazon, Google, and Netflix reaffirmed their recent market leadership. A number of health care stocks also posted strong gains. Not surprisingly, the technology- and life sciences–heavy Nasdaq Composite reached another all-time high during the month. The US stock market’s ongoing resilience in the face of high valuations and decelerating earnings belies some troubling underlying statistics. US market breadth has greatly diminished since 2013, with decliners outpacing advancers and new 52-week lows outnumbering new highs. US equities’ recent performance has been concentrated among a handful of companies within the technology-oriented sectors, which means already expensive growth stock valuations are being stretched further. Both phenomena, when combined with prospects for rising interest rates, make the overall market, and growth stocks in particular, more susceptible to near-term corrections.
Europe ex UK (5.3%) and EMU equities (4.7%) cheered as Greece and its creditors agreed on an eleventh hour deal to provide emergency bridge financing and stave off default for now. The agreed framework could pave the way for a third rescue package, including the potential for debt restructuring. However, significant challenges remain. The International Monetary Fund recently decided to curtail its second program and sit out a third program until medium-term debt sustainability and progress on reforms can be assured. While initially overshadowed by macro developments, European earnings releases have been healthy and earnings expectations for full-year 2015 have proven far more resilient to date than in most other regions, with Japan an obvious exception. Meanwhile, UK equities (2.5%) slightly outperformed US equivalents in local currency terms, but weaker earnings results, particularly across the materials sector, proved a drag.
Japanese equities (1.7%) enjoyed more muted gains after a very strong first half, as concerns about China weighed on Asian markets broadly. July’s result likely speaks to foreign investor caution toward Asian risk assets in general on the one hand and to supportive fundamentals and technicals on the other. Regarding the latter, earnings growth expectations for Japan’s fiscal year ending March 2016 have actually accelerated since the start of the year, and Japanese pensions’ diversification into equities continues.
Emerging markets equities (-4.3%) sold off in July as developments in China and related commodity markets spooked investors, refocusing them on the myriad challenges currently facing many developing economies today as well as falling earnings growth expectations. The Chinese government’s extraordinary measures to stave off the ongoing rout included allocating a state-run trading firm up to CNY 3 trillion in borrowing power, but the overvalued A-share market still dropped 15% in July. Investor confidence appears to be rattled by not just recent market volatility and macro weakness, but also the more existential fear that authorities may no longer be able to smoothly manage China’s economic transition. These concerns also helped trigger losses across emerging markets in July, as did a generally weak earnings season and further downgrades. Markets with close trade ties to China were especially hit, including smaller Asian exporters and certain commodity exporters. Emerging markets currencies also suffered amid renewed US$ strength, leading to further losses for foreign and, particularly, dollar-based investors.
Global government bonds (1.3%) enjoyed positive results for the month amid renewed risk aversion and as technical pressures somewhat abated. US Treasuries (0.8%), particularly long-term bonds, recovered a portion of their sizable second quarter losses, as did UK gilts (1.6%) and EMU sovereigns (2.3%). US investment-grade corporate credits (0.7%) also generated gains, while US high-yield bonds (-0.6%) suffered losses as falling commodity prices and thin liquidity triggered sharply higher spreads for energy and mining issuers. US tax-exempt bonds (0.7%) enjoyed small positive returns in spite of Puerto Rico’s looming debt default. The US Treasury yield curve continues to flatten, driven primarily by rising short rates in growing anticipation of Fed “liftoff,” while long rates have eased somewhat in response to subdued growth and inflation expectations.
The US dollar (2.0%) strengthened against all major currencies (and most emerging markets currencies) as market expectations grew for a first US interest rate hike before year-end. Rising differentials in economic growth and interest rates across economies and regions will likely drive further currency moves going forward. The currencies of major commodity exporters such as Australia and Canada, where growth is faltering due to falling demand for natural resources, were particularly weak.
Inflation-sensitive assets experienced a volatile month with divergent outcomes. The combination of renewed dollar strength, record production, and heightened fears regarding China’s growth outlook suggest supply/demand imbalances will persist. Commodities (-10.6% based on the Bloomberg Commodity Total Return Index) sold off across the complex, and spot prices fell to lows last seen during the global financial crisis, led by falling energy and metals prices. The prices of WTI and Brent dropped below $50 and $55, respectively, giving back all of their second quarter gains. Gold prices (-6.4%) also participated in the downdraft as investors anticipated higher interest rates and demand proved nonexistent. Natural resources equities (-6.2%) suffered in sympathy, with weak results from global integrated firms setting the tone. Energy MLPs (-3.2%) also declined amid indications some may need to reduce distribution payments. US REITs (5.0%) proved more resilient as recent losses (and lower Treasury yields) enhanced the optical appeal of their yields.
Though business activity in much of the developed world remains in expansion mode, Chinese manufacturing is contracting, raising concerns about the country’s growth outlook

Manufacturing PMIs
August 31, 2014 – July 31, 2015
Sources: Markit Economics and Thomson Reuters Datastream.
Note: A reading above 50 implies expansion of activity; below 50 implies contraction.
The combination of a stronger dollar, global supply glut, and a weaker Chinese growth outlook led commodities and commodity-related assets to suffer pronounced losses in July, as they have since June 2014
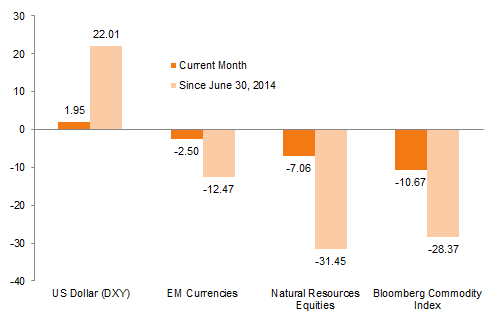
Commodity Selloff
As of July 31, 2015 • US Dollar
Sources: Bloomberg L.P., J.P. Morgan Securities, Inc., MSCI Inc., and Thomson Reuters Datastream. MSCI data provided “as is” without any express or implied warranties.
Notes: The DXY Index measures the value of the US dollar relative to a basket of other developed markets currencies. Emerging markets currencies are measured by the J.P. Morgan ELMI+ Index and natural resources equities are measured by the MSCI World Natural Resources Index.
Earnings growth estimates have generally been downgraded; however, strong EMU earnings growth expectations have proven resilient, and estimates for Japanese equities have been upgraded

Earnings Growth Expectations
2015 • Percent (%)
Source: J.P. Morgan Securities, Inc.
Note: Japan EPS growth estimates are for its fiscal years ending March 2016.
US market breadth has greatly diminished since 2013; year-to-date just ten stocks concentrated in the consumer discretionary, health care, and IT sectors have contributed nearly three-quarters of the S&P’s return
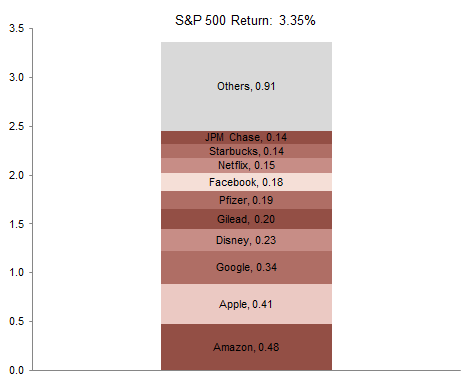
Year-to-Date Contribution of Top Ten Stocks to S&P Total Return
As of July 31, 2015 • Percent (%)
Sources: FactSet Research Systems and Standard & Poor’s.
US equities outperformed developed and emerging markets equivalents as a strong dollar weighed on returns of unhedged exposures to international equities for dollar-based investors. Commodities and emerging markets equities suffered steep losses. Meanwhile, US investment-grade bonds recovered some of their second quarter losses as investors sought more defensive positioning
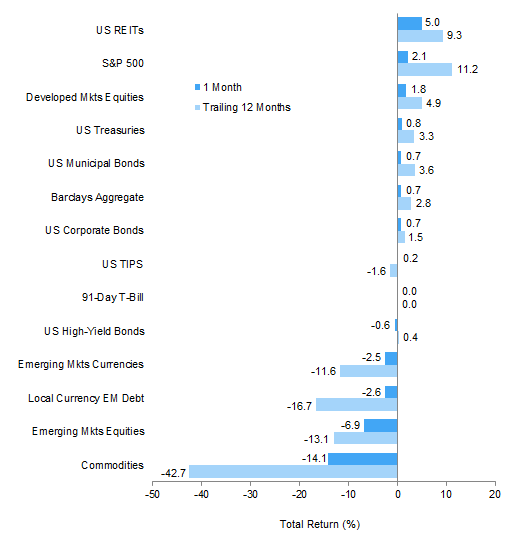
Index Performance (US$)
As of July 31, 2015

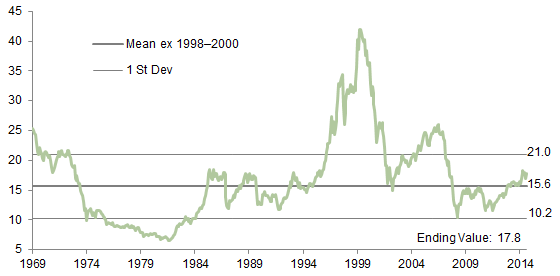
MSCI US Composite Normalized P/E
December 31, 1969 – July 31, 2015
Sources: Barclays, BofA Merill Lynch, FTSE International Limited, J.P. Morgan Securities, Inc., MSCI Inc., National Association of Real Estate Investment Trusts, Standard & Poor’s, and Thomson Reuters Datastream. MSCI data provided “as is” without any express or implied warranties.
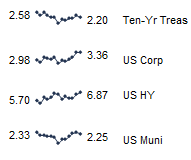
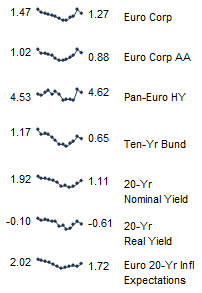
Fixed Income Yields
July 2014 – July 2015
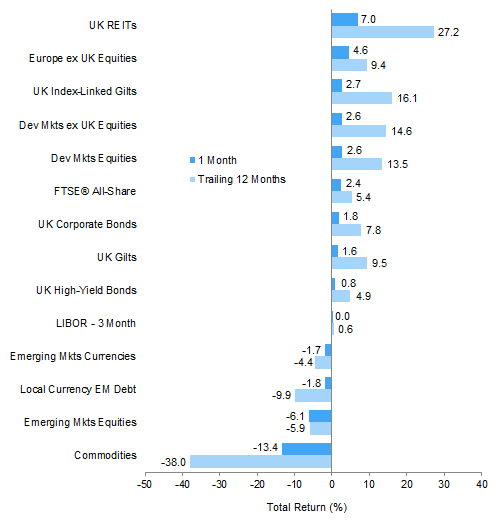
Euro-based investors enjoyed strong gains across equity market allocations as EMU stocks rallied when Greece avoided default, and international developed equity exposures benefitted from euro weakness versus the US dollar. At the same time, commodities and related assets suffered steep losses. European sovereign bonds and REITs rallied due to falling interest rates, recovering some of their second quarter losses

Index Performance (€)
As of July 31, 2015
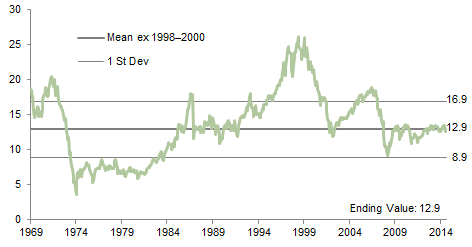
MSCI Europe ex UK Composite Normalized P/E
December 31, 1969 – July 31, 2015
Sources: Barclays, Bloomberg L.P., BofA Merill Lynch, Citigroup Global Markets, EPRA, FTSE International Limited, MSCI Inc., J.P. Morgan Securities, Inc., National Association of Real Estate Investment Trusts, Standard & Poor’s, and Thomson Reuters Datastream. MSCI data provided “as is” without any express or implied warranties.
Fixed Income Yields
July 2014 – July 2015
UK investors saw international developed markets stocks and bonds generally outperform local equivalents on the back of pound weakness. UK investment-grade bonds recovered some of their second quarter losses. Commodities and related assets suffered
Index Performance (₤)
As of July 31, 2015
MSCI UK Composite Normalized P/E
December 31, 1969 – July 31, 2015
Sources: Bank of England, Barclays, BofA Merrill Lynch, EPRA, FTSE International Limited, J.P. Morgan Securities, Inc., MSCI Inc., National Association of Real Estate Investment Trusts, Standard & Poor’s, and Thomson Reuters Datastream. MSCI data provided “as is” without any express or implied warranties.

Fixed Income Yields
July 2014 – July 2015
July saw the dollar resume its march higher after experiencing a soft patch in the second quarter. Currencies of emerging and developed markets commodity exporters proved particularly vulnerable to renewed dollar strength
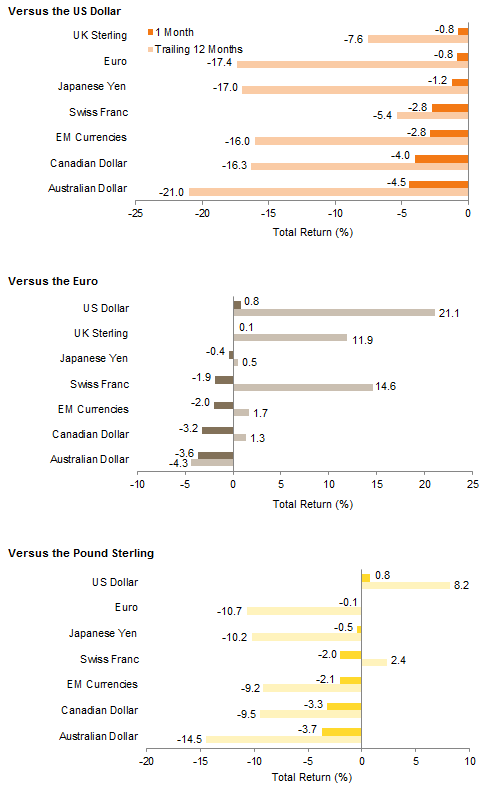
Currency Performance
As of July 31, 2015
Sources: MSCI Inc. and Thomson Reuters Datastream. MSCI data provided “as is” without any express or
implied warranties.
Note: EM currencies is an equal-weighted basket of 20 currencies.
Exhibit Notes
Performance Exhibits
Total returns for MSCI developed markets indexes are net of dividend taxes. Total returns for MSCI emerging markets indexes are gross of dividend taxes.
US dollar index performance chart includes performance for the Barclays Aggregate Bond, Barclays Corporate Investment Grade, Barclays High Yield Bond, Barclays Municipal Bond, Barclays US TIPS, Barclays US Treasuries, BofA Merrill Lynch 91-Day Treasury Bills, FTSE® NAREIT All Equity REITs, J.P. Morgan ELMI+, J.P. Morgan GBI-EM Global Diversified, MSCI Emerging Markets, MSCI World, S&P 500 and S&P GSCI™ indexes.
Euro index performance chart includes performance for the Barclays Euro-Aggregate: Corporate, Barclays Pan-
Euro High Yield, Citigroup EMU Govt Bonds, EURIBOR 3M, FTSE® EPRA/NAREIT Europe ex UK RE, J.P. Morgan ELMI+, J.P. Morgan GBI-EM Global Diversifi ed, MSCI Emerging Markets, MSCI Europe, MSCI Europe ex UK, MSCI World ex EMU, MSCI World, and S&P GSCI™ indexes.
UK sterling index performance chart includes performance for the Barclays Sterling Aggregate: Corporate Bond,
BofA Merrill Lynch Sterling High Yield, FTSE® All-Share, FTSE® British Government All Stocks, FTSE® British Government Index-Linked All Stocks, FTSE® EPRA/NAREIT UK RE, J.P. Morgan ELMI+, J.P. Morgan GBI-EM Global Diversified, LIBOR 3M GBP, MSCI Emerging Markets, MSCI Europe ex UK, MSCI World, MSCI World ex UK, and S&P GSCI™ indexes.
Valuation Exhibits
The composite normalized P/E ratio is calculated by dividing the inflation-adjusted index price by the simple average of three normalized earnings metrics: ten-year average real earnings (i.e., Shiller earnings), trend-line earnings, and return on equity–adjusted earnings. We have removed the bubble years 1998–2000 from our mean and standard deviation calculations. All data are monthly.
Fixed Income Yields
US fixed income yields reflect Barclays Municipal Bond Index, Barclays US Corporate High Yield Bond Index, Barclays US Corporate Investment-Grade Bond Index, and the ten-year Treasury.
European fixed income yields reflect the BofA Merrill Lynch Euro Corporate AA Bond Index, BofA Merrill Lynch Euro Corporate Bond Index, Barclays Pan-European Aggregate High Yield Bond Index, Bloomberg Twenty-Year European Government Bond Index (nominal), ten-year German bund, twenty-year European Inflation Swaps (inflation expectations), and the real yield calculated as the difference between the inflation expectation and nominal yield.
UK sterling fixed income yields reflect the BofA Merrill Lynch Sterling Corporate AA Bond Index, BofA Merrill Lynch Sterling Corporate Bond Index, UK ten-year gilts, and Bank of England twenty-year nominal, real, and zero coupon (inflation expectations) yields.