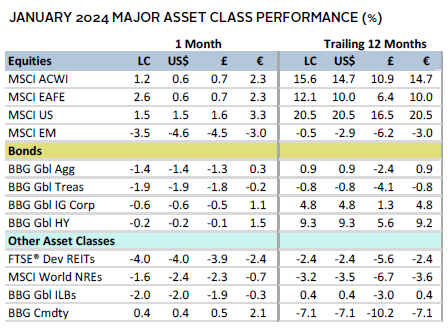
Equity markets continued to climb in January, led by developed markets (DM) equities, where Japan and Europe ex UK outperformed. US equities also notched several all-time highs over the month. Emerging markets (EM) equities lagged with continued weakness in China. Investor’s preferences for large caps and growth equities returned in January. However, bond markets were unable to hold on to the euphoria seen in late 2023 as investors pared down expectations for policy rate cuts, pushing yields back up. Lower duration high-yield (HY) assets led their investment-grade (IG) counterparts. Commodities fared better than in recent months, as oil gained on fears of supply disruptions in the Middle East. The US dollar and UK sterling gained, the yen declined, and the euro was mixed.
Sources: Bloomberg Index Services Limited, Bloomberg L.P., EPRA, FTSE International Limited, MSCI Inc., National Association of Real Estate Investment Trusts, and Thomson Reuters Datastream. MSCI data provided “as is” without any express or implied warranties.
Note: Local currency returns for the Bloomberg fixed income indexes, the Bloomberg Commodity Index, and the FTSE® Developed REITs are in USD terms.
The Macro Picture
Economic data and central bank commentary muted expectations of imminent policy rate cuts in most DMs, pushing yields higher. After a sharp repricing in Q4 to reflect sooner than previously anticipated monetary easing, central bankers attempted to steer markets away from premature policy rate cuts. They noted that inflation rates remained above target and further evidence of sustained moderation was needed prior to any easing. In the United States, December employment and Q4 GDP data beat expectations, while both major core inflation readings continued to slow, reinforcing the potential for a soft landing. In the Eurozone, investor optimism tempered as the German economy contracted in Q4 and sentiment indicators weakened. Even though Eurozone composite flash PMI data for January improved to a six-month high, it remained in contractionary territory. Shipping disruptions in the Red Sea also weighed on Europe’s manufacturing sector as freight rates soared, reminding markets that inflationary threats remain. Similarly, the UK inflation rate rose unexpectedly for the first time in ten months.
Meanwhile, investor sentiment toward China deteriorated further, bringing the cumulative losses since the 2021 peak in China’s and Hong Kong’s equity markets to $6 trillion. Eager to instill investor confidence, the government signaled support mechanisms for the stock market, including restrictions on short sales. The People’s Bank of China also surprised markets by announcing plans to reduce its reserve ratio requirements to encourage lending to small businesses and agriculture, in effect injecting approximately $140 billion of capital into the economy. While this led to a brief rally, Chinese equities still ended the month down 10.4%. Investors have generally been disappointed by Beijing’s targeted stimulus measures to date, with policymakers hesitant to unleash wider fiscal and monetary stimulus.
Equities
US equities trailed the broad market despite touching several all-time highs during the month. Investors became optimistic that a soft landing was achievable, given a slew of robust economic updates. Market performance and earnings growth were highly concentrated. Contribution from high-growth technology stocks significantly tempered the expected declines in Q4 earnings from a double-digit drop to -1.4%. As such, large-cap and growth stocks outperformed their counterparts. Despite a strong run over the last two months, interest rate–sensitive real estate stocks lagged, reacting negatively to higher rate expectations.
Preliminary Q4 GDP data revealed that economic growth remained healthy at 3.3% annualized, well above expectations of nearly 2%, aided by strong growth in consumer spending, government investments, and rising exports. Higher-than-anticipated job openings pointed to a still robust labor market, while headline CPI at 3.4% year-over-year (YOY) was also slightly above expectations. However, the Federal Reserve’s preferred measure of inflation, the core Personal Consumption Expenditures Price Index, increased by just 2.9% YOY, the smallest increase since March 2021. Investors reacted to the overall strong economic data by paring down the odds of a policy rate cut in March from nearly 90% to about 50%, modestly pushing the ten-year US Treasury yield higher. Unsurprisingly, the Fed held its rate steady at the January meeting, stating inflation was still too high and that a cut at its March meeting was unlikely.
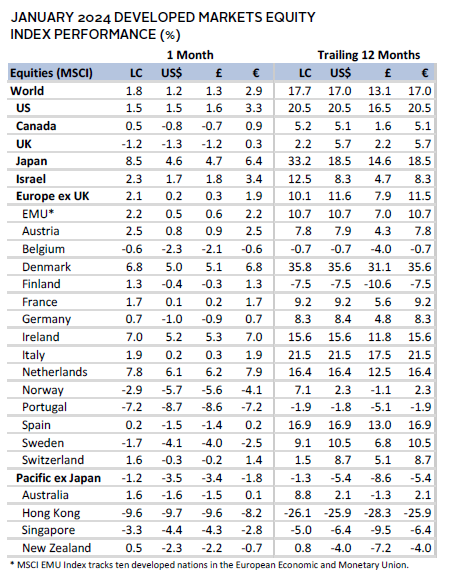
European equities lagged the broader DM index, with Europe ex UK outperforming UK equities.
The Eurozone economy avoided a recession in Q4, which surprised markets, given the region’s largest economy (Germany) had declined sharply in Q4. The bloc was buoyed by encouraging growth from Spain and Italy. The European Central Bank (ECB) held rates steady at its January meeting, warning that premature rate cuts could cause inflation to rise again and highlighted that their approach remained data dependent. Nevertheless, comments around early signs of slowing wage growth were perceived to be dovish, suggesting that rate cuts could start as early as April. Indeed, at month end, markets were discounting a 25-basis point (bp) cut in April. Europe is especially vulnerable to recent shipping disruptions in the Red Sea, as it relies heavily on the route for access to Asian imports and Middle Eastern oil. Supply chain pressures have led to a threefold increase on some freight rates, adding fodder to the uncertain inflation outlook.
UK equities lagged as it became clear that the country would be among the last of the major DMs to cut policy rates this year. Headline inflation unexpectedly rose for the first time in ten months to 4.0% YOY, with core inflation still above 5%. This forced investors to delay rate cut expectations, contributing to the nearly 40-bp increase in ten-year yields. While preliminary PMI data showed that the services sector had improved, pushing overall economic activity to a seven-month high, the manufacturing sector contracted again. Still, surveys show confidence has improved, as January’s shop prices rose at the slowest annual pace since May. Investors also became more hopeful for the economy to achieve a soft landing as November month-over-month (MOM) GDP growth beat expectations.
Japanese equities led DM counterparts in both local currency and US dollar terms, hitting a 34-year high, supported by strong performance from the consumer discretionary and industrials sectors. Investors were also encouraged by corporate profit growth driven by increased domestic demand. The Bank of Japan (BOJ) signaled a greater likelihood of normalizing its ultra-easy monetary policy following its January meeting because of higher confidence that inflation shall stabilize at or above its target rate of 2%. This update came on the heels of Japan’s core inflation rate decreasing slightly in December to 2.3% YOY. Economic data also disappointed, with both retail sales and industrial production coming in below expectations, adding some risk to expectations that the BOJ would raise rates as early as April 2024.
Pacific ex Japan equities underperformed DM markets. Within the region, the Australian market outperformed as the Q4 headline inflation rate slowed more than anticipated to 4.1% YOY. This increased investor confidence that the Reserve Bank of Australia would hold rates steady at its next meeting and could begin cutting rates in August. In New Zealand, the 4.7% YOY CPI in Q4 remains above the Reserve Bank of New Zealand’s target range of 1% to 3%. There were no updates to the central bank’s forecast of keeping its monetary policy restrictive until Q4 this year, having cited strong demand as a continued source of inflationary pressure at their prior meeting. Hong Kong equities lagged materially with the Hang Seng Index closing at a loss for the fifth time in the last six months. Foreign investors continue to exit the market en masse as Chinese property sector fears mount.
Sources: MSCI Inc. and Thomson Reuters Datastream. MSCI data provided “as is” without any express or implied warranties.
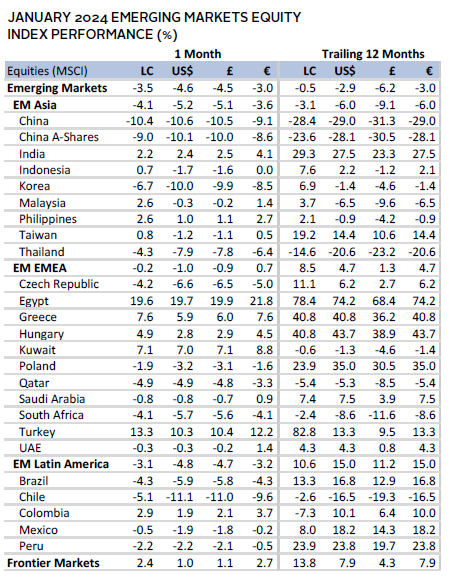
Emerging markets equities underperformed DM again. Although China was the primary laggard, all major regions declined. Within Europe, the Middle East & Africa, Turkey performed well on continued efforts to combat its 65% inflation by raising the policy rate 2.5 percentage points to 45%. In Latin America, Brazilian equities and currency values declined as its president unveiled more spending on reindustrialization, threatening to worsen its ballooning budget deficit. In Asia, Korea lagged despite a strong rebound in semiconductor exports, which jumped the most since 2017, and manufacturing PMIs definitively entered expansionary territory for the first time since mid-2022. Taiwan similarly benefited from positive sentiment on chips demand. Taiwan’s presidential election result in January suggests no change in stance on strained relations with China.
Chinese equities suffered as investors were disappointed by the estimated 5.2% GDP growth in 2023, despite it beating government guidance. Sentiment soured in part due to ongoing property sector malaise, especially as Evergrande was ordered to liquidate. Investors became more skeptical on the growth outlook, given economic benefits from reopening have already played out and the population declined again last year. Stimulus measures to support the property sector, stock market, and small businesses were unable to sustain upward momentum in equity markets. Investors are looking for further monetary easing to revive the stock market and economy, although the government has stated it will likely wait for the United States to cut its policy rate first. January private manufacturing PMI data, while unchanged, was encouraging, with improvements in output, 12-month production outlook reaching a nine-month high, and an increase in new exports for the first time in seven months.
Sources: MSCI Inc. and Thomson Reuters Datastream. MSCI data provided “as is” without any express or implied warranties.
Fixed Income
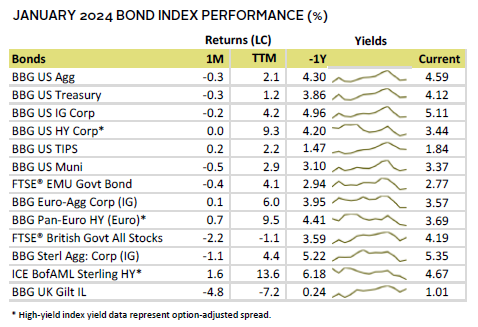
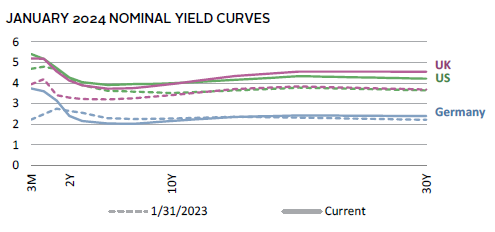
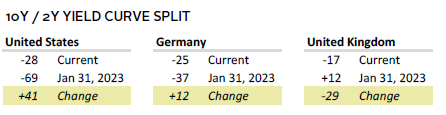
US fixed income assets mostly declined, reversing course from the stellar Q4 returns as investors reassessed the timing of Fed rate cuts. Strong economic data and a more hawkish tone from the Fed at its January meeting led investors to delay expectations for a rate cut. Robust economic data also translated to a higher inflation breakeven rate versus December, resulting in outperformance by US TIPS—an instrument designed to protect investors against inflation. Yields were modestly higher and weighed on returns, with the ten-year yield rising more than the two-year, narrowing the spread between the tenures to -28 bps. Six-month and one-year Treasury yields were the exception in the curve, having declined as investors priced out additional rate hikes. HY corporate bonds outperformed their IG counterparts. Spreads for HY bonds declined more than 75 bps YOY, whereas yields for IG corporate bonds rose by 15 bps.
UK fixed income assets mostly declined, with HY bonds being the exception. Investors similarly repriced the timing of Bank of England rate cuts, driving yields higher. In fact, the United Kingdom is expected to cut later than its DM counterparts, as inflation unexpectedly rose again and remains higher than its peers. Ten-year gilt yields increased nearly 40 bps to 3.96%, modestly lower than the two-year bonds at 4.12%. The spread between the ten- and two-year gilts barely changed this month. European government bonds also faltered, but corporate bonds performed well, with IG bonds even managing a positive return. German ten-year bund yields modestly increased by 13 bps to 2.16%, while the two-year yield was largely unchanged.
Sources: Bank of England, Bloomberg Index Services Limited, Federal Reserve, FTSE Fixed Income LLC, FTSE International Limited, Intercontinental Exchange, Inc., and Thomson Reuters Datastream.
Real Assets
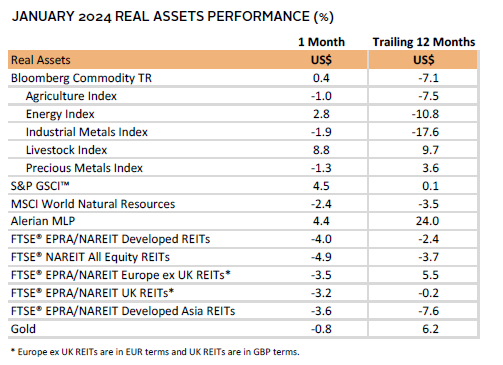
Real assets were mixed in January, as markets digested several crosscurrents. Shipping route disruptions in the Red Sea boosted oil prices, but higher bond yields held back gold prices despite escalating geopolitical tensions. Lackluster sentiment on the Chinese economic outlook weighed on commodity futures for most of the month.
Oil prices ($81.71 for Brent and $75.85 for WTI—both up 6%) recovered in January with Brent prices revisiting $80 oil after nearly a month below that level. Shipping disruptions in the Red Sea were a key driver of the pricing boost, as rerouting tankers to the Cape of Good Hope in South Africa added to transport times and cost. Colder weather in the United States also led to increased demand and localized supply disruptions, boosting prices.
Global natural resources equities declined despite modest increases in some resources prices as investors focused on disappointing Q4 growth in China. Earnings news also weighed on the index, as reports indicated that energy and materials companies posted the worst growth of all sectors in terms of both revenues and earnings.
REITs performance took a breather from the prior two months of stellar returns, with the DM index retreating in January. Bond yields pushed higher as investors pared down expectations of policy rate cuts in DMs, weighing on the interest rate–sensitive sector.
Gold prices ($2,048.35) also came under pressure due to higher yields, offsetting the price gains typically seen in times of geopolitical turmoil. The yellow metal also struggled as the US dollar strengthened.
Sources: Alerian, Bloomberg L.P., EPRA, FTSE International Limited, Intercontinental Exchange, Inc., MSCI Inc., National Association of Real Estate Investment Trusts, Standard & Poor’s, and Thomson Reuters Datastream. MSCI data provided “as is” without any express or implied warranties.
Note: Gold performance based on spot price return.
USD-Based Investors
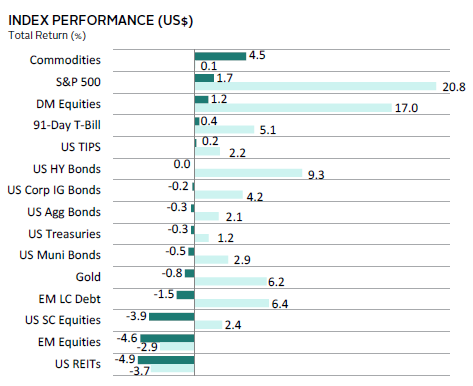
Risk assets were mostly down in January. Commodities led on supply chain disruptions in the Middle East. DM equities outperformed EM, with strong performance from Japan, while the United States reached all-time highs during the month. EM suffered as China posted steep declines on disappointing growth. US outperformance was driven by strong economic data and for large-cap technology-related stocks. Investors drove yields higher as strong economic data and a more hawkish tone from the the Fed at its January meeting implied that rate cuts would be delayed. Higher yields drove underperformance for bonds and gold. US REITs materially lagged as higher yields also weighed on this interest rate–sensitive sector.
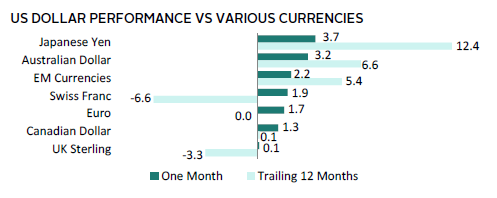
The US dollar broadly advanced as investors delayed expectations of interest rate cuts. This pushed yields higher, improving the interest rate differential to favor the US dollar versus most other currencies. It gained most versus the Japanese yen and Australian dollar among the major global currencies we track. Over the last 12 months, the US dollar declined versus the Swiss franc and UK sterling.
Preliminary Q4 GDP data revealed that economic growth remained healthy at 3.3% annualized, beating expectations of 1.8%, aided by growth in consumer spending, government investments, and exports. Data pointed to a robust labor market, while headline CPI at 3.4% YOY was also above expectations. However, the Fed’s preferred measure of inflation, the core Personal Consumption Expenditures Price Index, increased by 2.9% YOY, the smallest increase since March 2021. Investors reacted by paring the odds of a policy rate cut in March from nearly 90% to about 50%, modestly pushing the ten-year US Treasury yield higher. Unsurprisingly, the Fed held its rate steady at the January meeting, stating inflation was still too high and that a cut in March was unlikely.
Sources: Bloomberg Index Services Limited, FTSE International Limited, Frank Russell Company, Intercontinental Exchange, Inc., J.P. Morgan Securities, Inc., MSCI Inc., National Association of Real Estate Investment Trusts, Standard & Poor’s, and Thomson Reuters Datastream. MSCI data provided “as is” without any express or implied warranties.
EUR-Based Investors
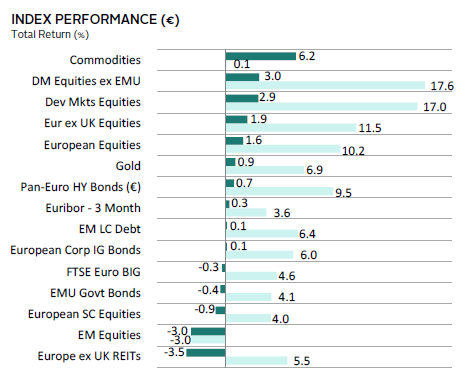
Risk assets were mixed in January. Commodities led on concerns of supply chain disruptions from the Middle East. DM equities outperformed EM, led by strong performance from Japanese equities. EM equities lagged on steep declines in China. Europe ex UK REITs were among the worst-performing asset classes as higher yields weighed on this interest rate–sensitive sector. Higher yields also caused EMU government bonds to underperform. Within fixed income, HY bonds led performance as spreads narrowed. Cash also outperformed, given its lower duration and higher yield levels today, while gold climbed due to heightened geopolitical risks and US dollar strength.
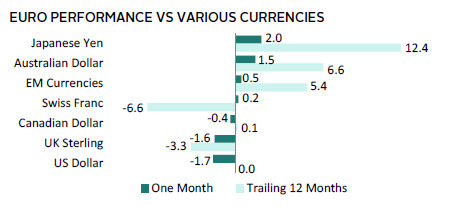
The euro was mixed, gaining the most versus the Japanese yen and Australian dollar and declining the most vis-à-vis the US dollar and UK sterling. Over the last 12 months, the euro was mostly stronger, declining only relative to the Swiss franc and UK sterling.
The Eurozone economy avoided a recession in Q4, which surprised markets, given the region’s largest economy (Germany) had declined sharply in Q4. The bloc was buoyed by encouraging growth from Spain and Italy. The ECB held rates steady at its January meeting, warning that premature rate cuts could cause inflation to rise again and highlighted that their approach remained data dependent. Nevertheless, comments around early signs of slowing wage growth were perceived to be dovish, suggesting that rate cuts could start as early as April. Indeed, at month end, markets were discounting a 25-bp cut in April. Europe is especially vulnerable to recent shipping disruptions in the Red Sea, as it relies heavily on the route for access to Asian imports and Middle Eastern oil. Supply chain pressures have led to a threefold increase on some freight rates, adding fodder to the uncertain inflation outlook.
Sources: Bloomberg Index Services Limited, EPRA, European Banking Federation, FTSE Fixed Income LLC, FTSE International Limited, Intercontinental Exchange, Inc., J.P. Morgan Securities, Inc., MSCI Inc., National Association of Real Estate Investment Trusts, Standard & Poor’s, and Thomson Reuters Datastream. MSCI data provided “as is” without any express or implied warranties.
GBP-Based Investors
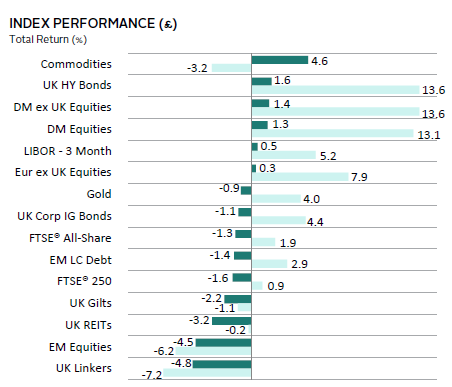
Risk assets were mostly down in January. Commodities led on concerns of supply chain disruptions from the Middle East. UK HY bonds led fixed income by a strong margin as spreads contracted materially on a YOY basis and investors increased bets that a soft landing may be achievable. DM equities outperformed EM, with Japan leading, while China posted steep declines. UK REITs were among the bottom-performing asset classes, as higher yields weighed on this interest rate–sensitive sector. Higher yields also led to a reversal of the strong returns enjoyed by UK linkers in prior months, coming in as the worst-performing asset class. Gold was also weaker on higher yields despite heightened geopolitical risk. Cash was among the better performers, given its lower duration and higher yield levels today.
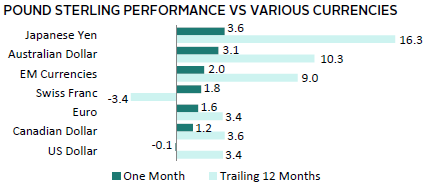
UK sterling was mostly positive, declining marginally only versus the US dollar. Similarly, over the last 12 months the UK sterling mostly strengthened, save for against the Swiss franc. Relatively tighter monetary policy has resulted in interest rate differentials supportive of the UK sterling.
Headline inflation unexpectedly rose for the first time in ten months to 4.0% YOY, with core inflation still above 5%. It became clear that the country would be among the last of the major DMs to cut policy rates this year. This forced investors to delay rate cut expectations, contributing to the nearly 40-bp increase in ten-year yields. While preliminary PMI data showed that the services sector had improved, pushing overall economic activity to a seven-month high, the manufacturing sector contracted again, due in part to Red Sea–related supply disruptions. Still, surveys show confidence has improved, as January’s shop prices rose at the slowest annual pace since May. Investors also became more hopeful for the economy to achieve a soft landing as November MOM GDP growth beat expectations.
Sources: Bloomberg Index Services Limited, EPRA, FTSE International Limited, Intercontinental Exchange, Inc., J.P. Morgan Securities, Inc., MSCI Inc., National Association of Real Estate Investment Trusts, Standard & Poor’s, and Thomson Reuters Datastream. MSCI data provided “as is” without any express or implied warranties.
Performance Exhibits
All data are total returns unless otherwise noted. Total return data for all MSCI indexes are net of dividend taxes.
USD-Based Investors index performance chart includes performance for the Bloomberg US Aggregate Bond, Bloomberg US Corporate Investment Grade, Bloomberg US High Yield Bond, Bloomberg Municipal Bond, Bloomberg US TIPS, Bloomberg US Treasuries, ICE BofAML 91-Day Treasury Bills, FTSE® NAREIT All Equity REITs, J.P. Morgan GBI-EM Global Diversified, LBMA Gold Price, MSCI Emerging Markets, MSCI World, Russell 2000®, S&P 500, and S&P GSCI™ indexes.
EUR-Based Investors index performance chart includes performance for the Bloomberg Euro-Aggregate: Corporate, Bloomberg Pan-Euro High Yield (Euro), EURIBOR 3M, FTSE EMU Govt Bonds, FTSE Euro Broad Investment-Grade Bonds, FTSE® EPRA/NAREIT Europe ex UK RE, J.P. Morgan GBI-EM Global Diversified, LBMA Gold Price AM, MSCI Emerging Markets, MSCI Europe, MSCI Europe ex UK, MSCI Europe Small-Cap, MSCI World ex EMU, MSCI World, and S&P GSCI™ indexes.
GBP-Based Investors index performance chart includes performance for the Bloomberg Sterling Aggregate: Corporate Bond, Bloomberg Sterling Index-Linked Gilts, ICE BofAML Sterling High Yield, FTSE® 250, FTSE® All-Share, FTSE® British Government All Stocks, FTSE® EPRA/NAREIT UK RE, J.P. Morgan GBI-EM Global Diversified, LBMA Gold Price AM, LIBOR 3M GBP, MSCI Emerging Markets, MSCI Europe ex UK, MSCI World, MSCI World ex UK, and S&P GSCI™ indexes.
EM currencies is an equal-weighted basket of 20 emerging markets currencies.
Fixed Income Performance Table
Performance data for US TIPS reflect the Bloomberg US TIPS Index, with yields represented by the Bloomberg Global Inflation Linked Bond Index: US.