Risk assets broadly advanced in January, continuing their fourth quarter rally after a difficult 2022. Global equities excelled, gaining similarly across the United States, developed markets ex US, and emerging markets; however, when converted to a consistent currency, emerging markets and developed markets ex US outperformed on US dollar weakness. Growth topped value for the first time in six months, and small caps outpaced large-cap peers. Bond markets rallied as inflation continued to soften in many major economies. Real asset categories mostly gained, although commodity prices overall were flat. The US dollar slid for the fourth straight month, UK sterling mostly appreciated, and the euro was mixed.

Sources: Bloomberg Index Services Limited, Bloomberg L.P., EPRA, FTSE International Limited, MSCI Inc., National Association of Real Estate Investment Trusts, and Thomson Reuters Datastream. MSCI data provided “as is” without any express or implied warranties.
Note: Local currency returns for the Bloomberg fixed income indexes, the Bloomberg Commodity Index, and the FTSE® Developed REITs are in USD terms.
The Macro Picture
Investor optimism in January was largely driven by softening inflation in the United States and Europe, which shifted expectations to a more dovish path for central bank policy rates. Some market participants are even predicting rate cuts before the end of the year. In fact, market-implied probabilities based on Fed Funds futures are now pricing in a more than 50% likelihood that the Federal Reserve will cut rates in 2023.
Investors took advantage of the improving outlook for Europe and emerging markets and redirected fund flows there at the expense of US equities. Robust economic data out of China following the end of its zero-COVID policy provided another reason for markets to be optimistic. Additionally, the International Monetary Fund (IMF) boosted its 2023 global GDP projections and increased its growth expectations for nearly every major economy. The outlook for a weaker US dollar also injected optimism into markets, as it should improve financial conditions for several global economies that were burdened by elevated energy and input prices in 2022.
However, not all market participants shared in the optimism in January. Bond markets for instance priced in lower real yields and equity analysts have lowered their estimates for CY2023 corporate growth earnings. Oil prices declined on the month, in part reflecting heightened uncertainty regarding the economic outlook. However, OPEC+ members kept their production targets unchanged shortly after month end, which will likely keep prices elevated. With core inflation still near multi-decade highs and central bank policy rate cuts far from certain, risks lurk among broader optimism.
Equities
US equities gained in January, on par with developed ex US counterparts, and have rebounded 14% since their trough in mid-October. Eight of 11 S&P 500 Index sectors advanced, led by growth-oriented and long-duration sectors, namely, consumer discretionary, communication services, real estate, and information technology; the defensive utilities, healthcare, and consumer staples sectors declined. This resulted in growth outperforming value by the third largest margin since the Global Financial Crisis. Small caps topped large caps and have now outperformed over a trailing 12-month period for the first time since 2021.
Shifting policy rate expectations were the main driver of performance. Softer inflation, weaker economic data, and a less hawkish tone from some members of the Federal Open Market Committee (FOMC) primed markets to lower their forward rate expectations. The first estimate of fourth quarter GDP growth also topped expectations at 2.9% annualized, but measures of underlying activity suggested demand was softer than indicated by the headline print. The market largely ignored other signals of ongoing economic contraction, such as retail sales declining faster than anticipated, industrial production falling again, and still-contractionary manufacturing and services purchasing manager index (PMI) data. Meanwhile, analysts dropped their expectations for fourth quarter earnings per share (EPS) growth by 2 percentage points (ppts) to -5% as early corporate earnings releases broadly disappointed. However, the labor market remained tight and consumer sentiment continued to improve. Shortly after month end, the Fed raised rates by 25 basis points (bps) as expected and remained resolved to continue its rate-hiking path to curtail inflation.
European equities gained the most since late 2020, topping broader developed markets. Europe ex UK outpaced UK peers, driven by Eurozone stocks, which outperformed UK equivalents for a fifth consecutive month in major currency terms.
Eurozone outperformance was supported by positive economic developments, as retail sales and industrial production bested expectations, consumer confidence improved, and composite PMI data unexpectedly turned expansionary for the first time in seven months. The first preliminary GDP reading indicated that the monetary union expanded by 0.1% in fourth quarter, topping expectations for a mild contraction. Headline inflation data continued to soften as energy prices fell due to lower demand from a warmer-than-usual winter, although at 9.2% year-on-year (YoY), inflation remains extraordinarily high relative to history. Headwinds remain as core CPI was slightly higher than predicted and corporate earnings growth expectations continue to slide.
UK equities underperformed on relatively softer economic data than their continental peers. Retail sales and industrial production continued declining, YoY headline and core inflation growth rates hardly changed—remaining well above other major developed markets—and PMI data indicated that the economy remained in contraction for the sixth consecutive month. The IMF now predicts the United Kingdom will be the only major economy to contract in 2023, citing “tighter fiscal and monetary policies and financial conditions and still-high energy retail prices weighing on household budgets.”
Japanese equities advanced but trailed broader developed markets. The Bank of Japan struck a dovish tone in its January policy meeting, expressing an outsized focus on market functioning and indicating that it will continue with large-scale Japanese government bond purchases to support its yield curve control policy and maintain its ultra-low policy rate. Headline CPI reached 4.0% YoY in Japan—its highest level in more than 40 years. However, inflation remains well below the levels seen in most other major developed countries, and Japan’s trade deficit narrowed in December, indicating that the impacts of a weaker yen and rising energy prices may be softening. Retail sales expanded faster than anticipated, activity in the services sector accelerated, and consumer confidence rose to its highest level in five months.
Pacific ex Japan equities gained but trailed broad developed markets. Australia was the sole outperformer, boosted by strong returns for materials companies—the country’s second largest sector. However, economic data releases painted a less optimistic picture, as inflation rose more than estimated, retail sales growth turned much more negative than forecast, and civilian employment unexpectedly declined. In neighboring New Zealand, Jacinda Ardern stepped down as prime minister in a surprise move, making way for the ruling Labour Party to elect Chris “Chippy” Hipkins as the new prime minister. Hipkins has focused economic policy on easing the mounting cost of living pressures. Quarter-over-quarter inflation growth slowed faster than anticipated in fourth quarter, and employment statistics weakened. Hong Kong advanced the least among Pacific ex Japan countries, anchored by the relatively anemic return in its financials sector, which makes up nearly half of the MSCI Hong Kong Index.

Sources: MSCI Inc. and Thomson Reuters Datastream. MSCI data provided “as is” without any express or implied warranties.
Emerging markets (EM) equities advanced in January, outpacing developed equivalents in major currency terms for the third consecutive month, driven in part by investor flows into EM stocks. The near-record pace of inflows, in part, reflects the growing sentiment among fund managers that developed markets (DM) central banks are slowing their rate-hiking cycles. Rising interest rates in developed markets have been a major pain point for emerging markets. In major currency terms, Latin America and emerging Asia outperformed the broad index, while emerging Europe, the Middle East and Africa trailed. Among major EM countries, China, Korea, and Taiwan outpaced the broad index; Brazil and Saudi Arabia advanced but trailed; and India declined. South Africa outperformed in local currency, but lagged in major currency terms, as the rand weakened due to ongoing economic challenges and a smaller-than-expected rate hike by the South African Reserve Bank.
Continued optimism from the end of China’s zero-COVID policy has propelled Chinese equities to over 50% above their recent lows at the end of October. Retail sales growth and industrial output both topped expectations in December, and fourth quarter YoY GDP growth was soundly above consensus estimates. Additionally, all three major categories of official PMI data moved into expansionary territory in January. Domestic China A shares were boosted by stimulative monetary policy and optimism around reopening, and outpaced broad EM stocks, posting a 15% gain since hitting their recent trough three months ago. The People’s Bank of China announced in late January that it would roll over lending tools and ramp up support for targeted sectors of the economy to help boost growth.

Sources: MSCI Inc. and Thomson Reuters Datastream. MSCI data provided “as is” without any express or implied warranties.
Fixed Income
US fixed income assets gained in January. Credit outpaced Treasuries, while investment-grade corporates edged high-yield peers. Yields fell across maturities, with the exception of ultra-short securities. Notably, the three-month cash rate rose 28 bps to 4.70%, reaching its highest level since 2007. Five- and ten-year Treasury yields declined 36 bps each, settling at 3.63% and 3.52%, respectively. This meant that the Fed’s preferred yield curve metric—the ten-year/three-month spread—sunk below -100 bps for the first time this cycle, an indicator strongly associated with an imminent recession. Real ten-year rates ended the month at their lowest level since August and were the key driver of the decline in equivalent nominal rates as implied inflation expectations held steady.
Sterling-denominated bond performance largely shadowed that of its US peers in January. Inflation-linked gilts were the exception, outperforming their nominal equivalents as inflation in the United Kingdom appears to be relatively more entrenched than in the United States and Eurozone for now. Five- and ten-year gilt yields shrank 37 bps and 32 bps to 3.21% and 3.41%, respectively. Euro-denominated bonds advanced, led by high-yield corporates. German ten-year bund yields fell 29 bps to 2.28% as the spread between German and Italian bonds tightened. Germany’s ten-year/two-year yield curve spread fell to its deepest negative reading in more than 30 years.


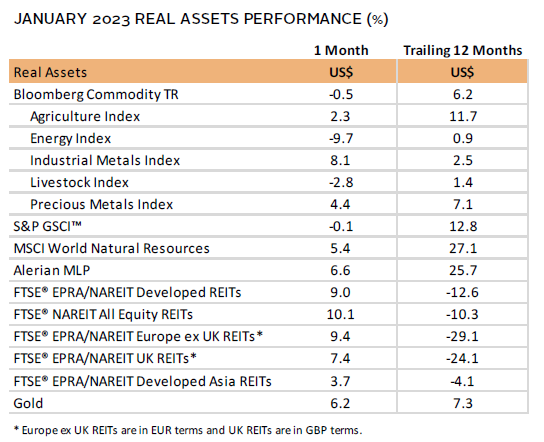
Real Assets
Commodity futures were relatively flat in January, as declines in energy prices were mostly offset by gains in precious and industrial metals. Copper and aluminum prices rose double digits on expectations of rising demand from China in its first full month since ending its zero-COVID policy. Natural gas was the largest detractor from index performance, declining more than 30% for a second consecutive month and impacted by Europe’s warmer winter.
Oil prices ($84.49 for Brent and $78.87 for WTI) declined slightly in January, reflecting conflicting signals. Positive demand implications from China’s reopening, rising expectations for a soft landing in the United States, and a weaker US dollar were not enough to outweigh broader economic uncertainty and fears of a potential recession. As expected, shortly after month end, OPEC+ announced that it would not change its oil production quota, choosing a wait-and-see approach to ongoing uncertainties.
Global natural resources equities and energy MLPs advanced in January, as they continued to report solid profits despite the background of falling energy prices and rising support for windfall taxes across some major economies.
Global REITs rebounded sharply in January but remained deeply in the red over the trailing 12 months. Falling bond yields and slowing inflation contributed to the recent rally.
Gold prices, supported by a weaker US dollar, continued to rally, accelerating to $1,928.19/troy ounce—the highest level since the early days of Russia’s invasion of Ukraine. Analysts expect demand to continue on trend with 2022, which experienced the largest purchases by retail investors and central banks since 2013 and 1967, respectively.
Sources: Alerian, Bloomberg L.P., EPRA, FTSE International Limited, Intercontinental Exchange, Inc., MSCI Inc., National Association of Real Estate Investment Trusts, Standard & Poor’s, and Thomson Reuters Datastream. MSCI data provided “as is” without any express or implied warranties.
Note: Gold performance based on spot price return.
USD-Based Investors
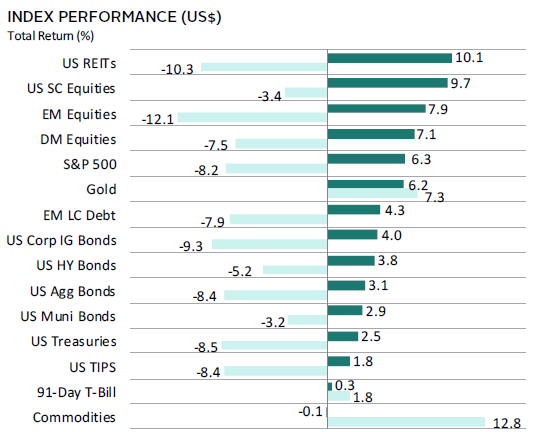
Risk assets advanced nearly across the board in January, continuing their fourth quarter rally after a difficult 2022. Equities outperformed, led by domestic small caps and emerging markets. Broad developed equities outpaced US peers. Among US fixed income securities, credit outpaced Treasuries, and investment-grade corporates edged high-yield equivalents. EM local currency debt topped all US bonds as the dollar weakened. Real assets were mixed—REITs gained the most, while commodities lagged all other asset classes as gains in precious and industrial metals were offset by declines in energy prices. Over the last 12 months, commodities, gold, and cash were the only major asset classes to gain.
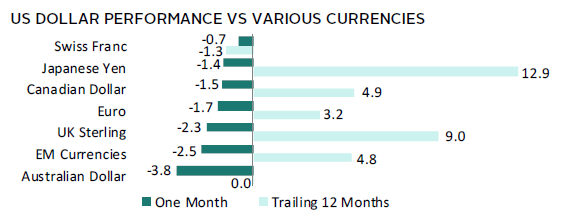
The US dollar slid for the fourth straight month, falling the most against commodity-linked Australian dollar and EM currencies. Despite the drawdown, the greenback strengthened broadly over the past year, appreciating the most against the Japanese yen and UK sterling and declining only vis-à-vis the safe-haven Swiss franc.
Shifting policy rate expectations among market participants were the main driver of performance. Softer inflation, weaker economic data, and a less hawkish tone from some members of the FOMC contributed to the market’s forward rate adjustments. The first estimate of fourth quarter GDP growth also topped expectations at 2.9% annualized, but measures of underlying activity suggested demand was softer than indicated by the headline print. Meanwhile, analysts dropped their expectations for fourth quarter EPS growth by 2 ppts to -5%, as early corporate earnings releases broadly disappointed. However, the labor market remained tight, exceeding expectations on multiple metrics, and consumer sentiment continued to climb.
Sources: Bloomberg Index Services Limited, FTSE International Limited, Frank Russell Company, Intercontinental Exchange, Inc., J.P. Morgan Securities, Inc., MSCI Inc., National Association of Real Estate Investment Trusts, Standard & Poor’s, and Thomson Reuters Datastream. MSCI data provided “as is” without any express or implied warranties.
EUR-Based Investors
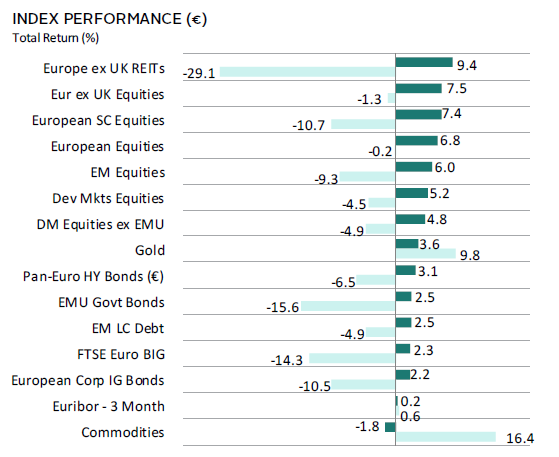
Risk assets advanced nearly across the board in January, continuing their fourth quarter rally after a difficult 2022. Equities outperformed, led by Europe ex UK and European small caps. EM equities outpaced DM peers. Among European fixed income securities, high-yield corporate bonds outpaced investment-grade peers, including both EMU government bonds and corporates. Real assets were mixed—REITs gained the most, while commodities lagged all other asset classes as gains in precious and industrial metals were offset by declines in energy prices. Over the last 12 months, commodities, gold, and cash were the only major asset classes to gain.
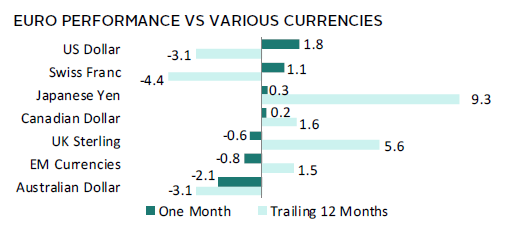
The euro was mixed in January, rising the most against the safe-haven US dollar and Swiss franc, while declining the most vis-à-vis commodity-linked Australian dollar and EM currencies. Over the last 12 months the common currency was also mixed, gaining the most vis-à-vis the Japanese yen and UK sterling and declining the most versus the Swiss franc.
Eurozone outperformance was supported by positive economic developments, as retail sales and industrial production bested expectations, consumer confidence improved, and composite PMI data unexpectedly turned expansionary for the first time in seven months. The first preliminary GDP reading indicated that the monetary union expanded by 0.1% in fourth quarter, topping expectations for a mild contraction. Headline inflation data continued to soften as energy prices fell due to lower demand from a warmer-than-usual winter, although at 9.2% YoY, inflation remains extraordinarily high relative to history. Headwinds remain as core CPI was slightly higher than predicted and corporate earnings growth expectations declined.
Sources: Bloomberg Index Services Limited, EPRA, European Banking Federation, FTSE Fixed Income LLC, FTSE International Limited, Intercontinental Exchange, Inc., J.P. Morgan Securities, Inc., MSCI Inc., National Association of Real Estate Investment Trusts, Standard & Poor’s, and Thomson Reuters Datastream. MSCI data provided “as is” without any express or implied warranties.
GBP-Based Investors
Risk assets advanced nearly across the board in January, continuing their fourth quarter rally after a difficult 2022. Equities outperformed, led by Europe ex UK and domestic mid caps. Domestic equities trailed DM ex UK peers. Among UK fixed income securities, credit outpaced gilts, and investment-grade corporates topped high-yield equivalents. Linkers outpaced nominal gilts as inflation in the United Kingdom appears to be relatively more entrenched than in the United States and Eurozone for now. Real assets were mixed—REITs gained the most, while commodities lagged all other asset classes as gains in precious and industrial metals were offset by declines in energy prices. Over the last 12 months, commodities, gold, and UK equities gained the most among major asset classes.
UK sterling mostly strengthened in January, appreciating the most versus the safe-haven US dollar and Swiss franc, and declining only vis-à-vis commodity-linked Australian dollar and EM currencies. Over the last 12 months, UK sterling mostly declined, falling the most against the Swiss franc and US and Australian dollars, while gaining only versus the beleaguered Japanese yen.
UK equities underperformed on relatively softer economic data than their continental peers. Retail sales and industrial production continued declining faster than expected, YoY headline and core inflation growth rates hardly changed, remaining well above other major developed markets, and PMI data indicated that the economy remained in contraction for the sixth consecutive month. The IMF now predicts the United Kingdom will be the only major economy to contract in 2023, citing “tighter fiscal and monetary policies and financial conditions and still-high energy retail prices weighing on household budgets.”


Sources: Bloomberg Index Services Limited, EPRA, FTSE International Limited, Intercontinental Exchange, Inc., J.P. Morgan Securities, Inc., MSCI Inc., National Association of Real Estate Investment Trusts, Standard & Poor’s, and Thomson Reuters Datastream. MSCI data provided “as is” without any express or implied warranties.
Performance Exhibits
All data are total returns unless otherwise noted. Total return data for all MSCI indexes are net of dividend taxes.
USD-Based Investors index performance chart includes performance for the Bloomberg US Aggregate Bond, Bloomberg US Corporate Investment Grade, Bloomberg US High Yield Bond, Bloomberg Municipal Bond, Bloomberg US TIPS, Bloomberg US Treasuries, ICE BofAML 91-Day Treasury Bills, FTSE® NAREIT All Equity REITs, J.P. Morgan GBI-EM Global Diversified, LBMA Gold Price, MSCI Emerging Markets, MSCI World, Russell 2000®, S&P 500, and S&P GSCI™ indexes.
EUR-Based Investors index performance chart includes performance for the Bloomberg Euro-Aggregate: Corporate, Bloomberg Pan-Euro High Yield (Euro), EURIBOR 3M, FTSE EMU Govt Bonds, FTSE Euro Broad Investment-Grade Bonds, FTSE® EPRA/NAREIT Europe ex UK RE, J.P. Morgan GBI-EM Global Diversified, LBMA Gold Price AM, MSCI Emerging Markets, MSCI Europe, MSCI Europe ex UK, MSCI Europe Small-Cap, MSCI World ex EMU, MSCI World, and S&P GSCI™ indexes.
GBP-Based Investors index performance chart includes performance for the Bloomberg Sterling Aggregate: Corporate Bond, Bloomberg Sterling Index-Linked Gilts, ICE BofAML Sterling High Yield, FTSE® 250, FTSE® All-Share, FTSE® British Government All Stocks, FTSE® EPRA/NAREIT UK RE, J.P. Morgan GBI-EM Global Diversified, LBMA Gold Price AM, LIBOR 3M GBP, MSCI Emerging Markets, MSCI Europe ex UK, MSCI World, MSCI World ex UK, and S&P GSCI™ indexes.
EM currencies is an equal-weighted basket of 20 emerging markets currencies.
Fixed Income Performance Table
Performance data for US TIPS reflect the Bloomberg US TIPS Index, with yields represented by the Bloomberg Global Inflation Linked Bond Index: US.