Most global assets experienced broad-based declines in January. Global equities suffered their worst month since March 2020; emerging markets held up better than developed counterparts but remain a significant laggard over the trailing 12-month period. Value and large caps outperformed growth and small-cap equivalents, respectively. Fixed income assets declined as nominal interest rates rose and markets continued to price in imminent central bank policy tightening. Energy-related assets were top performers as oil & gas prices spiked. Among currencies, the US dollar appreciated, the euro mostly depreciated, and UK sterling was mixed.

Sources: Bloomberg Index Services Limited, Bloomberg L.P., EPRA, FTSE International Limited, MSCI Inc., National Association of Real Estate Investment Trusts, and Thomson Reuters Datastream. MSCI data provided “as is” without any express or implied warranties.
Note: Local currency returns for the Bloomberg fixed income indexes, the Bloomberg Commodity Index, and the FTSE® Developed REITs are in USD terms.
The Macro Picture
January’s market turbulence was largely driven by rising interest rates, more persistent-than-expected inflation, and geopolitical tensions in Eastern Europe. Equity markets experienced substantial volatility, particularly in tech and other sectors heavily reliant on future earnings. Several major equity indexes approached or entered correction territory before paring some losses by month end. At the same time, fixed income securities offered little respite as yields turned sharply higher.
Markets continued to seek clarity about when—and to what degree—major central banks will tighten monetary policy. At this point, global policymakers have taken differing approaches to combat heightened inflationary risks. Federal Reserve Chairman Jerome Powell telegraphed that the Fed will all but certainly raise its benchmark interest rate in March and noted that the bank will be “nimble” about the path of future policy tightening. The Bank of England (BOE) is also turning more hawkish and is expected to announce a second consecutive rate hike in February. However, the European Central Bank (ECB) and Bank of Japan (BOJ) both opted to keep conditions loose for the foreseeable future.
Concerns about a potential Russian invasion of Ukraine prompted Western countries to consider wide-ranging economic and financial sanctions against Russia. The mounting tensions have contributed to higher oil prices and broader market volatility and represent an ongoing risk for global markets.
This risk—coupled with ongoing COVID concerns, inflationary pressures, and high debt levels—create many challenges for the year ahead. As IMF Chair Kristalina Georgieva put it, “2022 is like navigating an obstacle course.”
Equities
US equities tumbled in January, trailing developed ex US and emerging markets peers for the first time in four months. Notably, the tech-heavy NASDAQ composite and small-cap Russell 2000® indexes fared much worse than the S&P 500 Index, finishing the month in correction territory. Nine of 11 S&P 500 Index sectors declined, led down by consumer discretionary, real estate, and information technology; consumer staples fell the least, financials were flat, and energy advanced nearly 20%. Value stocks bested growth by the widest margin in more than 20 years, and now hold a strong lead over the last 12 months, a sharp reversal from late 2020, when growth set a record for its trailing 12-month outperformance. Similarly, large caps bested small-cap equivalents and now lead on a trailing 12-month basis by the most since 1999. S&P 500 earnings per share expanded 24% year-over-year in fourth quarter, based on a blend of the latest estimates and actual results from one-third of companies in the index.
US economic growth accelerated in fourth quarter. According to first preliminary estimate, US Real GDP increased at a 6.9% annualized rate, topping expectations. Growth was boosted by household spending on services and business investment, overcoming headwinds from a record trade deficit. However, economic activity cooled off in December as retail sales unexpectedly declined and consumer price inflation continued to accelerate. Preliminary PMI reports suggested activity in the services sector slowed to near contractionary territory in January, while manufacturing expanded less than expected. Still, the Fed signaled it was ready to begin raising interest rates in March as Chairman Powell said the central bank would “move steadily away from the very highly accommodative monetary policy” that has been in place to combat the pandemic.
European equities declined in aggregate but topped broader developed markets. Europe ex UK stocks declined, trailing the broad developed ex US index, while the United Kingdom advanced. UK equities now top Europe ex UK peers on a trailing 12-month basis for the first time since mid-2019.
Eurozone fourth quarter GDP missed expectations, growing 0.3% quarter-over-quarter based on preliminary estimates. Leading indicators offered little reprieve in January, as industrial confidence fell more than estimated, consumer confidence fell to multi-month lows, and economic confidence unexpectedly declined. Euro area inflation reached a new all-time high in December, prompting speculation that the ECB could tighten monetary policy sooner than planned; however, President Christine Lagarde quashed that notion, noting the central bank has “every reason not to act as quickly” as its US counterpart, since Europe trails the US economic recovery.
UK consumer price inflation reached its highest level in 30 years, reinforcing expectations that the BOE will impose its first back-to-back interest rate rises since 2004 in early February. The 5.4% year-over-year price increase in December was nearly three times the target rate of 2% set by the central bank and is more widespread across product categories than the BOE anticipated. Retail sales declined by more than expected in December, while preliminary January PMI figures showed a moderating economic expansion across both manufacturing and services.
Japanese equities declined for the month and underperformed all major developed markets countries and regions, save for the United States. Wholesale prices rose 8.5% year-on-year in December, the second highest increase since 1980. Consumer price inflation rose to 0.8%, its highest level since just before the onset of the pandemic, as companies started to pass on the rising input costs to consumers. The BOJ held its target interest rate steady at -0.1% and reaffirmed its commitment to ultra-loose monetary policy but revised its inflation projection upward for the upcoming fiscal year to 1.1%. Even so, the forecast is well below the central bank’s 2.0% target.
Pacific ex Japan equities declined but outperformed broad developed markets stocks. Hong Kong advanced in January and Singapore bested the broader index, while Australia and New Zealand lagged. New Zealand consumer inflation reached its highest level in more than three decades in fourth quarter, and the average house price across the island nation topped NZ$1M for the first time. The OECD encouraged New Zealand, which was one of the first central banks to begin tightening interest rates last year, to continue its tightening fiscal policy in the near term to combat the country’s overheating economy. Australian inflation grew faster than expected in fourth quarter and the unemployment rate fell to a 13-year low. The Reserve Bank of Australia (RBA) held interest rates steady but announced it would end its bond buying program on February 10, while simultaneously increasing inflation expectations and decreasing its GDP forecast for this year. Economists still predict the RBA will raise interest rates sometime in the second half of 2022.

Sources: MSCI Inc. and Thomson Reuters Datastream. MSCI data provided “as is” without any express or implied warranties.
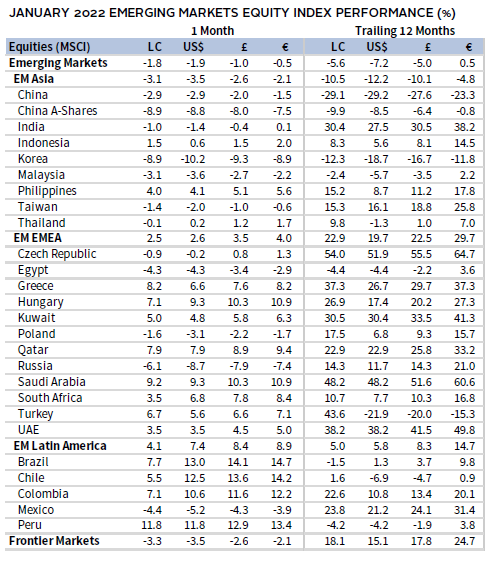
Emerging markets equities declined but topped their developed markets peers for just the third time in the last year. Still, emerging market equities have trailed developed market equities by 25 percentage points over the trailing 12-month period, the widest since 2013.
Emerging Asia lagged the broad index, while emerging Europe, the Middle East & Africa and Latin America advanced. Among major emerging markets countries, Saudi Arabia, Brazil, and South Africa advanced, Taiwan and India declined but topped the broad index, and Korea, Russia, and China trailed. China was the bottom-performing equity market of any size over the last 12 months, declining nearly 30% over that span. Domestic China A shares have held up better than their offshore counterparts but declined 9% in January.
China’s economic data was broadly downbeat as domestic consumption and real estate activity slowed. December retail sales grew by less than half of what was expected, inflationary pressures continued to mount as producer prices rose by double digits year-on-year for a fourth consecutive month, and domestic manufacturing slowed in January—its fourth contraction in the last six months. The ongoing regulatory crackdown created a headwind for property investment—a measure that accounted for 13% of China’s 2020 GDP—which declined by 14% year-on-year in December. Fourth quarter GDP beat consensus estimates, driven by strong export demand amid a record trade surplus, but the 4.0% year-on-year growth rate is the third-lowest on record, behind only the two quarters surrounding the initial COVID-19 lockdowns. The People’s Bank of China continued dovish policy moves, making further cuts to several key interest rates in January, targeted at supporting credit growth and boosting market confidence.
Sources: MSCI Inc. and Thomson Reuters Datastream. MSCI data provided “as is” without any express or implied warranties.
Fixed Income
US fixed income assets broadly declined in January as interest rates rose across all maturities and the yield curve flattened. US Treasuries declined the least, topping corporate equivalents; high-yield corporate bonds bested investment-grade peers. Five- and ten-year Treasury yields rose 36 basis points (bps) and 27 bps to 1.62% and 1.79%, respectively. The ten-year/two-year Treasury yield spread declined 18 bps. Notably the three-month cash rate reached its highest level since the initial pandemic sell-off, the 30-year finished the month above 2.00% for the first time since September, and ten-year breakeven inflation moderated slightly to 2.44%. US TIPS and non-taxable municipal bonds both declined, trailing Treasuries.
UK gilts declined the most among major fixed income categories. UK high-yield corporates bested investment-grade corporate equivalents. UK linkers also declined, topping nominal gilts. Five- and ten-year gilt yields rose 34 bps and 35 bps to 1.10%, and 1.32%, respectively, as rates for multiple tenors reached multi-year highs.
Euro-denominated bond prices fell as EMU government bonds topped corporate equivalents. Pan-euro high-yield corporate bonds lagged investment-grade corporate equivalents. German ten-year bund yields rose 19 bps to 0.01%, their first positive reading since May 2019.


Real Assets
Commodity futures advanced and were a top performer in January, supported by 20%+ gain in the energy sub-index. Oil & gas prices surged amid cooling temperatures and rising tensions on the Russia-Ukraine border. Precious metals was the only sector in the red, as gold and silver declined modestly.
Oil prices ($91.21 for Brent and $88.15 for WTI) continued their upward trajectory, with the global and US benchmarks reaching their highest levels since late 2014. Brent and WTI advanced 60%–70% over the last 12 months and are now up more than 300% from their early pandemic month-end lows. Supply constraints have contributed to the recent rise in prices. OPEC+ has broadly stuck to its timetable to increase output by 400,000 barrels per day per month but missed its January target and has resisted calls by large oil consuming countries to raise output faster. Similarly, US output is still nearly 10% below its pre-pandemic levels.
Global natural resource equities and energy MLPs delivered among the top returns of any major asset class, boosted by rising energy prices and strong earnings results. They remain among the top performers over the past 12 months.
Global developed REITs declined as interest rates rose and global central banks continued to edge toward tightening. Europe ex UK REITs, UK REITs, and developed Asia REITs declined but outperformed the broader index; US REITs lagged.
Gold prices ($1,796.65/troy ounce) lagged most major real assets categories despite surging inflation and mounting geopolitical tensions. The yellow metal remains a laggard over the past year.

Sources: Alerian, Bloomberg L.P., EPRA, FTSE International Limited, Intercontinental Exchange, Inc., MSCI Inc., National Association of Real Estate Investment Trusts, Standard & Poor’s, and Thomson Reuters Datastream. MSCI data provided “as is” without any express or implied warranties.
Note: Gold performance based on spot price return.
USD-Based Investors
Most global assets experienced broad-based declines in January, as equities and bonds declined the most amid rising interest rates and heightened volatility. Domestic small-cap equities were the bottom performer, trailing large-cap peers. US equities edged broad developed markets on dollar strength, but both trailed emerging markets. Among domestic fixed income categories, US Treasuries declined the least, topping corporate equivalents; high-yield corporate bonds bested investment-grade peers. Commodities were the sole asset class to advance, led higher by steep price increases in oil and gas, driven partly by rising tensions on the Russia-Ukraine border. Over the last 12 months, commodities also led, followed by US REITs and domestic large-cap equities.
The US dollar mostly appreciated, gaining the most versus the Australian dollar, Swiss franc, and euro. The dollar was flat against Japanese yen and declined only vis-à-vis our basket of EM currencies. The greenback’s performance was largely similar over the trailing 12-month period, gaining the most against the Japanese yen, Australian dollar, and euro, while depreciating versus only the Canadian dollar.
According to first preliminary estimate, US Real GDP increased at a 6.9% annualized rate, topping expectations. Growth was boosted by household spending on services and business investment, overcoming headwinds from a record trade deficit. However, economic activity cooled off in December as retail sales unexpectedly declined and consumer price inflation continued to accelerate. The Fed signaled it was ready to begin raising interest rates in March as Chairman Powell said the central bank would “move steadily away from the very highly accommodative monetary policy” that has been in place to combat the pandemic.


Sources: Bloomberg Index Services Limited, Frank Russell Company, FTSE International Limited, Intercontinental Exchange, Inc., J.P. Morgan Securities, Inc., MSCI Inc., National Association of Real Estate Investment Trusts, Standard & Poor’s, and Thomson Reuters Datastream. MSCI data provided “as is” without any express or implied warranties.
EUR-Based Investors
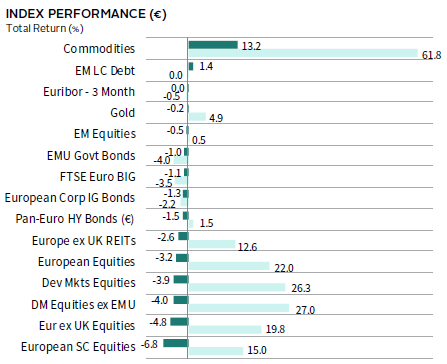
Most global assets experienced broad-based declines in January, as equities and bonds declined the most amid rising interest rates and heightened volatility. Domestic small-cap equities were the bottom performer, trailing large-cap peers. Europe ex UK equities lagged broad developed markets, but both trailed emerging markets. Among fixed income categories, EMU government bonds declined the least, topping corporate equivalents; investment-grade corporate bonds edged high-yield peers. Commodities and EM local currency bonds were the only asset classes to advance. Commodities were led higher by steep price increases in oil and gas, driven partly by rising tensions on the Russia-Ukraine border. Over the last 12 months, commodities also led, followed by developed equities categories.
The euro generally weakened in January, depreciating the most vis-à-vis our EM currencies basket, and safe haven currencies US dollar and Japanese yen. The euro advanced versus the Australia dollar and Swiss franc. Trends in the common currency’s performance were largely similar over the trailing 12-month period, declining the most vis-à-vis the Canadian dollar, US dollar, and UK sterling, while advancing versus Japanese yen and Australian dollar.
Eurozone fourth quarter GDP missed expectations, growing 0.3% quarter-over-quarter based on preliminary estimates. Euro area inflation reached a new all-time high in December, prompting speculation that the ECB could tighten monetary policy sooner than planned; however, President Lagarde quashed that notion, noting the central bank has “every reason not to act as quickly” as its US counterpart, since Europe trails the US economic recovery.

Sources: Bloomberg Index Services Limited, EPRA, European Banking Federation, FTSE Fixed Income LLC, FTSE International Limited, Intercontinental Exchange, Inc., J.P. Morgan Securities, Inc., MSCI Inc., National Association of Real Estate Investment Trusts, Standard & Poor’s, and Thomson Reuters Datastream. MSCI data provided “as is” without any express or implied warranties.
GBP-Based Investors
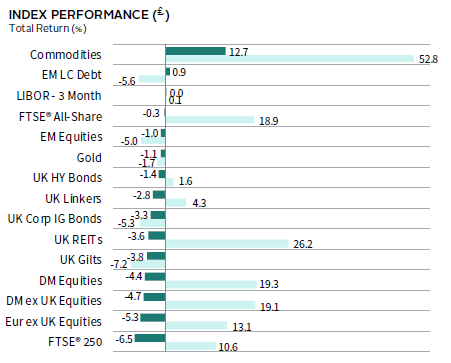
Most global assets experienced broad-based declines in January, as equities and bonds declined the most amid rising interest rates and heightened volatility. Domestic mid-cap equities were the bottom performer, trailing large-cap peers. UK stocks topped all equity categories, while emerging markets stocks bested developed markets equivalents. Among fixed income categories, UK gilts declined the most; investment-grade corporates trailed high-yield peers. Commodities and EM local currency bonds were the only asset classes to advance. Commodities were led higher by steep price increases in oil & gas, driven partly by rising tensions on the Russia-Ukraine border. Over the last 12 months, commodities also lead, followed by UK REITs and developed equities categories.
UK sterling was mixed in January, gaining versus the Australian dollar, Swiss franc, and euro, while declining the most versus our EM currency basket, US dollar, and Japanese yen. Sterling mostly advanced over the last year, gaining the most versus the Japanese yen, Australian dollar, and euro, and declining only vis-à-vis the Canadian and US dollars.
UK consumer price inflation reached its highest level in 30 years, reinforcing expectations the BOE will impose its first back-to-back interest rate rises since 2004 in early February. The 5.4% year-over-year price increase in December was nearly three times the target rate of 2% set by the central bank and is more widespread across product categories than the BOE anticipated. Retail sales declined by more than expected in December, while preliminary January PMI figures showed a moderating economic expansion across both manufacturing and services.

Sources: Bloomberg Index Services Limited, EPRA, FTSE International Limited, Intercontinental Exchange, Inc., ICE Benchmark Administration Ltd., J.P. Morgan Securities, Inc., MSCI Inc., National Association of Real Estate Investment Trusts, Standard & Poor’s, and Thomson Reuters Datastream. MSCI data provided “as is” without any express or implied warranties.
Performance Exhibits
All data are total returns unless otherwise noted. Total return data for all MSCI indexes are net of dividend taxes.
USD-Based Investors index performance chart includes performance for the Bloomberg US Aggregate Bond, Bloomberg US Corporate Investment Grade, Bloomberg US High Yield Bond, Bloomberg Municipal Bond, Bloomberg US TIPS, Bloomberg US Treasuries, ICE BofAML 91-Day Treasury Bills, FTSE® NAREIT All Equity REITs, J.P. Morgan GBI-EM Global Diversified, LBMA Gold Price, MSCI Emerging Markets, MSCI World, Russell 2000®, S&P 500, and S&P GSCI™ indexes.
EUR-Based Investors index performance chart includes performance for the Bloomberg Euro-Aggregate: Corporate, Bloomberg Pan-Euro High Yield (Euro), EURIBOR 3M, FTSE EMU Govt Bonds, FTSE Euro Broad Investment-Grade Bonds, FTSE® EPRA/NAREIT Europe ex UK RE, J.P. Morgan GBI-EM Global Diversified, LBMA Gold Price AM, MSCI Emerging Markets, MSCI Europe, MSCI Europe ex UK, MSCI Europe Small-Cap, MSCI World ex EMU, MSCI World, and S&P GSCI™ indexes.
GBP-Based Investors index performance chart includes performance for the Bloomberg Sterling Aggregate: Corporate Bond, Bloomberg Sterling Index-Linked Gilts, ICE BofAML Sterling High Yield, FTSE® 250, FTSE® All-Share, FTSE® British Government All Stocks, FTSE® EPRA/NAREIT UK RE, J.P. Morgan GBI-EM Global Diversified, LBMA Gold Price AM, LIBOR 3M GBP, MSCI Emerging Markets, MSCI Europe ex UK, MSCI World, MSCI World ex UK, and S&P GSCI™ indexes.
EM currencies is an equal-weighted basket of 20 emerging markets currencies.
Fixed Income Performance Table
Performance data for US TIPS reflect the Bloomberg US TIPS Index, with yields represented by the Bloomberg Global Inflation Linked Bond Index: US.