Global equity markets declined in aggregate in January, but individual markets varied as emerging markets advanced and developed equivalents fell. Growth stocks held up better than value, while small caps outperformed large caps for the fifth consecutive month. Sovereign bond prices declined amid rising yields, while high-yield bonds bested investment-grade equivalents. Real assets were mixed; oil prices reached their highest levels since before the COVID-19–related price collapse last year, but gold and REITs declined. Among major currencies, UK sterling and the US dollar appreciated, and the euro mostly declined.

JANUARY 2021 MAJOR ASSET CLASS PERFORMANCE (%)
Sources: Bloomberg Index Services Limited, Bloomberg L.P., FTSE International Limited, MSCI Inc., and Thomson Reuters Datastream. MSCI data provided “as is” without any express or implied warranties.
Note: Local currency returns for the Bloomberg Barclays indexes, the Bloomberg Commodity Index, and the FTSE® Developed REITs are in USD terms.
The Macro Picture
Broad equity market performance was relatively subdued in January, despite major political and financial market developments. The global COVID-19 vaccination rate picked up, but new variations of the virus present new challenges and have undercut optimism for a quick return to economic normalcy.
Joe Biden was sworn in as the 46th president of the United States and Democrats took narrow control of both chambers of Congress. The new president introduced his vision for a $1.9 trillion stimulus package—which is likely to be slimmed down before it is passed—and a centralized strategy aimed at federalizing the national pandemic response. Global central banks, including the Federal Reserve, European Central Bank, and Bank of Japan, reiterated pledges to remain accommodative until the recovery is well established.
Extraordinary trading conditions gripped a small segment of the US equity market. Short squeezes, catalyzed in large part by retail investors, led to extreme volatility in a few of the most heavily shorted stocks. At the center of the frenzy was videogame retailer GameStop, which saw a 17-fold increase in its market capitalization during the month.
The coronavirus vaccine rollout has been uneven across regions. Distribution has accelerated in the United States and United Kingdom, but the rollout has been shaky in the EU. New concerns about COVID-19 mutations identified in the United Kingdom, South Africa, and Brazil raised questions about the efficacy of current vaccines against these strains. Despite the overarching concerns, two encouraging signs emerged in January: new case counts are slowing and current vaccines appear to have significantly reduced hospitalizations.
Equities
US equities declined and trailed developed ex US counterparts in January. Four of 11 S&P 500 sectors advanced, led by energy and healthcare; consumer staples and industrials declined the most. Growth stocks bested value counterparts—although both declined—while small caps advanced, topping large caps for the fifth consecutive month. Quarterly earnings are estimated to have declined 2.3% year-over-year based on reports from 37% of S&P 500 Index constituents. While these results have been better than expected, a decline would mark the fourth consecutive quarter of negative growth. Looking ahead, analysts increased first quarter 2021 earnings projections by 3.2%, the second-largest increase in the first month of a quarter since 2010.
The US economy grew at an estimated 4.0% annualized rate in fourth quarter, just below expectations. For the full year 2020, the US economy declined 3.5%, driven largely by a slowdown in spending on services amid COVID-19 lockdowns. Retail sales and employment unexpectedly declined in December as many locales re-introduced lockdowns, but January service and manufacturing PMIs rose further into expansionary territory, as business optimism turned higher on hopes for a successful vaccine rollout going forward. The Fed held the benchmark interest rate steady and re-affirmed it has no intention of pulling back from its accommodative policy until the economy—and particularly the job market—recovers from the COVID-19 downturn.
European equities declined in January, underperforming broader developed markets stocks. UK stocks outpaced Europe ex UK, but remained the only major developed region in the red over the past 12 months.
The ECB left its benchmark interest rate unchanged and reaffirmed its accommodative monetary policy stance at its January meeting. ECB President Christine Lagarde provided additional detail regarding the central bank’s expanded emergency bond-buying program, explaining the ECB may adjust purchases based on the favorability of financing conditions, such as bank lending rates, corporate credit conditions, and government bond yields. The previous announcement, made in December, had helped reduce borrowing costs for governments, businesses, and households to all-time lows as COVID-19–related lockdowns were re-imposed across Europe. Germany, the Eurozone’s largest economy, narrowly avoided economic contraction in fourth quarter, expanding at a 0.1% rate. France’s economic output declined 1.3%, better than the expected 4.1% decline. Other economic data across the Continent were gloomier, as retail sales declined sharply, consumer prices remained deflationary, and sentiment and confidence indicators dipped further into contractionary territory.
The UK economy continued to rebound in its first month after the Brexit transition period officially ended. Retail sales improved, wages increased more than expected, and manufacturing PMI indicated an eighth consecutive month of expansionary activity. However, the services sector was hampered by renewed COVID-19 lockdowns nationwide as it fell deep into contractionary territory to its lowest level in eight months.
Japanese equities advanced, topping broader developed stocks in January for the fifth time in the last six months. COVID-19 cases reached new peaks, prompting officials to announce widespread states of emergency and impose containment measures to combat the case surge. The Bank of Japan held its benchmark interest rate steady and upgraded its economic forecast for fiscal year 2021, but warned of “strong downward pressure” on consumption due to the fresh containment measures. BOJ Governor Haruhiko Kuroda reiterated the central bank’s willingness to ramp up stimulus, indicating that the bank could focus on making its policy tools more effective and agile in its upcoming review in March.
Emerging markets equities gained, besting developed markets counterparts and bringing trailing 12-month outperformance to 15 percentage points (ppts). Among regions, heavily weighted emerging Asia outperformed, while emerging Europe, the Middle East & Africa gained but underperformed, and Latin America declined. China was the top-performing major country; Taiwan, South Africa, and Korea also bested the broader index, while India and Brazil lagged and declined. Fund flows into dedicated emerging markets equity funds reached new all-time highs in the last week of January, bringing net inflows for the month to nearly US$20 billion.
China continued its strong recovery from the COVID-19 downturn last year, posting a 6.5% fourth quarter year-on-year GDP growth rate, well above growth rates in other major economies. Other economic data supported the strong growth, as industrial output, retail sales, and foreign direct investment all grew at a strong pace; manufacturing and services PMI readings were softer than expected but remained expansionary. In light of China’s strong economic recovery from the COVID-19 pandemic, People’s Bank of China officials warned that loose monetary policy could inflate asset prices. The central bank removed liquidity from the banking system through open market operations, tightening financial conditions. US-China relations remain in flux as the Biden administration evaluates standing policy measures. The US Treasury extended the deadline on an order that bars Americans from investing in certain Chinese companies with ties to China’s military.
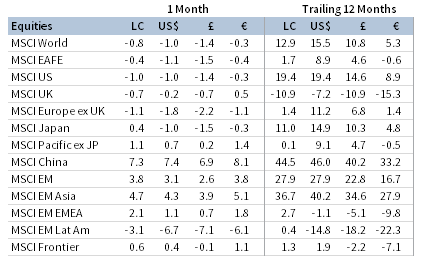
JANUARY 2021 EQUITY INDEX PERFORMANCE (%)
Sources: MSCI Inc. and Thomson Reuters Datastream. MSCI data provided “as is” without any express or implied warranties.
Fixed Income
US high-yield bonds advanced, topping investment-grade corporates, while Treasuries declined as sovereign yields rose. Five- and ten-year Treasury yields increased 9 and 18 basis points (bps) to 0.45% and 1.11%, respectively. The widely followed ten-year/two-year yield spread rose 20 bps to reach 100 bps for the first time since July 2017. Real rates touched their lowest level in history, but finished up 4 bps for the month at -1.02%. US tax-exempt municipal bonds and TIPS advanced and outperformed nominal Treasuries.
Sterling- and euro-denominated fixed income performance mirrored their US counterparts, with high-yield bonds advancing and investment-grade declining. Five- and ten-year UK gilt yields gained eight and 14 bps to 0.01% and 0.37%, respectively, and German ten-year bund yields rose six bps to -0.52%. UK linkers declined as real interest rates in the United Kingdom rose.

JANUARY 2021 BOND INDEX PERFORMANCE (%)

JANUARY 2021 NOMINAL YIELD CURVES

10Y/2Y YIELD CURVE SPLIT
* High-yield index yield data represent option-adjusted spread.
Sources: Bank of England, Bloomberg Index Services Limited, BofA Merrill Lynch, Federal Reserve, FTSE Fixed Income LLC, FTSE International Limited, Intercontinental Exchange, Inc., and Thomson Reuters Datastream.
Real Assets
Commodity futures advanced in January, led by gains in energy and agriculture.
Oil prices ($55.88 for Brent and $52.20 for WTI) rose 8% to their highest levels in almost a year, boosted by news early in the month that Saudi Arabia would unilaterally cut production by one million barrels per day in February and March.
Rising oil prices buoyed global natural resources equities and MLPs, which also advanced. Despite the strong gain, energy MLPS are among the bottom-performing asset classes over the last 12 months.
Global developed REITs broadly declined, but performance varied by region. Developed Asia REITs and US REITs were roughly flat, while Europe ex UK REITs and UK REITs sold off and trailed the broader index.
Gold prices fell to $1,858.01 per troy ounce, their fifth decline in the last six months. Despite the losing streak, gold remains a top performer over the past 12 months.
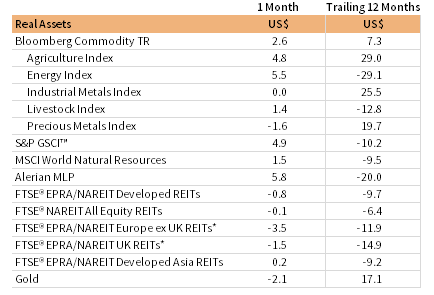
JANUARY 2021 REAL ASSETS PERFORMANCE (%)
* Europe ex UK REITs are in EUR terms and UK REITs in GBP terms.
Sources: Alerian, Bloomberg L.P., EPRA, FTSE International Limited, Intercontinental Exchange, Inc., MSCI Inc., National Association of Real Estate Investment Trusts, Standard & Poor’s, and Thomson Reuters Datastream. MSCI data provided “as is” without any express or implied warranties.
Notes: Total return data for all MSCI indexes are net of dividend taxes. Gold performance based on spot price return.
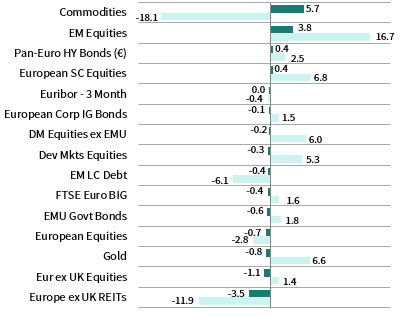
USD-Based Investors
Risk assets broadly outperformed in January, led by US small caps, which outperformed large caps for a fifth consecutive month. Domestic small caps have also been the top-performing asset class over the past 12 months. Emerging markets equities bested developed markets peers and have outperformed by more than 12 ppts over the last year.
Commodities also had a strong month, boosted by energy and agriculture, but remain deep in the red for the past 12-month period. In contrast, gold lagged the most in January. US high-yield corporate bonds topped investment-grade equivalents, while nominal Treasuries declined, underperforming munis and TIPS.
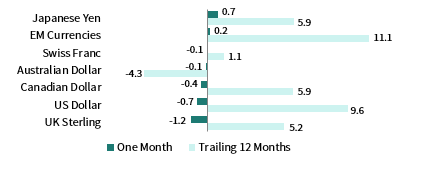
The US dollar broadly appreciated, declining only vis-à-vis UK sterling. The greenback advanced the most versus the Japanese yen, our equal-weighted basket of emerging markets currencies, and the euro. Over the past 12 months, the US dollar has weakened significantly, particularly versus the Australian dollar, euro, and Swiss franc.
The US economy grew at an estimated 4.0% annualized rate in fourth quarter, just below expectations. For the full year 2020, the US economy declined 3.5%, driven largely by a slowdown in spending on services amid COVID-19 lockdowns.
The Fed held the benchmark interest rate steady and re-affirmed it has no intention of pulling back from its accommodative policy until the economy—and particularly the job market—recovers from the COVID-19 downturn.
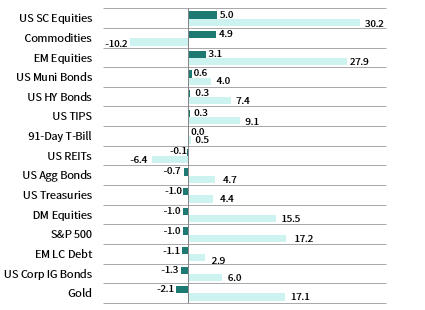
INDEX PERFORMANCE (US$)
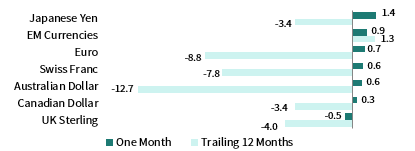
US DOLLAR PERFORMANCE VS VARIOUS CURRENCIES
Sources: Bloomberg Index Services Limited, FTSE International Limited, Frank Russell Company, Intercontinental Exchange, Inc., J.P. Morgan Securities, Inc., MSCI Inc., National Association of Real Estate Investment Trusts, Standard & Poor’s, and Thomson Reuters Datastream. MSCI data provided “as is” without any express or implied warranties.
EUR-Based Investors
Risk assets broadly outperformed in January. Commodities were the top-performing asset class, boosted by energy and agriculture, but remain deeply negative over the past 12 months. Emerging markets equities were another top performer and have bested all asset classes over the last year, including developed market equivalents. In contrast, Europe ex UK REITs and Europe ex UK equities lagged the most.
European small-cap equities advanced, while large- and mid-cap equivalents declined. Pan-European high-yield corporate bonds topped corporate investment-grade and EMU government bond equivalents amid rising yields. Gold declined, but remains one of the top performers over the trailing 12-month period.
The euro mostly declined, advancing only vis-à-vis the Japanese yen and our equal-weighted basket of emerging markets currencies; the common currency fell the most versus UK sterling and the US and Canadian dollars. Over the past 12 months, the euro strengthened against most currencies, depreciating against only the Australian dollar.
The ECB left its benchmark interest rate unchanged and reaffirmed its accommodative monetary policy stance at its January meeting. ECB President Christine Lagarde provided additional detail regarding the central bank’s expanded emergency bond-buying program, explaining the ECB may adjust purchases based on the favorability of financing conditions, such as bank lending rates, corporate credit conditions, and government bond yields.
INDEX PERFORMANCE (€)
EURO PERFROMANCE VS VARIOUS CURRENCIES
Sources: Bloomberg Index Services Limited, EPRA, European Banking Federation, FTSE Fixed Income LLC, FTSE International Limited, ICE Benchmark Administration Ltd., J.P. Morgan Securities, Inc., MSCI Inc., National Association of Real Estate Investment Trusts, Standard & Poor’s, and Thomson Reuters Datastream.
GBP-Based Investors
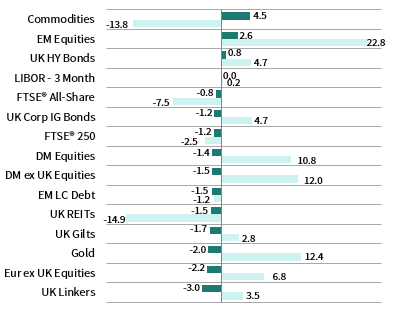
Risk assets broadly outperformed in January. Commodities were the top-performing asset class, boosted by energy and agriculture, but remain deeply negative over the past 12 months. Emerging markets equities were another top performer and have bested all asset classes over the last year, including developed market equivalents. In contrast, UK linkers and Europe ex UK equities lagged the most.
UK high-yield corporate bonds topped corporate investment-grade and UK gilt equivalents amid rising yields. Gold declined, but remains one of the top performers over the trailing 12-month period. UK equities declined as large caps outperformed mid-cap equivalents.
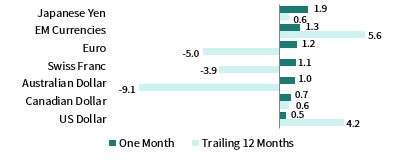
UK sterling advanced in January, appreciating the most vis-à-vis the Japanese yen, our equal-weighted basket of EM currencies, and the euro. Pound sterling was mixed over the past 12 months, declining versus the Australian dollar, euro, and Swiss franc, and gaining the most against emerging markets currencies and the US dollar.
The UK economy continued to rebound in its first month after the Brexit transition period officially ended. Retail sales improved, wages increased more than expected, and manufacturing PMI indicated an eighth consecutive month of expansionary activity. However, the services sector was hampered by renewed COVID-19 lockdowns nationwide as it fell deep into contractionary territory to its lowest level in eight months.
INDEX PERFORMANCE (£)
POUND STERLING PERFORMANCE VS VARIOUS CURRENCIES
Sources: Bloomberg Index Services Limited, EPRA, FTSE International Limited, Intercontinental Exchange, Inc., ICE Benchmark Administration Ltd., J.P. Morgan Securities, Inc., MSCI Inc., National Association of Real Estate Investment Trusts, Standard & Poor’s, and Thomson Reuters Datastream.
Performance Exhibits
All data are total returns unless otherwise noted. Total return data for all MSCI indexes are net of dividend taxes.
USD-Based Investors index performance chart includes performance for the Bloomberg Barclays US Aggregate Bond, Bloomberg Barclays US Corporate Investment Grade, Bloomberg Barclays US High Yield Bond, Bloomberg Barclays Municipal Bond, Bloomberg Barclays US TIPS, Bloomberg Barclays US Treasuries, ICE BofAML 91-Day Treasury Bills, FTSE® NAREIT All Equity REITs, J.P. Morgan GBI-EM Global Diversified, LBMA Gold Price, MSCI Emerging Markets, MSCI World, Russell 2000®, S&P 500, and S&P GSCI™ indexes.
EUR-Based Investors index performance chart includes performance for the Bloomberg Barclays Euro-Aggregate: Corporate, Bloomberg Barclays Pan-Euro High Yield (Euro), EURIBOR 3M, FTSE EMU Govt Bonds, FTSE Euro Broad Investment-Grade Bonds, FTSE® EPRA/NAREIT Europe ex UK RE, J.P. Morgan GBI-EM Global Diversified, LBMA Gold Price AM, MSCI Emerging Markets, MSCI Europe, MSCI Europe ex UK, MSCI Europe Small-Cap, MSCI World ex EMU, MSCI World, and S&P GSCI™ indexes.
GBP-Based Investors index performance chart includes performance for the Bloomberg Barclays Sterling Aggregate: Corporate Bond, Bloomberg Barclays Sterling Index-Linked Gilts, ICE BofAML Sterling High Yield, FTSE® 250, FTSE® All-Share, FTSE® British Government All Stocks, FTSE® EPRA/NAREIT UK RE, J.P. Morgan GBI-EM Global Diversified, LBMA Gold Price AM, LIBOR 3M GBP, MSCI Emerging Markets, MSCI Europe ex UK, MSCI World, MSCI World ex UK, and S&P GSCI™ indexes.
EM currencies is an equal-weighted basket of 20 emerging markets currencies.
Fixed Income Performance Table
Performance data for US TIPS reflect the Bloomberg Barclays US TIPS Index, with yields represented by the Bloomberg Barclays Global Inflation Linked Bond Index: US.