Global equity markets declined in January, as the outbreak of the Wuhan coronavirus sparked global growth concerns and sent stocks tumbling. Global growth stocks outperformed value, while large caps topped small caps. Bonds advanced as investment grade outgained high-yield equivalents when sovereign yields declined and spreads widened. Commodities and natural resources equities fell sharply as oil and copper prices plunged, driven by fears that the coronavirus could stifle demand in China. Among other real assets, REITs and gold advanced. The US dollar mostly appreciated, while UK sterling and euro performance were mixed.
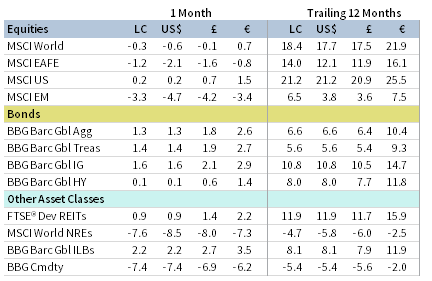
JANUARY MAJOR ASSET CLASS PERFORMANCE (%)
Sources: Bloomberg Index Services Limited, Bloomberg L.P., FTSE International Limited, MSCI Inc., and Thomson Reuters Datastream. MSCI data provided “as is” without any express or implied warranties.
Note: Local currency returns for the Bloomberg Barclays indexes, the Bloomberg Commodity Index, and the FTSE® Developed REITs are in US dollar terms.
Macro Picture
Despite the optimism that accompanied equity markets as the decade began, Wuhan coronavirus fears quickly depressed risk appetite. China, the epicenter of the outbreak, was hardest hit as domestic equity markets—which were closed for Chinese New Year—suffered steep declines late in the month as proxied by internationally traded index-tracking ETFs. The broader impacts of the ongoing epidemic are difficult to predict. At this point, few economists have meaningfully downgraded China’s full-year year economic growth projections, but with China in virtual lockdown, the rebound in global manufacturing faces a new and evolving headwind.
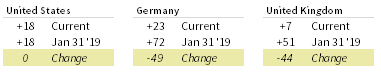
The United States and China signed off on a “Phase One” trade deal on January 15, halting the tit-for-tat tariff increases that dominated 2019 and opening the door for a more comprehensive trade deal. In Europe, the United Kingdom officially left the EU on January 31, but the details of the split must still be worked out. Global trade volume continued to decline and the IMF once again cut global growth expectations for this year and beyond, citing “tentative” data supporting a “sluggish” recovery. Major central banks maintained accommodative monetary policy, keeping historically low benchmark interest rates on hold and pledging to follow economic developments and potentially provide further easing.
2020 is off to a bumpy start, but until the final extent and impact of the coronavirus outbreak becomes clear, it will be difficult to separate blip from trend.
Equities
US equities (0.0% for the S&P 500 Index) were flat, but outperformed global ex us counterparts in January for the fourth straight month. Six of 11 S&P 500 sectors advanced, led by utilities, information technology, and real estate, whereas cyclical energy and materials lagged the most. Growth stocks bested value counterparts for the month, outperforming by more than 13 percentage points (ppts) over the past 12 months, while large caps outpaced small caps. Quarterly earnings are expected to advance 0.1% year-over-year, based on reports from roughly half of S&P 500 constituents. While just slightly positive, an advance would come on the heels of three consecutive quarters of negative growth. Looking ahead, analysts project quarterly earnings growth to steadily increase throughout 2020, projecting 9% growth for the full calendar year. Yet despite the expected pick up in earnings, multiple expansion continued; the 12-month forward price-earnings ratio ticked up to 18.8, its highest level since 2002.
US economic growth was estimated at 2.1% annualized in fourth quarter, above expectations, boosted by declining imports; consumer spending, which accounts for approximately 70% of the US economy, grew at a slower pace than the previous quarter. The Federal Reserve, citing solid job gains and below-target inflation, held the benchmark interest rate steady and re-affirmed it will continue liquidity injections into the beleaguered repo market until at least April.
European equities (-2.5% in USD, -1.3% in EUR, -2.0% in GBP) declined in January, underperforming broader developed markets stocks. Europe ex UK stocks outpaced UK for the fifth time in the last six months. The European Central Bank (ECB) held its benchmark interest rate unchanged at its January meeting. ECB President Christine Lagarde announced she will conduct a strategic review of the central bank to reconsider its inflation target, examine the effectiveness and side effects of its policy tools, and evaluate whether it should alter its €200 billion corporate bond holdings to address climate change. Eurozone GDP was estimated to have grown at 0.1% in fourth quarter, its lowest growth rate since it declined in first quarter 2013. Two of the Eurozone’s three largest economies—France and Italy—both unexpectedly contracted; its largest economy, Germany, is scheduled to release GDP data in mid-February.
The United Kingdom officially left the EU on January 31 after 47 years as a member state, setting the table for negotiations during the transition period, which is scheduled to last until the end of 2020. The Bank of England held policy interest rates steady at Governor Mark Carney’s final meeting leading the central bank, lowering its economic growth expectations for the next three years amid a slew of weaker-than-expected economic reports.
Japanese equities underperformed broader developed stocks on the month and trail by almost 8 ppts over the past 12 months. The Bank of Japan (BOJ) kept monetary policy unchanged, boosted its economic growth forecast, and reiterated the central bank’s commitment to maintain ultra-easy monetary policy. Japan’s government nominated a noted reflationist to the BOJ’s Policy Board, replacing an outgoing ally and reaffirming Prime Minister Shinzo Abe’s commitment to so-called Abenomics policies, including monetary easing. Manufacturing activity remained in contractionary territory for the ninth consecutive month, while services activity moved back into expansionary territory.
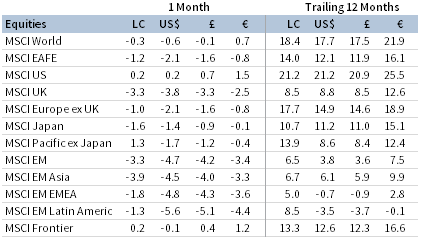
JANUARY EQUITY INDEX PERFORMANCE (%)
Sources: MSCI Inc. and Thomson Reuters Datastream. MSCI data provided “as is” without any express or implied warranties.
Emerging markets equities underperformed developed markets counterparts, bringing trailing 12-month underperformance to nearly 14 ppts in USD terms. In major currency terms, heavily weighted emerging Asia outperformed, while emerging Europe, the Middle East & Africa and Latin America trailed. Regional performance was reversed in local currency terms, as currency movement played a major role in emerging markets’ unhedged relative returns. Among major emerging markets countries, India, Brazil, South Africa, and Korea outperformed, while Taiwan and index heavyweight China, impacted by the Wuhan coronavirus, lagged.
Growing concern over the outbreak cast a shadow on China’s Lunar New Year holiday—typically the country’s peak travel and spending period—as authorities placed restrictions on travel and public gatherings. Equity markets were closed through the end of the month due to the extended holiday, but a proxy for domestic China A-share returns, the US-traded DBX Harvest ETF, declined 10.9% on the month, down nearly 15% off its mid-January peak. Despite the equity market sell-off, few economists have meaningfully downgraded full-year GDP growth forecasts, assuming that any hit to growth will be limited to first quarter and will rebound as Chinese authorities continue to ease monetary policy and increase fiscal stimulus.
Fixed Income
Investment-grade bonds outgained high-yield equivalents as fears over the coronavirus outbreak and its impact on global growth weighed on yields. US Treasuries outperformed corporate investment-grade and high-yield bonds amid widening credit spreads. Five- and ten-year Treasury yields fell 37 and 41 basis points (bps) to 1.32% and 1.51%, respectively. The widely followed 10-year/2-year yield spread declined 16 bps, but remained marginally positive, while other portions of the yield curve inverted. US tax-exempt municipal bonds and TIPS advanced, but underperformed nominal Treasuries.
UK gilts outperformed UK corporate investment-grade and high-yield counterparts; UK linkers outgained nominal gilts. Five- and ten-year gilt yields declined 20 bps and 29 bps to 0.38% and 0.53%, respectively. As in the United States and United Kingdom, EMU government bonds outgained corporate investment-grade and high-yield peers. German ten-year bund yields declined 26 bps to -0.44%. Spreads between Italian and Germany ten-year bonds fell to their lowest month-end levels since early 2018, as a closely watched regional election in Italy resulted in some reprieve for the country’s embattled coalition government.
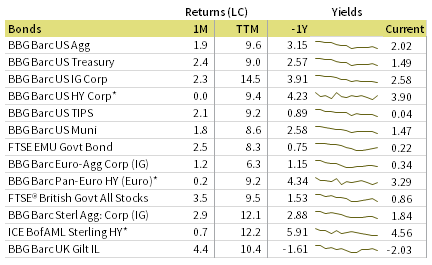
JANUARY BOND INDEX PERFORMANCE (%)
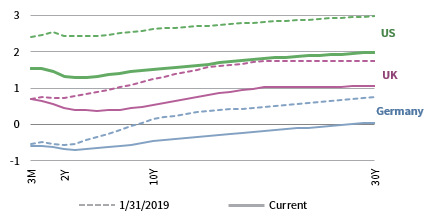
JANUARY NOMINAL YIELD CURVES
10Y/2Y YIELD CURVE SPLIT
* High-yield index yield data represent option-adjusted spread.
Sources: Bank of England, Bloomberg Index Services Limited, BofA Merrill Lynch, Federal Reserve, FTSE Fixed Income LLC, FTSE International Limited, Intercontinental Exchange, Inc., and Thomson Reuters Datastream.
Real Assets
Commodity futures underperformed in January, as steep declines in energy and industrial metals weighed on index returns. Copper prices, widely viewed as a barometer for economic activity, declined 9.7% on the month. Oil prices ($58.16 for Brent and $51.56 for WTI) declined more than 10 percentage points in January as coronavirus fears led to a 20% decline in demand from China, the world’s biggest crude oil importer.
Falling oil prices weighed on global natural resources equities and energy MLPs, which also experienced steep declines. The Alerian MLP Index is the bottom performer among major real assets over the past year.
Global developed REITs advanced, but performance varied by region. US REITs and Europe ex UK REITs outgained the broader index; Asia REITs advanced, but underperformed; and UK REITs sold off.
Gold prices rose to $1,586.70 per troy ounce as fears over the economic impact of the Wuhan coronavirus and—more broadly—slowing global growth rattled market participants. Gold has gained 33.2% since its recent September 2018 month-end low, just prior to the fourth quarter 2018 equity market correction.
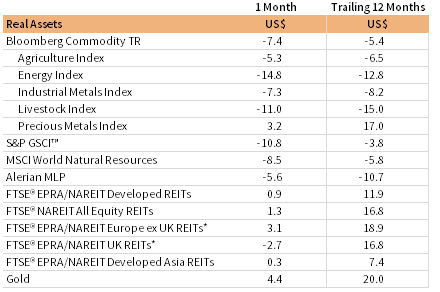
REAL ASSETS PERFORMANCE (%)
* Europe ex UK REITs are in EUR terms and UK REITs in GBP terms.
Sources: Alerian, Bloomberg L.P., EPRA, FTSE International Limited, Intercontinental Exchange, Inc., MSCI Inc., National Association of Real Estate Investment Trusts, Standard & Poor’s, and Thomson Reuters Datastream. MSCI data provided “as is” without any express or implied warranties.
Note: Total return data for all MSCI indexes are net of dividend taxes. Gold performance based on spot price return.
USD-Based Investors
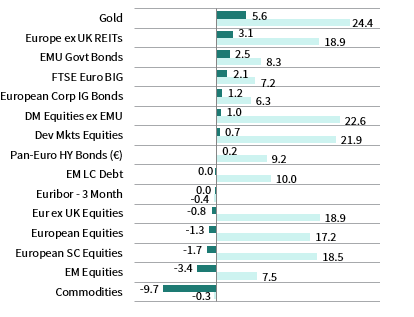
Safe havens outperformed risk assets amid heightened global growth fears sparked by the Wuhan coronavirus outbreak. Gold and US Treasury bonds paced returns in January, while commodities, emerging markets equities, and US small caps lagged the most.
Relative performance reflected depressed risk appetite. US equities outperformed broader developed markets and emerging markets peers; domestic large caps outpaced small caps; and Treasuries outgained US corporate investment-grade and US high-yield bonds. Nominal Treasuries outpaced inflation-protected TIPS.
The US dollar appreciated vis-à-vis all major currencies and our equal-weighted basket of emerging markets currencies, save for two safe havens: the Swiss franc and the Japanese yen. Over the past 12 months, the greenback appreciated the most versus the Australian dollar, our emerging markets basket, and the euro.
The United States and China signed off on a “Phase One” trade deal on January 15, halting the tit-for-tat tariff increases that dominated 2019 and potentially opening the door for a more comprehensive trade deal.
The Fed, citing solid job gains and below-target inflation, held the benchmark interest rate steady and re-affirmed it will continue liquidity injections into the beleaguered repo market until at least April.
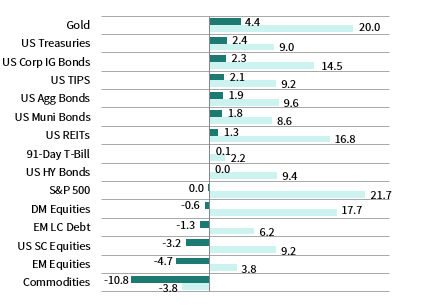
INDEX PERFORMANCE (US$)
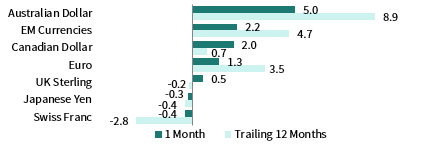
US DOLLAR PERFORMANCE VS VARIOUS CURRENCIES
Sources: Bloomberg Index Services Limited, FTSE International Limited, Frank Russell Company, Intercontinental Exchange, Inc., J.P. Morgan Securities, Inc., MSCI Inc., National Association of Real Estate Investment Trusts, Standard & Poor’s, and Thomson Reuters Datastream. MSCI data provided “as is” without any express or implied warranties.
EUR-Based Investors
Safe havens outperformed risk assets amid heightened global growth fears sparked by the Wuhan coronavirus outbreak. Gold, Europe ex UK REITs, and investment-grade bonds paced returns in January, while commodities, emerging markets equities, and European small caps lagged the most.
Relative performance reflected depressed risk appetite: developed markets equities outperformed emerging markets peers, European large caps outpaced small caps, and EMU sovereigns outgained Euro corporate investment-grade and high-yield bonds. European equities underperformed broader developed markets stocks, which were largely driven by US equity outperformance.
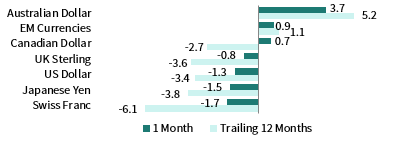
The euro was mixed, appreciating vis-à-vis commodity-exposed currencies—the Australian dollar, our equal-weighted basket of EM currencies, and the Canadian dollar—but weakening against UK sterling and safe havens like the Swiss franc, the Japanese yen, and US dollar. The common currency experienced a similar pattern of relative currency movements over the past 12 months.
The European Central Bank (ECB) held its benchmark interest rate unchanged at its January meeting. ECB President Christine Lagarde announced she will conduct a strategic review of the central bank to reconsider its inflation target, examine the effectiveness and side effects of its policy tools, and evaluate whether it should alter its €200 billion corporate bond holdings to address climate change.
INDEX PERFORMANCE (€)
EURO PERFROMANCE VS VARIOUS CURRENCIES
Sources: Bloomberg Index Services Limited, EPRA, European Banking Federation, FTSE Fixed Income LLC, FTSE International Limited, ICE Benchmark Administration Ltd., J.P. Morgan Securities, Inc., MSCI Inc., National Association of Real Estate Investment Trusts, Standard & Poor’s, and Thomson Reuters Datastream.
GBP-Based Investors
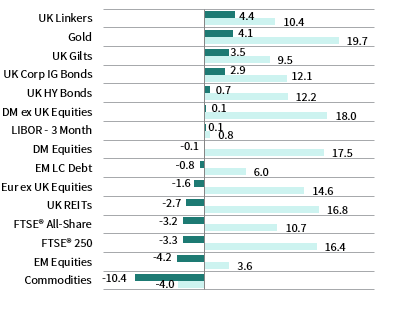
Safe havens outperformed risk assets amid heightened global growth fears sparked by the Wuhan coronavirus outbreak. Government bonds and gold paced returns in January, while commodities, emerging markets equities, and domestically oriented UK mid caps lagged the most.
On a relative basis, developed markets equities outperformed emerging markets peers, inflation-linked gilts topped nominal equivalents, and gilts outgained UK corporate investment-grade and high-yield bonds. UK equities underperformed broader developed markets stocks, which were largely driven by US equity outperformance.
UK sterling was mixed, appreciating vis-à-vis the commodity-exposed currencies—the Australian dollar, our equal-weighted basket of EM currencies, and the Canadian dollar—and the euro, but weakening against safe-haven currencies Swiss franc, Japanese yen, and US dollar. Sterling experienced a similar pattern of relative currency movements over the past 12 months.
The Bank of England held policy interest rates steady at Mark Carney’s final meeting as governor of the central bank and lowered its economic growth expectations for the next three years amid a slew of weaker-than-expected economic reports.
INDEX PERFORMANCE (£)

POUND STERLING PERFORMANCE VS VARIOUS CURRENCIES
Sources: Bloomberg Index Services Limited, EPRA, FTSE International Limited, Intercontinental Exchange, Inc., ICE Benchmark Administration Ltd., J.P. Morgan Securities, Inc., MSCI Inc., National Association of Real Estate Investment Trusts, Standard & Poor’s, and Thomson Reuters Datastream.
Performance Exhibits
All data are total returns unless otherwise noted. Total return data for all MSCI indexes are net of dividend taxes.
USD-Based Investors index performance chart includes performance for the Bloomberg Barclays US Aggregate Bond, Bloomberg Barclays US Corporate Investment Grade, Bloomberg Barclays US High Yield Bond, Bloomberg Barclays Municipal Bond, Bloomberg Barclays US TIPS, Bloomberg Barclays US Treasuries, ICE BofAML 91-Day Treasury Bills, FTSE® NAREIT All Equity REITs, J.P. Morgan GBI-EM Global Diversified, LBMA Gold Price, MSCI Emerging Markets, MSCI World, Russell 2000®, S&P 500, and S&P GSCI™ indexes.
EUR-Based Investors index performance chart includes performance for the Bloomberg Barclays Euro-Aggregate: Corporate, Bloomberg Barclays Pan-Euro High Yield (Euro), EURIBOR 3M, FTSE EMU Govt Bonds, FTSE Euro Broad Investment-Grade Bonds, FTSE® EPRA/NAREIT Europe ex UK RE, J.P. Morgan GBI-EM Global Diversified, LBMA Gold Price AM, MSCI Emerging Markets, MSCI Europe, MSCI Europe ex UK, MSCI Europe Small-Cap, MSCI World ex EMU, MSCI World, and S&P GSCI™ indexes.
GBP-Based Investors index performance chart includes performance for the Bloomberg Barclays Sterling Aggregate: Corporate Bond, Bloomberg Barclays Sterling Index-Linked Gilts, ICE BofAML Sterling High Yield, FTSE® 250, FTSE® All-Share, FTSE® British Government All Stocks, FTSE® EPRA/NAREIT UK RE, J.P. Morgan GBI-EM Global Diversified, LBMA Gold Price AM, LIBOR 3M GBP, MSCI Emerging Markets, MSCI Europe ex UK, MSCI World, MSCI World ex UK, and S&P GSCI™ indexes.
EM currencies is an equal-weighted basket of 20 emerging markets currencies.
Fixed Income Performance Table
Performance data for US TIPS reflect the Bloomberg Barclays US TIPS Index, with yields represented by the Bloomberg Barclays Global Inflation Linked Bond Index: US.