Capital markets rebounded in January as risk assets excelled, reversing course from a rough end to 2018. Global equities climbed higher and recorded their largest one-month gain, in USD terms, since late 2011. Emerging markets equities outperformed developed markets in major currency terms, and US stocks bested developed ex US counterparts. Cyclical sectors edged defensive equivalents, and growth stocks outgained value stocks, reversing late 2018 trends. High-yield and investment-grade corporates outpaced global government bonds amid spread tightening. Real assets were among the top performers, as natural resources equities, energy MLPs, and developed markets REITs experienced double-digit returns, supported by a rebound in energy prices and renewed risk-on market sentiment. Among major currencies, the US dollar and euro were broadly weaker, while UK sterling gained.
Fourth quarter’s steep decline appeared overdone as markets rallied despite further downgrades to global growth expectations, softening corporate earnings results, and heightened geopolitical risks. The International Monetary Fund (IMF) announced weaker global growth forecasts for 2019, citing escalation of trade tensions, risk of a “no-deal” Brexit, and a greater-than-envisaged slowdown in China. The Eurozone bore the brunt of the forecast downgrades as its three largest economies—Germany, France, and Italy—are each expected to grow no more than 1.5% in 2019. The ongoing trade dispute between the United States and China has been cited as a significant factor weighing on current corporate earnings results and expected growth, and tensions between the two governments were recently exacerbated by criminal charges for alleged espionage filed by the US Department of Justice against Chinese firm Huawei. Among more positive developments, Congress and the Trump administration agreed to a temporary deal to end the longest partial government shutdown in US history. Then, just before month-end, the Federal Reserve held its benchmark policy rate steady, as expected, but appeared more dovish regarding future rate increases. The result of these developments was the largest January gain for global equities on record.
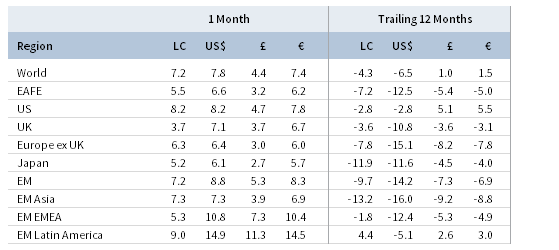
TOTAL RETURN FOR MSCI INDEXES (%)
US equities (8.0% for the S&P 500 Index) posted their best January return since 1987, rebounding from a dreary fourth quarter and outperforming developed markets peers. All 11 S&P 500 sectors were in the black for the month, led by cyclicals (industrials, real estate, communication services, and consumer discretionary) and energy, which benefited from a rebound in oil prices; defensive utilities, healthcare, and consumer staples lagged. Small-cap stocks significantly outperformed large-cap equivalents after trailing the previous four months, while growth equities topped value for the second consecutive month. Although still early in the reporting season, fourth quarter earnings are expected to grow at 12% year-over-year, down from earlier expectations but representing the fifth straight quarter of double-digit growth, if realized. Looking forward, earnings expectations have been cut significantly, as analyst EPS growth estimates for calendar year 2019 declined to 6%—nearly half the expectation at the start of the fourth quarter. Underlying macroeconomic fundamentals remained mostly positive in January, although the partial US government shutdown delayed the release of some key economic data, including the official preliminary fourth quarter GDP estimate. The shutdown was at least temporarily paused in late January when congressional leaders reached a deal with the Trump administration to reopen the government for three weeks. The Fed slightly downgraded its assessment on current economic strength from “strong” to “solid” and emphasized it will be “patient” regarding future rate adjustments and balance sheet normalization, guidance widely regarded as supportive to risk markets.
European equities (6.6% in USD, 6.2% in EUR, 3.2% in GBP) lagged broader developed markets in January. UK stocks underperformed Eurozone and Europe ex UK in local currency terms, but outperformed in major currency terms due to UK sterling strength. Brexit developments followed a familiar theme in which potentially significant events and deadlines resulted in little more than continued uncertainty. Early in the month, Prime Minister Theresa May put forward her Brexit deal with the EU to the UK Parliament, which was defeated by the widest margin in history. One day later, May survived a no confidence vote by a small margin along party lines. Late in the month, European Commission President Jean-Claude Juncker warned a no-deal Brexit was becoming more likely. On the Continent, deteriorating fundamental data threatened growth prospects across Europe, particularly in Germany, which had its 2019 GDP growth forecast cut by 0.6 percentage points (ppts)—the largest cut among major economies—to 1.3%. An economic contraction is already afoot in Italy, which had its 2019 forecast cut by 0.4 ppts, as the country officially entered a technical recession in fourth quarter 2018.
Japanese equities (6.1% in USD, 5.7% in EUR, 2.7% in GBP) were the worst-performing large developed market in major currency terms. Though only one-third of corporations have released calendar fourth quarter earnings figures, overall EPS growth is running at -3% year-over-year, preliminarily standing in contrast to an eight-quarter streak of positive, albeit steadily declining, earnings growth. Japan’s Cabinet Office noted the domestic economy is “recovering at a moderate pace” and is likely in its longest expansion since World War II, but cited spillover from the US-China trade dispute as a driver of declining exports. Fundamentals remained lukewarm as the country logged its first annual trade deficit since 2015 as exports shrank at their fastest pace in two years and core inflation remained tepid. Citing ongoing downside risk, the Bank of Japan (BOJ) kept its key policy rate unchanged, as expected, following its January policy meeting. The BOJ reaffirmed that its bond buying program will run for as long as necessary to reach its 2.0% core inflation target while simultaneously decreasing its core inflation forecasts—a common theme in recent years.
Emerging markets equities (8.8% in USD, 8.3% in EUR, and 5.3% in GBP) outperformed developed markets equivalents, driven by USD weakness, commodity strength, and broader risk-on sentiment. Among EM regions in major currency terms, Latin America stood out as the top-performing region globally for the second consecutive month. Emerging Europe, the Middle East & Africa also outperformed other emerging and domestic equity markets, while emerging Asia lagged the broader index. China was among the top-performing global markets of any size in January, despite facing mounting negative economic signals and ongoing geopolitical pressure. Trade talks between the United States and China appeared constructive, with the potential for a direct meeting between Presidents Trump and Xi in the near future. However, tensions continued to simmer between the two nations as Chinese officials responded apoplectically after the United States filed criminal charges against Chinese telecom giant Huawei for allegedly violating US national security laws. Fundamentals continued to worsen as export growth fell to its lowest level in two years and manufacturing contracted for the second straight month. Liquidity also dried up, leading China’s central bank to inject a record $84B into the economy and lower the required reserve ratio. Among other major emerging markets economies, Korea outperformed, Taiwan gained but underperformed, and India declined. Frontier markets equities (4.8% in USD, 4.4% in EUR, 1.4% in GBP) trailed behind developed and emerging markets counterparts, despite strong performance from Argentina, which accounts for nearly 20% of the index and is set to graduate to the MSCI Emerging Markets Index in June.
Real assets broadly gained, supported by a weaker US dollar and strengthening commodity prices. Commodity futures advanced (5.4% for the Bloomberg Commodity TR Index and 9.0% for the energy-heavy S&P GSCI™ Index), led higher by energy and industrial metals. Oil prices ($61.89 for Brent and $53.79 for WTI) rebounded from bear markets lows, powering through rising global growth concerns and weakening fuel demand, and boosted by speculation over the impact of US sanctions on Venezuela’s state-run oil company. Global natural resources equities (10.6% for the MSCI World Natural Resources Index in USD terms) and energy MLPs (12.6%) benefited from rising oil prices. Global developed REITs (10.9% in USD terms) also rallied, led by the largest monthly gain in US REITs (11.6%) since 2011. Europe ex UK REITs (9.8%) lagged the broader index but outpaced developed Asia REITs (9.4% in USD) and UK REITs (8.8%). Dollar weakness and global growth concerns helped gold (3.2%) advance in USD terms to $1,322.59—its highest month-end value in ten months.
Global fixed income advanced as macroeconomic data remained soft and central banks appeared more dovish. Riskier credits outgained sovereign bonds, as US Treasuries (0.5%) were positive amid dovish Fed statements and risk-on sentiment. The benchmark ten-year versus two-year yield spread decreased slightly to 18 basis points (bps) but still remains positive; however, the medium-term portion of the US Treasury yield curve finished the month inverted as two-year Treasuries ended the month yielding more than five-year equivalents. Five- and ten-year Treasury yields fell 8 bps and 6 bps to finish the month at 2.43% and 2.63%, respectively. UK gilts (1.1%) experienced slight gains and yields were flat on mixed Brexit news, as five-year yields fell 2 bps to 0.89% and ten-year yields fell 5 bps to 1.25%. EMU government bonds (1.1%) also gained, as ten-year German bund yields declined on deteriorating economic outlook. US credit spreads tightened as high-yield (4.5%) and investment-grade (2.4%) corporate bonds significantly outpaced Treasuries. US TIPS (1.3%) and US tax-exempt (0.8%) bonds also edged Treasuries. Outside the United States, UK linkers (0.6%) underperformed nominal gilts.
Among major currencies, the US dollar and euro were mostly weaker; UK sterling was broadly stronger. The euro slightly strengthened against the US dollar, and both currencies depreciated vis-à-vis the Canadian and Australian dollars, UK sterling, an equal-weighted basket of EM currencies, and the Japanese yen. UK sterling notched gains against all major currencies, save for the commodity-driven Canadian and Australian dollars. Notably, the safe-haven Swiss franc declined against all major currencies as markets shifted to risk-on sentiment.
Currency Performance as of January 31, 2019
The US dollar fell sharply against most major currencies and our equal-weighted EM currency basket, depreciating the most against the commodity-driven Canadian and Australian dollars. The greenback was broadly stronger over the trailing 12 months, weakening only relative to the Japanese yen.
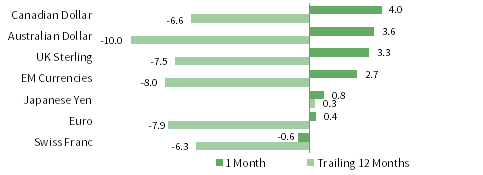
VERSUS THE US DOLLAR
Total Return (%)
The euro depreciated against most major currencies and our EM currency basket, save for the safe-haven Swiss franc and US dollar. Euro performance was more mixed over the trailing 12-month period, declining sharply against the US dollar and Japanese yen, but mixed and muted vis-à-vis other major currencies.
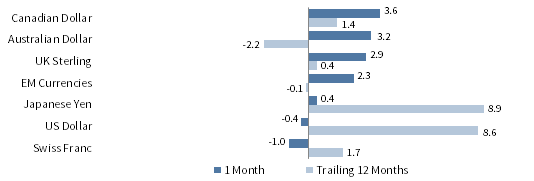
VERSUS THE EURO
Total Return (%)
UK sterling appreciated against all major currencies and our EM currency basket, save for the Canadian and Australian dollars, which rallied on rebounding commodity prices. Over the trailing 12-months, performance was more mixed, depreciating the most against safe havens.
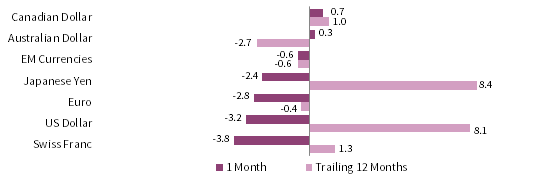
VERSUS THE POUND STERLING
Total Return (%)
Note: EM currencies is an equal-weighted basket of 20 currencies.
USD Market Performance as of January 31, 2019
Global risk assets rebounded, led by real assets (US REITs and commodities) and equities (US small caps and emerging markets). High-yield bonds outperformed investment-grade corporates and government bonds as spreads tightened. US TIPS and tax-exempt bonds outpaced nominal Treasuries.
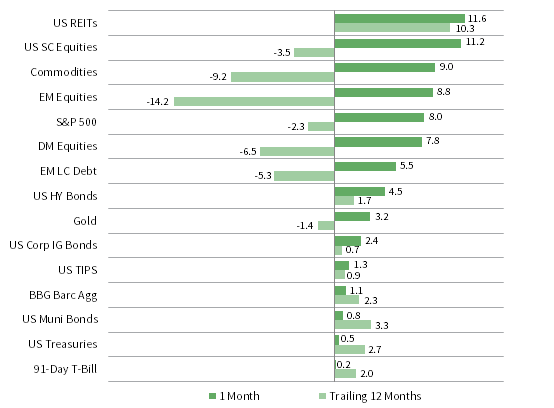
INDEX PERFORMANCE (US$)
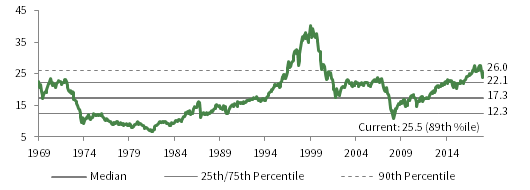
COMPOSITE NORMALIZED P/E: MSCI US
December 31, 1969 – January 31, 2019

FIXED INCOME YIELDS
January 2018 – January 2019
Sources: Bloomberg Index Services Limited, FTSE International Limited, Frank Russell Company, ICE Benchmark Administration Ltd., Intercontinental Exchange, Inc., J.P. Morgan Securities, Inc., MSCI Inc., National Association of Real Estate Investment Trusts, Standard & Poor’s, and Thomson Reuters Datastream. MSCI data provided “as is” without any express or implied warranties.
EUR Market Performance as of January 31, 2019
Real assets (Europe ex UK REITs and commodities) and equities (European small caps and emerging markets) were top performers in January. Developed markets ex EMU equities outpaced European mid- and large-cap stocks. European high yields bested investment-grade bonds as European bonds broadly lagged.

INDEX PERFORMANCE (€)
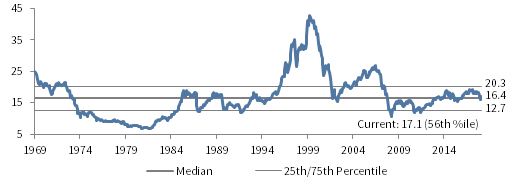
COMPOSITE NORMALIZED P/E: MSCI EUROPE EX UK
December 31, 1969 – January 31, 2019
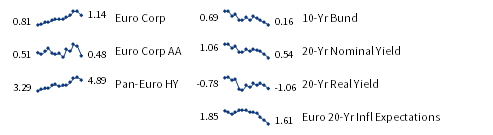
FIXED INCOME YIELDS
January 2018 – January 2019
Sources: Bloomberg Index Services Limited, EPRA, European Banking Federation, FTSE Fixed Income LLC, FTSE International Limited, ICE Benchmark Administration Ltd., J.P. Morgan Securities, Inc., MSCI Inc., National Association of Real Estate Investment Trusts, Standard & Poor’s, and Thomson Reuters Datastream. MSCI data provided “as is” without any express or implied warranties.
GBP Market Performance as of January 31, 2019
Recent laggards posted the strongest gains in January as real assets (UK REITs and commodities) and equities (UK mid caps and emerging markets) led. UK large cap stocks trailed domestic small caps and broader developed markets. Among laggards, corporate bonds outpaced government bonds and gold was flat.
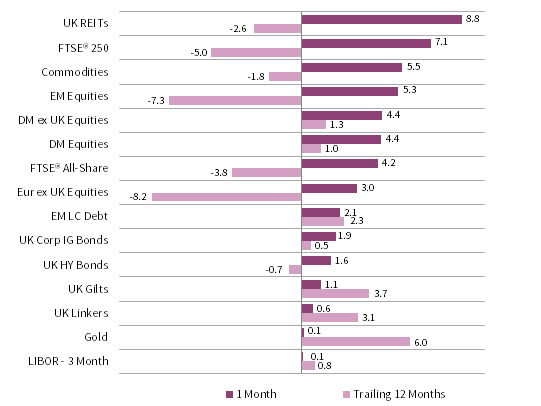
INDEX PERFORMANCE (₤)
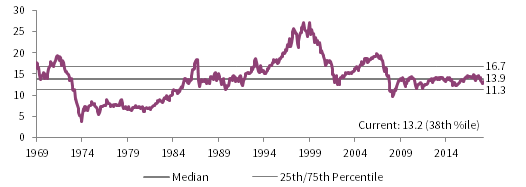
COMPOSITE NORMALIZED P/E: MSCI UK
December 31, 1969 – January 31, 2019
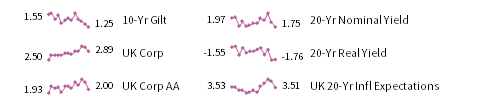
FIXED INCOME YIELDS
January 2018 – January 2019
Sources: Bloomberg Index Services Limited, EPRA, FTSE International Limited, Intercontinental Exchange, Inc., ICE Benchmark Administration Ltd., J.P. Morgan Securities, Inc., MSCI Inc., National Association of Real Estate Investment Trusts, Standard & Poor’s, and Thomson Reuters Datastream. MSCI data provided “as is” without any express or implied warranties.
Exhibit Notes
Performance Exhibits
Total return data for all MSCI indexes are net of dividend taxes.
US dollar index performance chart includes performance for the Bloomberg Barclays Aggregate Bond, Bloomberg Barclays Corporate Investment Grade, Bloomberg Barclays High Yield Bond, Bloomberg Barclays Municipal Bond, Bloomberg Barclays US TIPS, Bloomberg Barclays US Treasuries, ICE BofAML 91-Day Treasury Bills, FTSE® NAREIT All Equity REITs, J.P. Morgan GBI-EM Global Diversified, LBMA Gold Price, MSCI Emerging Markets, MSCI World, Russell 2000®, S&P 500, and S&P GSCI™ indexes.
Euro index performance chart includes performance for the Bloomberg Barclays Euro-Aggregate: Corporate, Bloomberg Barclays Pan-Euro High Yield, FTSE EMU Govt Bonds, FTSE Euro Broad Investment-Grade Bonds, EURIBOR 3M, FTSE® EPRA/NAREIT Europe ex UK RE, J.P. Morgan GBI-EM Global Diversified, LBMA Gold Price AM, MSCI Emerging Markets, MSCI Europe, MSCI Europe ex UK, MSCI Europe Small-Cap, MSCI World ex EMU, MSCI World, and S&P GSCI™ indexes.
UK sterling index performance chart includes performance for the Bloomberg Barclays Sterling Aggregate: Corporate Bond, ICE BofAML Sterling High Yield, FTSE® 250, FTSE® All-Share, FTSE British Government All Stocks, FTSE British Government Index-Linked All Stocks, FTSE® EPRA/NAREIT UK RE, J.P. Morgan GBI-EM Global Diversified, LBMA Gold Price AM, LIBOR 3M GBP, MSCI Emerging Markets, MSCI Europe ex UK, MSCI World, MSCI World ex UK, and S&P GSCI™ indexes.
Valuation Exhibits
The composite normalized P/E ratio is calculated by dividing the inflation-adjusted index price by the simple average of three normalized earnings metrics: ten-year average real earnings (i.e., Shiller earnings), trend-line earnings, and return on equity–adjusted earnings. We have removed the bubble years 1998–2000 from our mean and standard deviation calculations. All data are monthly.
Fixed Income Yields
US fixed income yields reflect Bloomberg Barclays Municipal Bond Index, Bloomberg Barclays US Corporate High Yield Bond Index, Bloomberg Barclays US Corporate Investment-Grade Bond Index, and the ten-year Treasury.
European fixed income yields reflect the ICE BofAML Euro Corporate AA Bond Index, ICE BofAML Euro Corporate Bond Index, Bloomberg Barclays Pan-European Aggregate High Yield Bond Index, Bloomberg Twenty-Year European Government Bond Index (nominal), ten-year German bund, 20-year European Inflation Swaps (inflation expectations), and the real yield calculated as the difference between the inflation expectation and nominal yield.
UK sterling fixed income yields reflect the Bank of England 20-year nominal yields, Bloomberg Generic UK 20-year inflation-linked (real) yields, ICE BofAML Sterling Corporate AA Bond Index, ICE BofAML Sterling Corporate Bond Index, and UK ten-year gilts.