Capital markets generally started 2018 on a strong note, save for bonds, which saw yields back up on increasing prospects for faster economic growth and inflation, greater monetary policy tightening, and rising government bond supply. Global equities continued to climb higher, advancing for the 15th consecutive month with developed markets surpassing their longest ever run without a 5% correction, both in USD terms. The strengthening global economy is supporting earnings, which are so far surprising positively for fourth quarter 2017 with net upward revisions to both analyst estimates and companies’ forward guidance for 2018. Emerging markets equities and global IT stocks continued to outperform, but value outpaced growth outside the United States. Global government bonds sold off, but credit spreads continued to tighten. Real assets performance was broadly positive as commodities, natural resources equities, and energy MLPs advanced, supported by a weak US dollar, but US and European REITs declined amid higher government bond yields. Among currencies, the US dollar depreciated and the UK sterling strengthened, both virtually across the board, while euro performance was mixed.
Continued improvement in the global economic outlook was an important driver of returns in January, with economists at the International Monetary Fund (IMF) announcing upgrades to its forecasts for both global growth and inflation in 2018 and 2019. In explaining its positive revisions, the IMF cited both increased global growth momentum, particularly in Europe and Asia, and the expected short- to medium-term positive impact of US tax reform. The combination of this improved outlook and public speculation by some prominent investors that the era of central bank quantitative easing will end sooner than expected, despite central bankers continuing to stress an accommodative status quo, helped accelerate the global government bond market sell-off, which began in September when US Congressional Republicans first took up tax reform legislation in earnest. Fears over the late December passage of these tax cuts leading to increased deficits and renewed talk of an infrastructure bill have also raised concerns about rising US Treasury issuance just at a time when central banks are close to turning down the spigots. Thus far, global equities have mostly shrugged off the bond market’s repricing of improving growth and inflation expectations and evolving economic policies, led by a January “melt up” in US stocks as the tax cuts prompted strongly positive earnings revisions. However, equity markets consolidated as the month ended with bond yields continuing to move higher. The latest bond gyrations also drove a further rotation away from high-yielding bond proxy sectors toward cyclical ones, as well as an improvement in the relative performance of value stocks, particularly outside the United States.
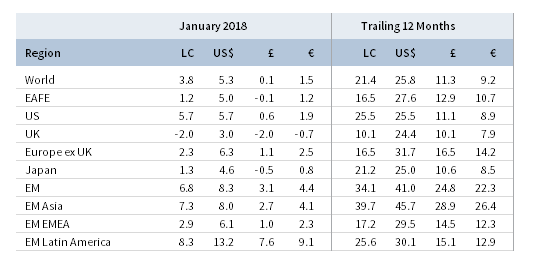
TOTAL RETURN FOR MSCI INDEXES (%)
US equities (5.7% for the S&P 500 Index) advanced in January, outperforming developed markets, and set a number of records during the month. The S&P 500 has now gained for 15 consecutive months, which ties the longest monthly streak of positive returns since the period from March 1958 to May 1959. The S&P 500 is also now in its longest ever run without a 5% correction (over a six-month period), while January performance ranks as the tenth best start to the year based on data back to 1957. Nine of 11 S&P 500 sectors were in the black for the month, with consumer discretionary the top performer; utilities and real estate declined as bond proxies sold off. US stocks’ recent surge has driven valuations to very elevated levels; our composite normalized P/E for the MSCI US Index ended the month at 28.0, the highest level since May 2001 and in the 93rd percentile of historical observations. While still early in the reporting season, fourth quarter earnings are expected to grow 13% year-over-year, with top-line revenue results particularly strong. Forward earnings growth expectations are climbing as well; during January the estimated calendar year 2018 EPS growth increased by over four percentage points to 17%, according to IBES, due in part to the recently passed tax cuts. In economic news, preliminary estimates show US GDP grew at a 2.6% annualized rate, below expectations, but was underscored by robust consumer spending and business investment. Following Chair Yellen’s final policy meeting, the Federal Reserve kept monetary policy unchanged but signaled a March rate hike on expectations of higher inflation in 2018.
European equities (5.4% in USD, 1.6% in EUR, and 0.3% in GBP) gained, led by EMU and Europe ex UK markets, which outperformed global equities in USD, EUR, and GBP terms, while the United Kingdom underperformed as sterling strength weighed on large caps. The Eurozone economy grew in 2017 by 2.5%, the highest growth rate since 2007 and faster than both the United States and United Kingdom. Germany and France drove the Eurozone’s growth last year, delivering the fastest expansions since 2011 on strengthening consumer and business spending. The UK economy expanded 1.8% in 2017, lagging major developed regions. Bank of England Governor Mark Carney indicated that uncertainty surrounding the ultimate Brexit outcome caused the economy to be 1% smaller than it would have been had UK citizens voted to remain in the EU. However, the United Kingdom’s estimated fourth quarter 2017 GDP growth beat expectations, and the labor market strengthened, demonstrating the economy’s relative resilience to date in the face of the aforementioned uncertainty. The European Central Bank kept monetary policy unchanged last month and pledged to extend stimulus measures if needed. The recent rise in the euro to a three-year high against the dollar is viewed by many market participants as a headwind to meeting growth and inflation targets, although the trade-weighted euro’s recent appreciation has been more muted.
Japanese equities (4.6% in USD, 0.8% in EUR, and -0.5% in GBP) advanced for the fifth consecutive month in local currency terms but underperformed developed markets peers. Although in early January the Bank of Japan (BOJ) announced a reduction in the amount of long-maturity government bonds it will purchase, this mostly reflected the stealth tapering that began in September 2016, with BOJ Chair Kuroda emphasizing that monetary policy was being kept unchanged. However, the BOJ later increased the amount of three- and five-year bonds it will purchase amid market speculation that stimulus would be withdrawn earlier than expected and in reaction to subdued inflation, a stronger yen, and upward pressure on global bond yields. Industrial output grew for the seventh straight quarter, signaling a likely strong read for calendar fourth quarter 2017 GDP growth. Early indicators from Japanese corporates point to double digit year-over-year quarterly earnings growth for the fifth straight quarter.
Emerging markets equities (8.3% in USD, 4.4% in EUR, and 3.1% in GBP) outperformed developed markets equivalents, driven by USD weakness, commodity strength, and their ongoing economic recovery. Latin America was the top performing region, followed by emerging Asia and emerging Europe, the Middle East & Africa. Brazilian equities and the real surged following an appeals court ruling to uphold a corruption conviction against former president Lula da Silva, though he remains the frontrunner in the current presidential race. Index heavyweight China led performance in January and remains the top performer over the trailing 12-month period as reported fourth quarter 2017 GDP was higher than expected. Russia also outperformed as Moody’s raised the country’s sovereign rating outlook to positive, citing resilience to new Western sanctions.
Real assets broadly gained in January, supported by a weaker US dollar and stronger commodity prices. Commodity futures advanced (2.0% for the Bloomberg Commodity TR Index and 3.4% for the energy-heavy S&P GSCI™ Index) to their highest levels since late-2015, led by energy and precious metals. Oil prices ($69.05 for Brent and $64.73 for WTI) rose to three-year highs as Brent traded above $70 during the month. The uptrend in crude prices was driven in part by record net-long speculative positioning, indicating prices may be at risk of a near-term pullback. Global natural resources equities (3.4% for the MSCI World Natural Resources Index in USD terms) rose in step with their underlying commodities, while energy MLPs (5.8%) rebounded on strong energy and natural gas prices due to falling US inventories and higher demand from an unexpectedly cold winter season. Global developed REITs (0.0% in USD terms) were hurt by the spike in global bond yields, particularly in the United States and Europe; UK REITS (-2.9%), US REITS (-2.9%), and Europe ex UK REITS (-0.8%) declined. Developed Asia REITs (2.4%) gained in contrast. Dollar weakness helped gold (2.9%) advance in USD terms to $1,341.67 despite generally widespread market optimism.
Global government bonds declined and yields climbed on accelerating economic growth and a repricing of inflation expectations. Some market pundits even declared the beginning of a bond bear market. UK gilts (-2.0%), US Treasuries (-1.4%), and EMU government bonds (-0.4%) all declined. In a reversal from the flattening trend of 2017, the US Treasury yield curve steepened. The benchmark ten-year versus two-year yield spread increased by 7 basis points (bps) relative to December month-end. Five- and ten-year Treasury yields rose 32 bps each to finish the month at 2.52% and 2.72%, respectively, the largest such increase since yields spiked following the US presidential election. Five- and ten-year UK gilt yields increased 30 bps and 29 bps to finish the month at 1.04% and 1.55%, respectively. Notably, five-year German bund yields turned positive for the first time since September 2015. US credit spreads tightened further as US investment-grade corporate bonds (-1.0%) and US high-yield bonds (0.6%) outperformed US Treasuries. US tax-exempt bonds (-1.2%) also sold off but were in-line with taxable investment-grade equivalents. US TIPS (-0.9%) outperformed nominal counterparts, reflecting a continuation in the upward breakeven inflation trend, while UK linkers (-2.6%) underperformed.
The US dollar weakened almost universally in January, while the UK sterling surged, and the euro was mixed. The US dollar fell against all major currencies we track and our equal-weighted basket of EM currencies, declining the most against the UK sterling, Swiss franc, and euro. The euro strengthened against the US dollar, Canadian dollar, Japanese yen, and Australian dollar, but fell relative to the UK sterling, Swiss franc, and our EM currency basket. Despite its mixed performance in January, the euro appreciated against every major currency over the trailing 12-month period. UK sterling strengthened against all currencies we cover, touching its highest level against the US dollar since the June 2016 Brexit referendum and appreciating the most against the US dollar, Canadian dollar, and our EM currency basket. The United Kingdom’s fairly resilient economic performance since the referendum and progress in Brexit negotiations with the EU has buoyed the pound in recent months, depreciating against only the euro among major currencies over the trailing 12-month period.
Market Exhibits
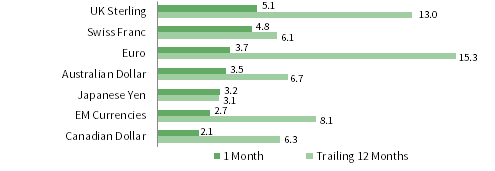
Currency Performance as of January 31, 2018
The US dollar fell sharply against all major currencies and our equal-weighted EM basket, depreciating the most against the UK sterling, Swiss franc, and the euro. In the trailing 12-month period all currencies appreciated against the greenback with USD weakness against the euro and pound standing out.
VERSUS THE US DOLLAR
Total Return (%)
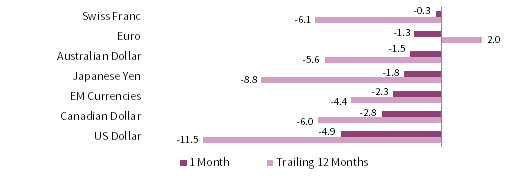
Euro performance was mixed in January, appreciating against the US dollar, Canadian dollar, Japanese yen, and Australian dollar but declining against the UK sterling, Swiss franc, and our EM basket. The euro broadly appreciated over the trailing 12-month period and hit a three-year high against the US dollar.

VERSUS THE EURO
Total Return (%)
The UK sterling appreciated against all major currencies and our EM basket and is up against all but the euro over the trailing 12-month period. Better-than-expected economic data and signs of agreement between UK and EU leaders on a Brexit transition period helped push the pound higher last month.
VERSUS THE POUND STERLING
Total Return (%)
Sources: MSCI Inc. and Thomson Reuters Datastream. MSCI data provided “as is” without any express or implied warranties.
Note: EM currencies is an equal-weighted basket of 20 currencies.
USD Market Performance as of January 31, 2018
Global equities surged, and USD weakness provided a tailwind for commodities and EM bonds. EM equities and US large caps outgained DM counterparts, while US small caps underperformed. US REITs and US investment-grade bonds fell as yields pushed higher, yet US high-yield bonds still eked out gains.
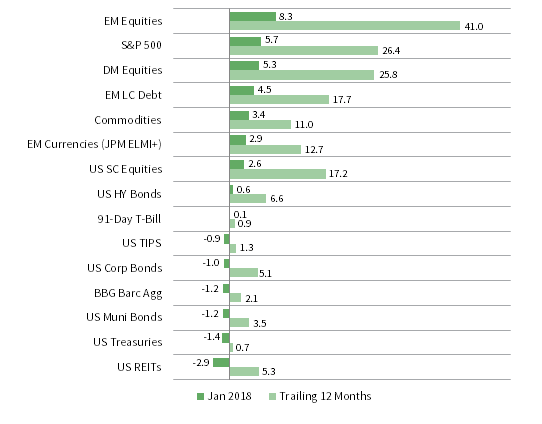
INDEX PERFORMANCE (US$)
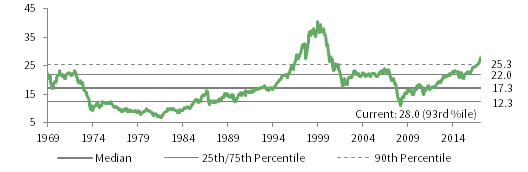
COMPOSITE NORMALIZED P/E: MSCI US
December 31, 1969 – January 31, 2018
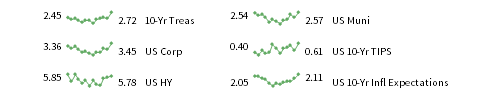
FIXED INCOME YIELDS
January 2017 – January 2018
Sources: Barclays, Bloomberg L.P., BofA Merill Lynch, FTSE International Limited, Frank Russell Company, J.P. Morgan Securities, Inc., MSCI Inc., National Association of Real Estate Investment Trusts, Standard & Poor’s, and Thomson Reuters Datastream. MSCI data provided “as is” without any express or implied warranties.
Euro Market Performance as of January 31, 2018
Equities led as EM and Europe ex UK outperformed DM equivalents. EM local currency debt and European high-yield bonds posted the only gains among fixed income categories. EMU government bonds declined less than euro investment-grade bonds, while Europe ex UK REITs and EM currencies fell the most.
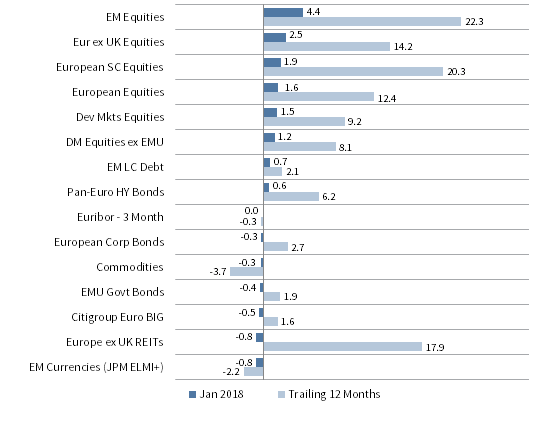
INDEX PERFORMANCE (€)

COMPOSITE NORMALIZED P/E: MSCI EUROPE EX UK
December 31, 1969 – January 31, 2018
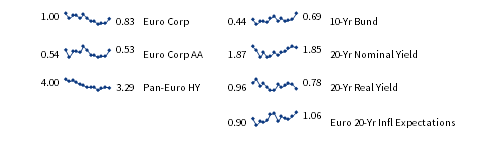
FIXED INCOME YIELDS
January 2017 – January 2018
Sources: Barclays, Bloomberg L.P., Citigroup Global Markets, EPRA, FTSE International Limited, J.P. Morgan Securities, Inc., MSCI Inc., National Association of Real Estate Investment Trusts, Standard & Poor’s, and Thomson Reuters Datastream. MSCI data provided “as is” without any express or implied warranties.
GBP Market Performance as of January 31, 2018
EM and Europe ex UK equities posted the best returns, and DM ex UK equities outperformed DM equivalents as UK stocks declined. Most domestic UK asset classes suffered losses, except for UK high-yield bonds; UK REITs led losses, followed by UK linkers and UK mid caps.
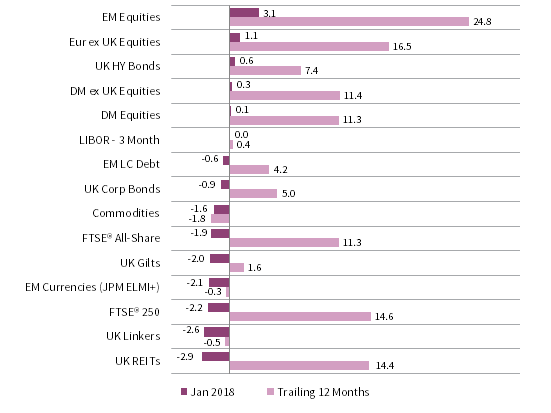
INDEX PERFORMANCE (£)

COMPOSITE NORMALIZED P/E: MSCI UK
December 31, 1969 – January 31, 2018
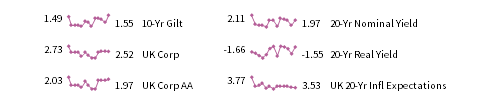
FIXED INCOME YIELDS
January 2017 – January 2018
Sources: Barclays, Bloomberg L.P., BofA Merill Lynch, EPRA, FTSE International Limited, J.P. Morgan Securities, Inc., MSCI Inc., National Association of Real Estate Investment Trusts, Standard & Poor’s, and Thomson Reuters Datastream. MSCI data provided “as is” without any express or implied warranties.
Exhibit Notes
Performance Exhibits
Total return data for all MSCI indexes are net of dividend taxes.
US dollar index performance chart includes performance for the Bloomberg Barclays Aggregate Bond, Bloomberg Barclays Corporate Investment Grade, Bloomberg Barclays High-Yield Bond, Bloomberg Barclays Municipal Bond, Bloomberg Barclays US TIPS, Bloomberg Barclays US Treasuries, BofA Merrill Lynch 91-Day Treasury Bills, FTSE® NAREIT All Equity REITs, J.P. Morgan ELMI+, J.P. Morgan GBI-EM Global Diversified, MSCI Emerging Markets, MSCI World, Russell 2000®, S&P 500, and S&P GSCI™ indexes.
Euro index performance chart includes performance for the Bloomberg Barclays Euro-Aggregate: Corporate, Bloomberg Barclays Pan-Euro High Yield, Citigroup EMU Govt Bonds, Citigroup Euro Broad Investment-Grade Bonds, Euribor 3-month, FTSE® EPRA/NAREIT Europe ex UK, J.P. Morgan ELMI+, J.P. Morgan GBI-EM Global Diversified, MSCI Emerging Markets, MSCI Europe, MSCI Europe ex UK, MSCI Europe Small-Cap, MSCI World ex EMU, MSCI World, and S&P GSCI™ indexes.
UK sterling index performance chart includes performance for the Bloomberg Barclays Sterling Aggregate: Corporate Bond, BofA Merrill Lynch Sterling High Yield, FTSE® 250, FTSE® All-Share, FTSE® British Government All Stocks, FTSE® British Government Index-Linked All Stocks, FTSE® EPRA/NAREIT UK RE, J.P. Morgan ELMI+, J.P. Morgan GBI-EM Global Diversified, LIBOR 3M GBP, MSCI Emerging Markets, MSCI Europe ex UK, MSCI World, MSCI World ex UK, and S&P GSCI™ indexes.
Valuation Exhibits
The composite normalized P/E ratio is calculated by dividing the inflation-adjusted index price by the simple average of three normalized earnings metrics: ten-year average real earnings (i.e., Shiller earnings), trend-line earnings, and return on equity–adjusted earnings. We have removed the bubble years 1998–2000 from our mean and standard deviation calculations. All data are monthly.
Fixed Income Yields
US fixed income yields reflect Bloomberg Barclays Municipal Bond Index, Bloomberg Barclays US Corporate High-Yield Bond Index, Bloomberg Barclays US Corporate Investment-Grade Bond Index, and the ten-year Treasury.
European fixed income yields reflect the BofA Merrill Lynch Euro Corporate AA Bond Index, BofA Merrill Lynch Euro Corporate Bond Index, Barclays Pan-European Aggregate High Yield Bond Index, Bloomberg Twenty-Year European Government Bond Index (nominal), ten-year German bund, 20-year European Inflation Swaps (inflation expectations), and the real yield calculated as the difference between the inflation expectation and nominal yield.
UK sterling fixed income yields reflect the BofA Merrill Lynch Sterling Corporate AA Bond Index, BofA Merrill Lynch Sterling Corporate Bond Index, UK ten-year gilts, Bank of England 20-year nominal yields, and Bloomberg Generic UK 20-year inflation-linked (real) yields. Current UK 20-year nominal yield data are as of January 30, 2018.