The strong reflation trends in markets that were accelerated by the US election outcome were more muted in January as investors digested the change in administrations and some reversals were observed. Reflecting some pullback from overstretched positions, US dollar weakness and a pause in US interest rates’ recent climb helped emerging markets equities to rebound. Global equities advanced further but were led this month by emerging markets and growth stocks; developed markets equities underperformed despite both UK and US stocks touching all-time highs intra-month. Currency fluctuations again meant different results for investors from different regions as US stocks outperformed in local currency terms but underperformed in USD. Developed market government bonds experienced small declines in aggregate, whereas high-yield corporate bonds continued to rally. Real asset performance was mixed—energy MLPs and gold rallied, while commodities, natural resources equities, and developed REITs were roughly flat in USD terms.
Volatility returned and increased performance dispersion both across and within asset classes was a reminder of the importance of diversification. January’s performance also may have been a reflection of the market’s reaction to the US presidential election being somewhat overdone. As the month closed, markets were unsettled and the heightened uncertainty, driven primarily by investors reassessing US President Donald Trump’s ability to increase economic growth, saw market volatility spill over from bonds and currencies into equities. Meanwhile, headline inflation continued to move higher to end 2016, in part due to more favorable oil price comparisons following last year’s crude rebound. Inflation expectations have also risen—rising headline inflation may be contributing, but the market now seems to be pricing in more of the possible inflationary consequences of a Trump presidency in addition to the growth potential. Trump’s tax and trade agendas could potentially upend long-standing dynamics at the sector and industry levels. Case in point are relative effective tax rates at the economic sector level. The wide disparity in these tax rates today suggests that the implementation of a lower statutory rate, possibly together with House Republicans’ proposed territorial system including border adjustments, could favor certain sectors over others, disrupting the status quo.
US equities (1.9% for the S&P 500) advanced for a third consecutive month, with large-cap indexes setting another all-time high before retreating somewhat into month-end. US small caps (0.4%) trailed large caps after their strong post-election outperformance. The market’s optimism stemming from strong initial fourth quarter earnings results from banks and technology companies and expectations for the new Trump presidency quickly waned as public outcry and political tensions following Trump’s first immigration policy move appeared to hurt investors’ risk appetite in the final trading days. Earnings results also turned mixed as the reporting season progressed, and estimated fourth quarter GDP growth showed a larger-than-expected slowdown from the prior quarter. Still, fourth quarter earnings are expected to show decent year-over-year growth with a much smaller drag from the energy sector as last year’s oil price recovery has improved year-over-year earnings comparisons, and top line growth was also forecast to strengthen.
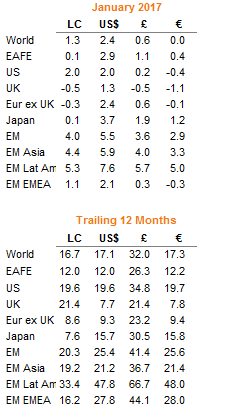
Total Return for MSCI Indexes (%)
European equities retreated as both UK (-0.3% for the FTSE® All-Share) stocks and Europe ex UK (-0.3%) equities experienced slight declines, with Eurozone (-1.0%) markets underperforming the broader region. Given dollar weakness, these indexes saw gains in USD terms. Political and economic policy uncertainty appears to be weighing on European equity markets given the UK government’s looming self-imposed Article 50 deadline to initiate “Brexit” negotiations, the inauguration of a seemingly less EU-friendly US president, and the specter of upcoming Eurozone elections, despite continued improvement in both macro and micro fundamentals. The UK economy has so far defied earlier expectations that the Brexit vote would damage economic sentiment and activity. Meanwhile, Eurozone growth continued to accelerate last quarter, with the region estimated to have grown faster than the US economy for the full calendar year. Forward indicators suggest that the pace of growth will continue in the near term as the European Central Bank (ECB) has signaled that it will remain accommodative despite the recent oil-driven rise in headline inflation. That stance should support investor demand for equities, whose fundamentals could also benefit from rising global inflation given that as price-takers with high international exposure, European companies’ profit margins are closely tied to global inflation trends.
Japanese equities (0.1%) stood still, underperforming developed markets peers in local currency terms, though unhedged US and European investors enjoyed gains due to yen strength as the currency and Japanese stocks continued to exhibit strong negative correlations. The pause in Japanese stocks’ recent rally came despite a strong start to the quarterly earnings season and continued demand from both corporate buybacks and local institutions diversifying into equities as the Bank of Japan (BOJ) crowds them out of the government bond market. The BOJ announced no changes to its monetary policy stance at its meeting late in the month, maintaining its negative interest rate with yield targeting policy. Pacific ex Japan (2.3%) markets (Australia, Hong Kong, New Zealand, and Singapore) outperformed Japanese counterparts, continuing their strong run of the past year. Hong Kong (7.8%) stocks rallied alongside emerging Asian equities, reversing some of the losses suffered late last year. The recent rally in Australian (-0.5%) equities stalled amid a surge in the Australian dollar following surprise trade surpluses in November and December.
Emerging markets equities (4.0% in local currency terms and 5.5% in USD terms) rebounded, outperforming developed markets equivalents in both local and foreign currency terms after meaningfully lagging last quarter. A weaker US dollar and a reprieve from rising US interest rates helped to improve sentiment toward emerging markets assets, attracting renewed inflows in a reversal from the trend of recent months. All three regions advanced, with Latin America (5.3%) and emerging Asia (4.4%) outperforming emerging Europe, the Middle East, and Africa (1.1%). Turkey (11.2%) was the top-performing country despite having its sovereign debt rating downgraded—it is now rated junk by all three major agencies—although lira weakness wiped out a sizable portion of the gains for foreign investors. Peru (9.1%), Brazil (7.0%), and China (6.9%) also outperformed the broader index. Brazil’s outperformance was even greater in euro, GBP, and USD terms due to a strong Brazilian real. Currency strength in Korea and Poland similarly made them among the top performers in USD.
Real asset performance was mixed. Commodity futures were nearly flat (0.1% for the Bloomberg Commodity TR Index, but -1.4% for the energy-heavy S&P GSCI™) as price rallies in gold (up 4.7% to $1,211.49/troy ounce) and copper (8.7%) were offset by a pullback in crude (-1.7% and -2.0% to $52.81 and $55.70 for WTI and Brent, respectively). Natural resources equities (-0.3% in USD terms for the MSCI World Natural Resources Index) also treaded water as energy stock declines (-3.0%) more than offset a surge in metals & mining shares (13.1%). Energy MLPs (4.9%) rallied to their highest level since July 2015 as a result of new executive orders from Trump that should pave the way for further energy infrastructure development, including potential completion of the controversial Dakota Access and Keystone XL pipelines. Developed markets REITs (0.6% in USD terms) were held back by losses in Europe, which offset large gains in Asian listed property; US REITs (0.2%) also underperformed.
Developed markets government bonds (-0.8%) retreated somewhat further, though with some dispersion as US Treasuries (0.2%) outperformed UK gilts (-1.7%) and EMU government bonds (-2.1%). Higher yields and expectations of further US dollar strength likely attracted inflows to US Treasuries from abroad. As a result, US Treasury yields ended the month at or near where they started—the ten-year remained at 2.45%, while the five-year fell just 3 basis points (bps) to 1.90%. In contrast, UK gilt yields jumped 16 bps and 19 bps to 0.71% and 1.49% for the five- and ten-year, respectively. Similarly, German five- and ten-year bund yields rose 15 bps and 23 bps to -0.40% and 0.44%, respectively. Like US Treasuries, US tax-exempt bonds (0.7%), and US investment-grade corporate bonds (0.3%) also enjoyed some relief from recent selling pressure. US high-yield bonds (1.5%) outperformed investment-grade counterparts, continuing their strong rally and returning more than 20% over the past year. Global inflation-linked bonds were flat (0.0%) as losses in Eurozone linkers offset gains in US TIPS (0.8%), which outperformed nominal Treasuries for a seventh consecutive month on higher inflation expectations.
The US dollar retreated against most currencies we track as Trump commented that the greenback is too strong. Among major developed markets currencies, US dollar weakness was most pronounced against the Australian dollar, Japanese yen, and Swiss franc. The British pound strengthened against the US dollar but depreciated versus the other major currencies; sterling weakness came as Prime Minister Theresa May reiterated that the UK government will pursue a clean break from the European Union in upcoming Article 50 negotiations. Despite the euro’s appreciation against the US dollar and UK sterling, dovish commentary from the ECB meant the common currency retreated against the Australian dollar, Japanese yen, Swiss franc, and Canadian dollar. Our equal-weighted emerging markets currency basket appreciated against the US dollar, was flat versus pound sterling, and retreated vis-à-vis the euro. Only the Turkish lira, Mexican peso, and Philippine peso failed to rally against the US dollar.
Market Exhibits
US Consumer Price Inflation
US headline inflation has almost caught up with core inflation and is expected to move higher over the coming months, driven by favorable oil price comparisons with a year ago. The recent moves have contributed to higher inflation expectations, as have recent economic momentum and President Trump’s expected policy agenda
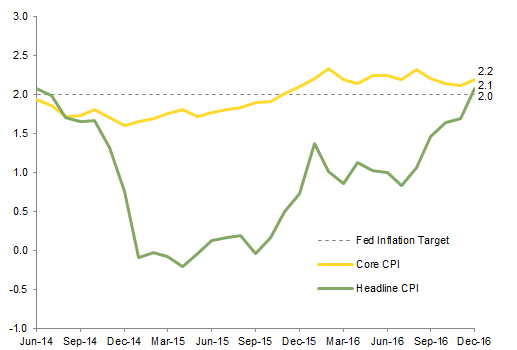
US Consumer Price Inflation
June 30, 2014 – December 31, 2016 • Year-Over-Year Percent Change (%)
Sources: Federal Reserve, Thomson Reuters Datastream, and US Department of Labor – Bureau of Labor Statistics.
Note: Core CPI exclude food and energy prices.
Real Asset Performance by Category
Real asset performance was mixed in January after strong results last year. Commodities were flat as energy losses offset gains in metals and agriculture. Gold rebounded, metals and mining stocks surged, and energy shares declined. MLPs rallied after Trump peeled back regulations on pipeline development. Developed REITs barely advanced
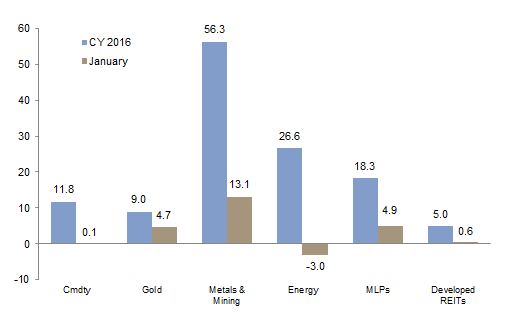
Real Asset Performance by Category
As of January 31, 2017 • US Dollar • Percent Change (%)
Notes: Asset classes represented by: Bloomberg Commodity TR Index (“Cmdty”), MSCI World Metals & Mining Index (“Metals & Mining”), MSCI World Energy Index (“Energy”), Alerian MLP (“MLPs”), and FTSE® EPRA/NAREIT Developed REITs Index (“Developed REITs”). Total return data for all MSCI indexes are net of dividend taxes.
S&P 500 Earnings Growth
The energy sector’s fourth quarter earnings decline is forecast to be the smallest drag on overall S&P 500 earnings growth since third quarter 2014, when the oil price crash began. The energy sector is expected to begin making positive contributions to overall earnings growth rates starting this quarter
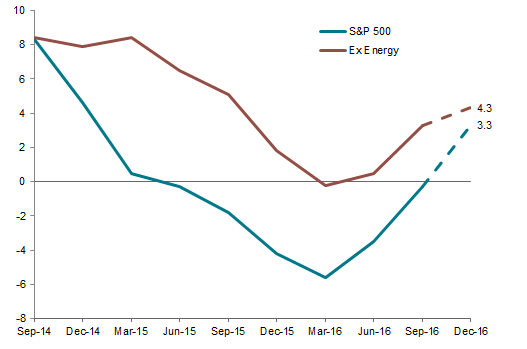
S&P 500 Earnings Growth
Third Quarter 2014 – Fourth Quarter 2016 • Year-Over-Year Percent Change (%)
Sources: FactSet Research Systems and Standard & Poor’s.
Notes: Fourth quarter 2016 data are blended estimates. As of January 27, 34% of S&P 500 companies had reported fourth quarter 2016 earnings.
Median Effective Tax Rate for the S&P 500 Index and Economic Sectors
The wide range of effective tax rates among S&P 500 economic sectors suggests that the potential changes to tax and trade policy would drive different outcomes for different sectors and industries
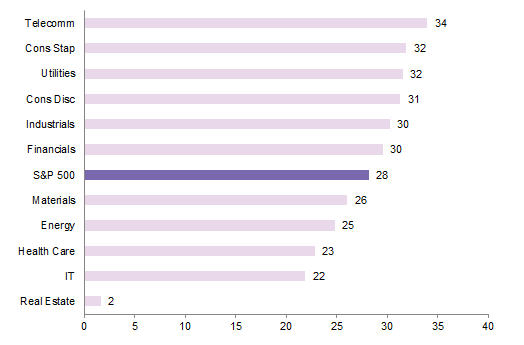
Median Effective Tax Rate for the S&P 500 Index and Economic Sectors
September 30, 2015 – September 30, 2016 • Effective Tax Rate (%)
Sources: Bloomberg L.P. and Standard & Poor’s.
Notes: Effective tax rate represents income tax expense divided by pre-tax income. Companies with negative earnings or missing data were excluded. Sector level data represent the median of the effective tax rate of constituents in the sector and index level data represent the median of all constituents in the index.
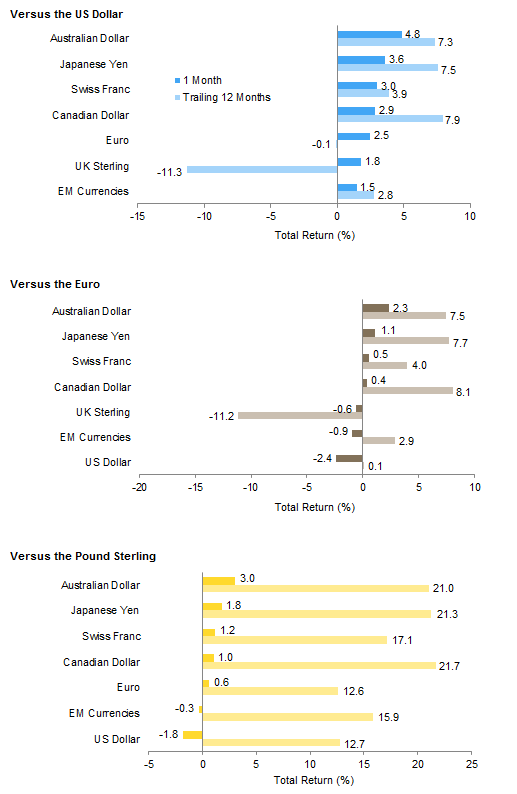
Currency Performance
The US dollar weakened against most currencies we track, including all the developed markets majors, as Trump commented that the greenback is too strong. Dollar weakness contributed to improved sentiment toward emerging markets assets; only three EM currencies failed to appreciate against USD
The euro strengthened versus the US dollar, our EM currency basket and UK sterling but weakened against the Australian dollar, Japanese yen, Swiss franc, and Canadian dollar. The ECB reiterated its accommodative stance at its most recent meeting in January, saying that it will not tighten in response to recent increases in headline inflation, which it views as transitory
The British pound weakened against all major currencies except the US dollar as PM Theresa May reiterated the UK government’s plans to pursue a “hard Brexit” in upcoming Article 50 negotiations with the EU. Sterling also gained slightly against the EM currency basket
Currency Performance
As of January 31, 2017
Sources: MSCI Inc. and Thomson Reuters Datastream. MSCI data provided “as is” without any express or implied warranties.
Note: EM currencies is an equal-weighted basket of 20 currencies.
Index Performance (US$)
Most asset classes advanced in USD terms, except for commodities. Emerging markets stocks led January performance, and dollar weakness also meant developed markets equities and local currency EM debt outpaced US equities, which continued to advance. US high-yield bonds and US TIPS continued to outperform US Treasuries

Index Performance (US$)
As of January 31, 2017
MSCI US Composite Normalized P/E
December 31, 1969 – January 31, 2017
Sources: Barclays, Bloomberg L.P., BofA Merill Lynch, FTSE International Limited, Frank Russell Company, J.P. Morgan Securities, Inc., MSCI Inc., National Association of Real Estate Investment Trusts, Standard & Poor’s, and Thomson Reuters Datastream. MSCI data provided “as is” without any express or implied warranties.
Fixed Income Yields
January 2016 – January 2017
Index Performance (€)
Performance was mixed across asset classes in euro terms. Emerging markets equities outperformed, with European small caps, pan-Euro high-yield bonds, and developed markets equities ex EMU experiencing more muted gains. Europe ex UK equities experienced slight declines but outperformed investment-grade bonds, Europe ex UK REITs, and commodities
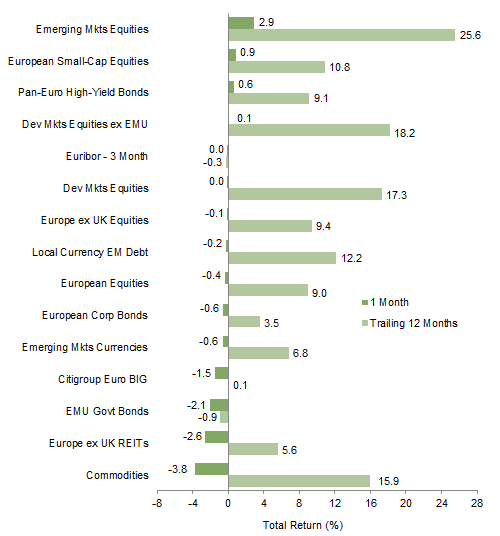
Index Performance (€)
As of January 31, 2017
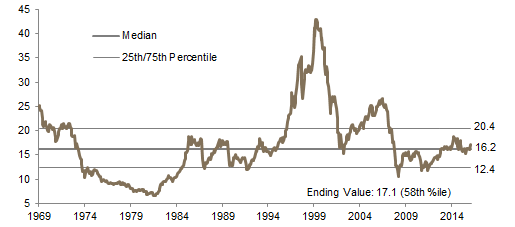
MSCI Europe ex UK Composite Normalized P/E
December 31, 1969 – January 31, 2017
Sources: Barclays, Bloomberg L.P., Citigroup Global Markets, EPRA, FTSE International Limited, J.P. Morgan Securities, Inc., MSCI Inc., National Association of Real Estate Investment Trusts, Standard & Poor’s, and Thomson Reuters Datastream. MSCI data provided “as is” without any express or implied warranties.

Fixed Income Yields
January 2016 – January 2017
Index Performance (₤)
Emerging markets equities led gains in pound sterling terms, followed by UK high-yield bonds, developed ex UK stocks, UK mid caps, local currency EM debt, and UK linkers. UK large caps slightly retreated, but outperformed UK corporate bonds, UK gilts, commodities, and UK REITs, which all experienced more substantial declines
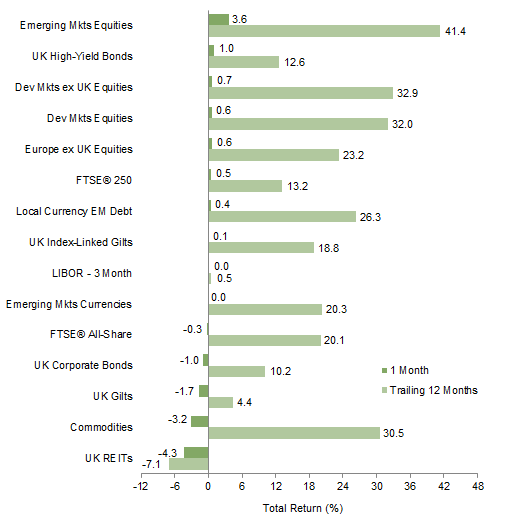
Index Performance (£)
As of January 31, 2017

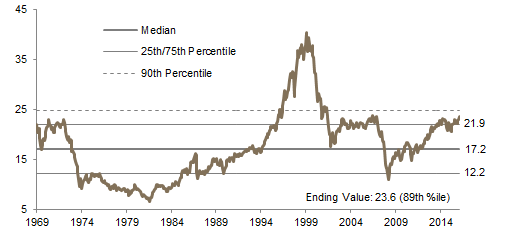
MSCI UK Composite Normalized P/E
December 31, 1969 – January 31, 2017
Sources: Barclays, Bloomberg L.P., BofA Merrill Lynch, EPRA, FTSE International Limited, J.P. Morgan Securities, Inc., MSCI Inc., National Association of Real Estate Investment Trusts, Standard & Poor’s, and Thomson Reuters Datastream. MSCI data provided “as is” without any express or implied warranties.
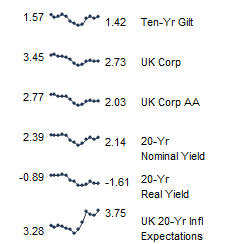
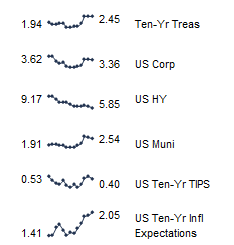
Fixed Income Yields
January 2016 – January 2017
Exhibit Notes
Performance Exhibits
Total return data for all MSCI indexes are net of dividend taxes.
US dollar index performance chart includes performance for the Bloomberg Barclays Aggregate Bond, Bloomberg Barclays Corporate Investment Grade, Bloomberg Barclays High-Yield Bond, Bloomberg Barclays Municipal Bond, Bloomberg Barclays US TIPS, Bloomberg Barclays US Treasuries, BofA Merrill Lynch 91-Day Treasury Bills, FTSE® NAREIT All Equity REITs, J.P. Morgan ELMI+, J.P. Morgan GBI-EM Global Diversified, MSCI Emerging Markets, MSCI World, Russell 2000®, S&P 500, and S&P GSCI™ indexes.
Euro index performance chart includes performance for the Bloomberg Barclays Euro-Aggregate: Corporate, Bloomberg Barclays Pan-Euro High Yield, Citigroup EMU Govt Bonds, Citigroup Euro Broad Investment-Grade Bonds, EURIBOR 3M, FTSE® EPRA/NAREIT Europe ex UK, J.P. Morgan ELMI+, J.P. Morgan GBI-EM Global Diversified, MSCI Emerging Markets, MSCI Europe, MSCI Europe ex UK, MSCI Europe Small-Cap, MSCI World ex EMU, MSCI World, and S&P GSCI™ indexes.
UK sterling index performance chart includes performance for the Bloomberg Barclays Sterling Aggregate: Corporate Bond, BofA Merrill Lynch Sterling High Yield, FTSE® 250, FTSE® All-Share, FTSE® British Government All Stocks, FTSE® British Government Index-Linked All Stocks, FTSE® EPRA/NAREIT UK RE, J.P. Morgan ELMI+, J.P. Morgan GBI-EM Global Diversified, LIBOR 3M GBP, MSCI Emerging Markets, MSCI Europe ex UK, MSCI World, MSCI World ex UK, and S&P GSCI™ indexes.
Valuation Exhibits
The composite normalized P/E ratio is calculated by dividing the inflation-adjusted index price by the simple average of three normalized earnings metrics: ten-year average real earnings (i.e., Shiller earnings), trend-line earnings, and return on equity–adjusted earnings. We have removed the bubble years 1998–2000 from our mean and standard deviation calculations. All data are monthly.
Fixed Income Yields
US fixed income yields reflect Bloomberg Barclays Municipal Bond Index, Bloomberg Barclays US Corporate High-Yield Bond Index, Bloomberg Barclays US Corporate Investment-Grade Bond Index, and the ten-year Treasury.
European fixed income yields reflect the BofA Merrill Lynch Euro Corporate AA Bond Index, BofA Merrill Lynch Euro Corporate Bond Index, Barclays Pan-European Aggregate High Yield Bond Index, Bloomberg Twenty-Year European Government Bond Index (nominal), ten-year German bund, 20-year European Inflation Swaps (inflation expectations), and the real yield calculated as the difference between the inflation expectation and nominal yield.
UK sterling fixed income yields reflect the BofA Merrill Lynch Sterling Corporate AA Bond Index, BofA Merrill Lynch Sterling Corporate Bond Index, UK ten-year gilts, and Bank of England 20-year nominal, real, and zero coupon (inflation expectations) yields.