The new year began with one of the worst starts to a calendar year for global equities, as markets fell sharply in the first three weeks of January before paring some losses into month-end. Renewed volatility and government intervention in China’s domestic equity market and exchange rate, along with another plunge in world oil prices, contributed to fears that the global economy is steering toward a recession. Most equity markets are in the midst of major corrections, while a handful—including Japan, emerging markets, US small caps, and UK large caps—technically entered bear market territory during the month. Global government bonds rallied in contrast, led by UK gilts and US Treasuries. Commodity markets and related assets remained under pressure as oil prices briefly touched levels not seen in more than a decade, with energy master limited partnerships in particular trading another leg down.
Recent market action confirmed that investors face a challenging and uncertain environment in 2016. Global recession concerns are rising despite the International Monetary Fund in January only slightly trimming its overall global growth forecast, which still projects rising growth for the world economy in 2016 and 2017. Markets are concerned about potential contagion from China’s economic transition, including the risk of a major devaluation, as well as from the global energy sector’s ongoing retrenchment. Reports of forced selling of equities last month by sovereign wealth funds of oil-producing nations may suggest one of the hidden linkages. The responses of major central banks to the latest bout of risk aversion varied. The European Central Bank alluded to the potential for further easing in March, the US Federal Reserve acknowledged recent market developments while leaving the door open for a March rate hike, and the Bank of Japan (BOJ) surprised market participants by adopting a negative deposit rate for the first time. Such developments are contributing to investor uncertainty and heightened volatility. Making matters more difficult, higher-quality risk assets like US equities remain expensive, and the best long-term value is found in cyclical assets whose valuations, while quite undemanding today, can get much cheaper still given the potential for further deterioration in economic fundamentals. Meanwhile, January was a reminder that historically low-yielding government bonds still offer important diversification benefits as hedges to equity risk.
US equities (-5.0% as measured by the S&P 500) suffered one of their worst starts to a year in history before rallying to recover some of their prior losses on the last trading day. Despite the late rebound, the decline sent valuations back into their historical fair value range, though they remain in the high end of this range and expensive relative to global peers. Small caps (-8.8%) meaningfully underperformed large caps, with the Russell 2000® falling 23% peak-to-trough since its late-June high. Value edged out growth for the first time in several months, as plummeting biotech shares hurt small-cap growth performance. Ongoing earnings downgrades for the energy sector have clouded the picture for a US earnings recovery in 2016, with energy stocks now forecast to suffer losses for a second straight year. Further dollar strength is also weighing on the earnings outlook for sectors like information technology with significant revenue exposure overseas. If the latest consensus estimates hold up, the S&P 500 would be at risk of experiencing another year of lackluster earnings results.
European equities (-4.9%) were led by UK equities (-2.4%), which outperformed Europe ex UK (-6.0%) and EMU (-6.3%) markets in aggregate. UK equities may have benefitted from sterling weakness as stocks in more export-oriented sectors like consumer staples, industrials, and health care outperformed their counterparts in the Eurozone and the United States, whose currencies strengthened. EMU equities were dragged down by Germany (-8.6%), which has the greatest trade ties with a slowing China, and Italy (-13.2%), where the government’s plan to address local banks’ non-performing loan issues underwhelmed investors.
Japanese equities (-7.6%) underperformed other major markets as investors sold stocks in response to a strengthening yen, which has become a perceived safe-haven asset in recent months, and further signs of weakness in key trading partner China. On January 29, the BOJ reacted to the recent yen strength and a disappointing December inflation reading by adopting a negative deposit rate scheme on new excess reserves for the first time in the nation’s history. This came just days after BOJ Governor Haruhiko Kuroda commented that negative rates were not an option. Such an about face shows the pressure on the central bank to support the economy given the government’s disappointing progress on structural reforms and following the surprise resignation of Prime Minister Shinzō Abe’s economic minister, a key architect of the “Abenomics” initiative.
Emerging markets equities (-5.2%) slightly outperformed developed markets (-5.4%) in local currency terms but slightly underperformed in all seven major developed markets currencies. Foreign portfolio investors are estimated to have withdrawn capital for a seventh straight month. From a regional performance standpoint, Latin America (-1.9%) and emerging Europe, the Middle East & Africa (-2.4%) outpaced emerging Asia (-6.4%). The latter was dragged lower by China (-12.4%), where the official GDP growth estimate of 6.9% for 2015 met expectations but was overshadowed by renewed currency volatility and falling foreign exchange reserves, which have now fallen almost US$700 billion in the last 18 months, including a record US$108 billion decline in December alone, based on data from the People’s Bank of China.
Most inflation-sensitive assets also declined in January’s bout of risk aversion. Commodity prices continued to fall, with crude oil prices briefly touching $28/barrel, a level not seen since 2003. One catalyst was the removal of most economic sanctions (including the oil export ban) against Iran, which surprised the market by fulfilling its obligations under the Joint Action Committee nuclear treaty earlier than expected. Commodity futures experienced further declines (-1.7% for the Bloomberg Commodity TR Index and -5.2% for the energy-heavy S&P GSCI™), although among risk assets, the Bloomberg Commodity Index outperformed. Natural resources equities (-3.2%) experienced similar declines yet outperformed broader equity markets as energy stocks pared losses after crude prices rallied into month-end. Energy master limited partnerships (-11.1%) sold off further due to ongoing concerns regarding the sustainability of current distribution policies. US, UK, and Europe ex UK REITs also suffered losses, ranging from -3.0% to -5.7%. Global inflation-linked bonds were the exception as UK linkers (4.8%) rallied sharply and US Treasury Inflation-Protected Securities (1.5%) also saw gains.
Global government bonds (2.1%) rallied as investors dialed back risk exposures. UK gilts (3.6%) outpaced US Treasury bonds (2.1%) and EMU sovereigns (2.0%). The US Treasury yield curve flattened further, with the ten-year yield falling 33 bps to 1.94%, and the three-month yield rising 17 bps to 0.33% as of month-end. US tax-exempt bonds (1.2%) also enjoyed another strong month, while US corporate investment-grade bonds (0.4%) saw more muted gains. US high-yield bonds (-1.6%) suffered further losses amid ongoing fund redemptions, as falling oil prices drove energy credit spreads to dizzying levels.
The US dollar strengthened against all major developed markets currencies, though dollar appreciation versus the euro and yen was fairly muted owing to safe-haven flows toward these two currencies. The yen in particular experienced strong appreciation versus its trading partners, which likely forced the BOJ’s hand. In contrast, the pound sterling weakened over 3% versus the dollar, euro, and yen. Disappointing inflation and economic data releases and the looming EU referendum have dialed back the market’s expected timing for the Bank of England’s first rate hike well into 2017. Meanwhile, most emerging markets currencies were weaker against the greenback, with the Mexican peso, South Korean won, South African rand, and Indian rupee depreciating the most among the more liquid currencies we track.
A record drop in China’s foreign exchange reserves in December and further RMB weakness into January fueled renewed fears that China will be forced into a major devaluation. The government’s heavy-handed response in the offshore currency market seemed an attempt to reassert its control and deter speculators, but may have fanned their determination instead
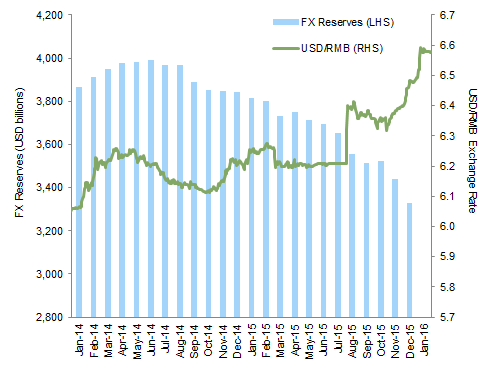
China FX Reserves and Exchange Rate
January 1, 2014 – January 31, 2016
Sources: Bloomberg L.P., The People’s Bank of China, and Thomson Reuters Datastream.
Notes: Exchange rate data are daily. FX reserves are as of December 31, 2015.
Crude oil prices ended January below the month-end low observed during the depths of the global financial crisis in 2009; during the month global oil prices briefly touched $28/barrel, a level not seen since 2003

Brent Crude Oil Prices
January 31, 1970 – January 31, 2016 • US$/Barrel
Sources: Bloomberg L.P. and Global Financial Data, Inc.
Note: Data are monthly.
The S&P 500’s roughly 5% decline in January was among the worst starts to a year in our data set; however, it does not necessarily portend a down year overall. The index finished the calendar year flattish to positive in five of the nine other worst January declines, including the years involving the three largest first-month sell-offs

Worst S&P 500 Declines in January
As of January 31, 2016 • Percent (%) Decline • USD Terms
Sources: Standard & Poor’s and Thomson Reuters Datastream.
Notes: Monthly return data start in 1900. Numbers in parenthesis represent calendar year returns.
Emerging markets equities’ 27% peak-to-trough decline is roughly equal in magnitude to the typical bear market since the index’s 1988 inception. In contrast, the length of the current decline, at almost nine months, means it has persisted for longer than all but two major corrections (2001 and 2008)
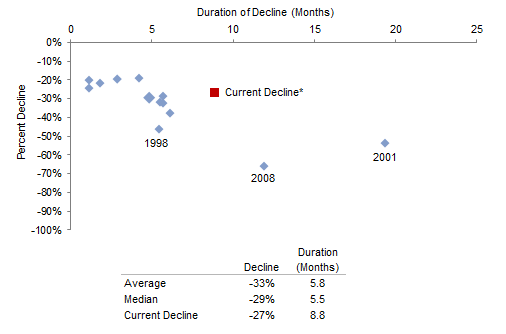
EM Equity Market Declines of ~20% or More
January 1, 1988 – January 31, 2016 • Local Currency
Sources: MSCI Inc. and Thomson Reuters Datastream. MSCI data provided “as is” without any express or implied warranties.
Note: Declines of at least 19% were chosen.
* Current decline for emerging markets equities represents the period April 27, 2015, to January 21, 2016.
Not surprisingly, US Treasuries were the top performers in January’s risk-off environment. Dollar strength meant that the S&P 500 outperformed both developed and emerging markets equities for US dollar investors. US small caps fell sharply and are now in a bear market; biotech shares in particular came under pressure

Index Performance (US$)
As of January 31, 2016
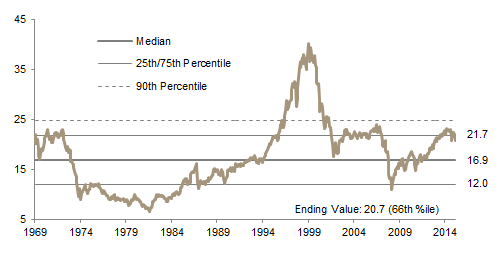
MSCI US Composite Normalized P/E
December 31, 1969 – January 31, 2016
Sources: Barclays, BofA Merill Lynch, FTSE International Limited, Frank Russell Company, J.P. Morgan Securities, Inc., MSCI Inc., National Association of Real Estate Investment Trusts, Standard & Poor’s, and Thomson Reuters Datastream. MSCI data provided “as is” without any express or implied warranties.
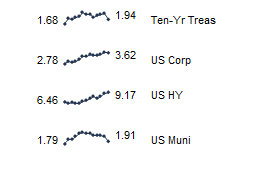
Fixed Income Yields
January 2015 – January 2016
Investment-grade European bonds rallied in contrast to broad equity market declines, with EMU sovereigns outperforming European corporates for euro-based investors. Europe ex UK equities slightly underperformed global peers, while European small caps suffered larger declines and gave back some of their strong gains of the past year
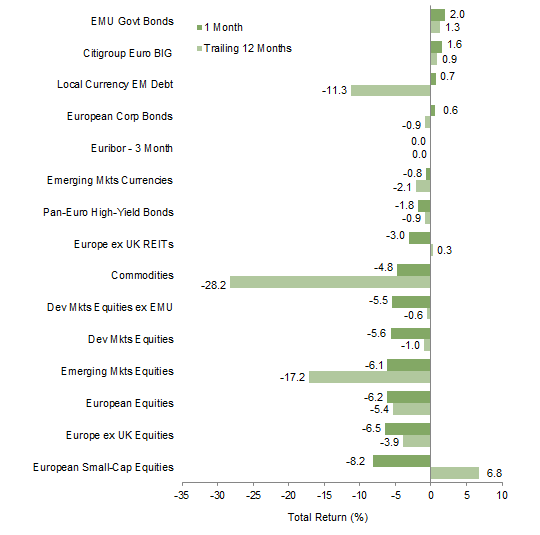
Index Performance (€)
As of January 31, 2016
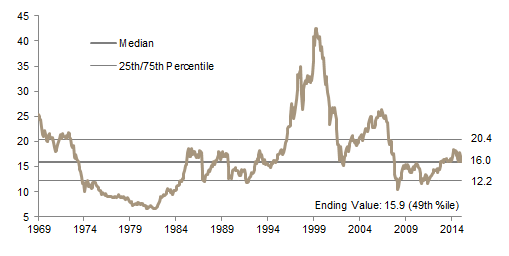
MSCI Europe ex UK Composite Normalized P/E
December 31, 1969 – January 31, 2016
Sources: Barclays, Citigroup Global Markets, EPRA, FTSE International Limited, J.P. Morgan Securities, Inc., MSCI Inc., National Association of Real Estate Investment Trusts, Standard & Poor’s, and Thomson Reuters Datastream. MSCI data provided “as is” without any express or implied warranties.

Fixed Income Yields
January 2015 – January 2016
UK government bonds enjoyed a powerful rally, with linkers gaining nearly 5%, pushing real yields further into negative territory. Broad weakness in the pound sterling led UK equities to underperform global peers in GBP terms, with UK mid caps and REITs producing the largest declines

Index Performance (₤)
As of January 31, 2016
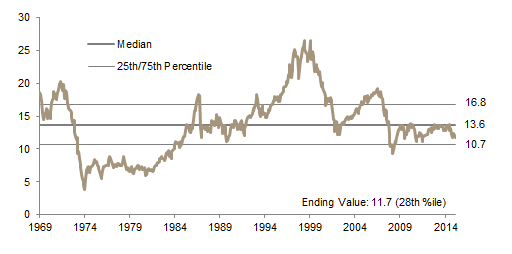
MSCI UK Composite Normalized P/E
December 31, 1969 – January 31, 2016
Sources: Barclays, BofA Merrill Lynch, EPRA, FTSE International Limited, J.P. Morgan Securities, Inc., MSCI Inc., National Association of Real Estate Investment Trusts, Standard & Poor’s, and Thomson Reuters Datastream. MSCI data provided “as is” without any express or implied warranties.

Fixed Income Yields
January 2015 – January 2016
The US dollar strengthened against all major DM currencies and most EM currencies. Dollar appreciation was modest versus the euro and yen owing to safe-haven flows into these two currencies. In fact, the yen had rallied substantially versus the dollar and euro until the BOJ’s January 29 announcement that it would soon adopt a negative deposit rate for new excess reserves
The euro depreciated slightly versus the US dollar, but appreciated against all other major DM currencies. After the Swiss franc rallied to parity with the euro following the Swiss National Bank’s January 2015 decision to lift its peg, the franc has weakened over 10% versus the euro
The pound weakened over 3% versus the dollar, euro, and yen. Disappointing inflation prints and the UK’s looming EU referendum have led the market to push out the expected timing of the Bank of England’s first rate hike well into 2017
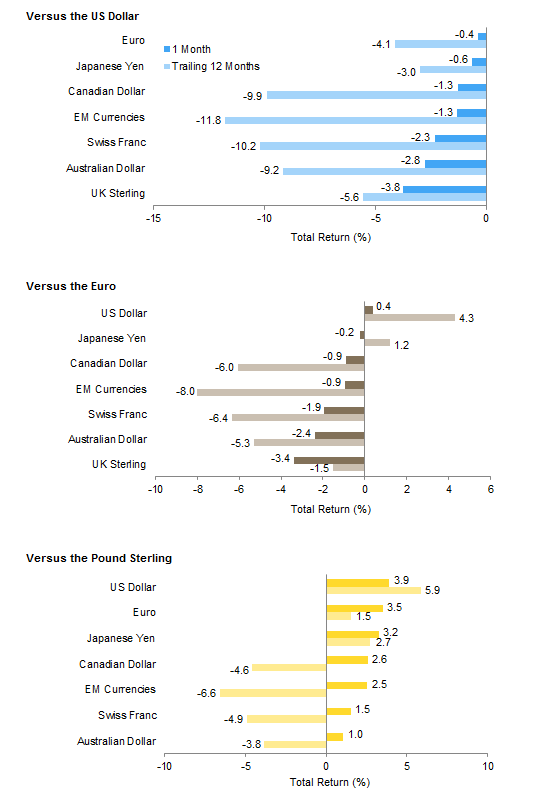
Currency Performance
As of January 31, 2016
Sources: MSCI Inc. and Thomson Reuters Datastream. MSCI data provided “as is” without any express or implied warranties.
Note: EM currencies is an equal-weighted basket of 20 currencies.
Exhibit Notes
Performance Exhibits
Total returns for MSCI developed markets indexes are net of dividend taxes. Total returns for MSCI emerging markets indexes are gross of dividend taxes.
US dollar index performance chart includes performance for the Barclays Corporate Investment Grade, Barclays High Yield Bond, Barclays Municipal Bond, Barclays US TIPS, Barclays US Treasuries, BofA Merrill Lynch 91-Day Treasury Bills, FTSE® NAREIT All Equity REITs, J.P. Morgan ELMI+, J.P. Morgan GBI-EM Global Diversified, MSCI Emerging Markets, MSCI World, Russell 2000®, and S&P GSCI™ indexes.
Euro index performance chart includes performance for the Barclays Euro-Aggregate: Corporate, Barclays Pan-Euro High Yield, Citigroup EMU Govt Bonds, FTSE® EPRA/NAREIT Europe ex UK, J.P. Morgan ELMI+, J.P. Morgan GBI-EM Global Diversified, MSCI Emerging Markets, MSCI Europe, MSCI Europe ex UK, MSCI Europe Small Cap, MSCI World ex EMU, MSCI World, and S&P GSCI™ indexes.
UK sterling index performance chart includes performance for the Barclays Sterling Agg Corps, BofA Merrill Lynch Sterling High Yield, FTSE® British Government All Stocks, FTSE® British Government Index-Linked All Stocks, FTSE® EPRA/NAREIT UK RE, FTSE® 250, J.P. Morgan ELMI+, J.P. Morgan GBI-EM Global Diversified, MSCI Emerging Markets, MSCI Europe ex UK, MSCI World, MSCI World ex UK, and S&P GSCI™ indexes.
Valuation Exhibits
The composite normalized P/E ratio is calculated by dividing the inflation-adjusted index price by the simple average of three normalized earnings metrics: ten-year average real earnings (i.e., Shiller earnings), trend-line earnings, and return on equity–adjusted earnings. We have removed the bubble years 1998–2000 from our mean and standard deviation calculations. All data are monthly.
Fixed Income Yields
US fixed income yields reflect Barclays Municipal Bond Index, Barclays US Corporate High Yield Bond Index, Barclays US Corporate Investment-Grade Bond Index, and the ten-year Treasury.
European fixed income yields reflect the BofA Merrill Lynch Euro Corporate AA Bond Index, BofA Merrill Lynch Euro Corporate Bond Index, Barclays Pan-European Aggregate High Yield Bond Index, Bloomberg Twenty-Year European Government Bond Index (nominal), ten-year German bund, 20-year European Inflation Swaps (inflation expectations), and the real yield calculated as the difference between the inflation expectation and nominal yield.
UK sterling fixed income yields reflect the BofA Merrill Lynch Sterling Corporate AA Bond Index, BofA Merrill Lynch Sterling Corporate Bond Index, UK ten-year gilts, and Bank of England 20-year nominal, real, and zero coupon (inflation expectations) yields.